DBC Falls In Q1: The Bull Market In Commodities Is Not Over

Summary
- Commodities post an overall loss in Q1, led on the downside by energy, while soft commodities post the most significant gain.
- Gold and copper are barometers that point higher.
- Energy falls, but the worst-performing sector during one period tends to lead in the next - OPEC turbocharges oil in early Q2.
- We discuss the reasons why commodities are likely to resume their upward trends.
- Invesco DB Commodity Index Tracking Fund ETF is an energy-weighted exchange-traded fund product - DBC fell in Q3, which could be a buying opportunity.
- Looking for more investing ideas like this one? Get them exclusively at Hecht Commodity Report. Learn More »
Torsten Asmus
The commodities asset class fell in Q1 2023. The leading stock market indices posted gains after a bearish 2022. The NASDAQ (COMP.IND) led the way on the downside in 2022, falling 33.1%, but it recovered by 16.77% over the first three months of 2023. The S&P 500 (SP500) declined 19.44% last year but was 7.03% higher in Q1. The DJIA (DJI) dropped 8.78% in 2022 and edged only 0.38% higher from December 30, 2022, through March 31, 2023.
Markets reflect the economic and geopolitical landscapes, which remain highly uncertain in 2023. The war in Ukraine continues to rage. The Fed's hawkish monetary policy caused two U.S. bank failures in Q1, and UBS had to swoop in to take over troubled Credit Suisse to prevent a collapse.
Meanwhile, the U.S. long bond rallied 4.91% in Q1, and the dollar index edged 1.05% lower, which is not bearish for commodity prices. However, bull markets rarely move in straight lines, and the overall composite of 29 of the leading raw materials that trade on the U.S. and U.K. exchanges posted a loss.
The Invesco DB Commodity Index Tracking Fund ETF (NYSEARCA:DBC) is a highly liquid exchange-traded fund ("ETF") weighted to energy commodities. DBC edged lower in Q1, underperforming the commodities composite.
Commodities post an overall loss in Q1
The commodities asset class consisting of 29 of the leading raw material markets trading on the U.S. and U.K. futures and forwards markets declined 1.94% in Q1 2023.
The six sectors making up the commodities asset class posted the following Q1 results:
- Soft commodities were the best-performing sector, with an 11.12% gain.
- Animal proteins edged 0.58% higher.
- Base metals fell 2.91%.
- Grains moved 4.10% lower.
- Precious metals declined by 4.37%.
- Energy commodities were the worst-performing sector, with an 11.96% loss.
The commodities posting double-digit percentage gains were:
- Gasoline crack spreads: +55.42%
- Frozen concentrated orange juice: +30.57%
- Cocoa: +12.81%
- World sugar: +11.03%
The commodities posting double-digit percentage losses were:
- Natural gas: -50.48%
- Distillate crack spreads: -41.28%
- Rhodium: -41.18%
- Rotterdam coal: -25.98%
- LME nickel forwards: -20.67%
- Heating oil: -20.47%
- Palladium: -18.35%
- Lean hogs: -14.20%
- Soybean oil: -13.04%
- CBOT wheat: -12.59%
In Q1, fifteen commodities of forty moved higher, while twenty-five declined.
Gold and copper are barometers
Gold and copper are significant bellwether markets in the raw material asset class.
Gold is a hybrid, as the metal has industrial and financial applications, and gold has long been a store of value and an inflation barometer. Gold futures edged only 0.13% lower last year, but the precious metal reached a new record high at $2,072 per ounce in March 2022. In Q1, gold was the best-performing precious metal, posting a 7.82% gain and closing at the $1,969 per ounce level on the nearby futures contract on March 31, 2023. June COMEX gold futures settled at $1,986.20 at the end of Q1 2023.
Chart of COMEX Gold Futures (Barchart)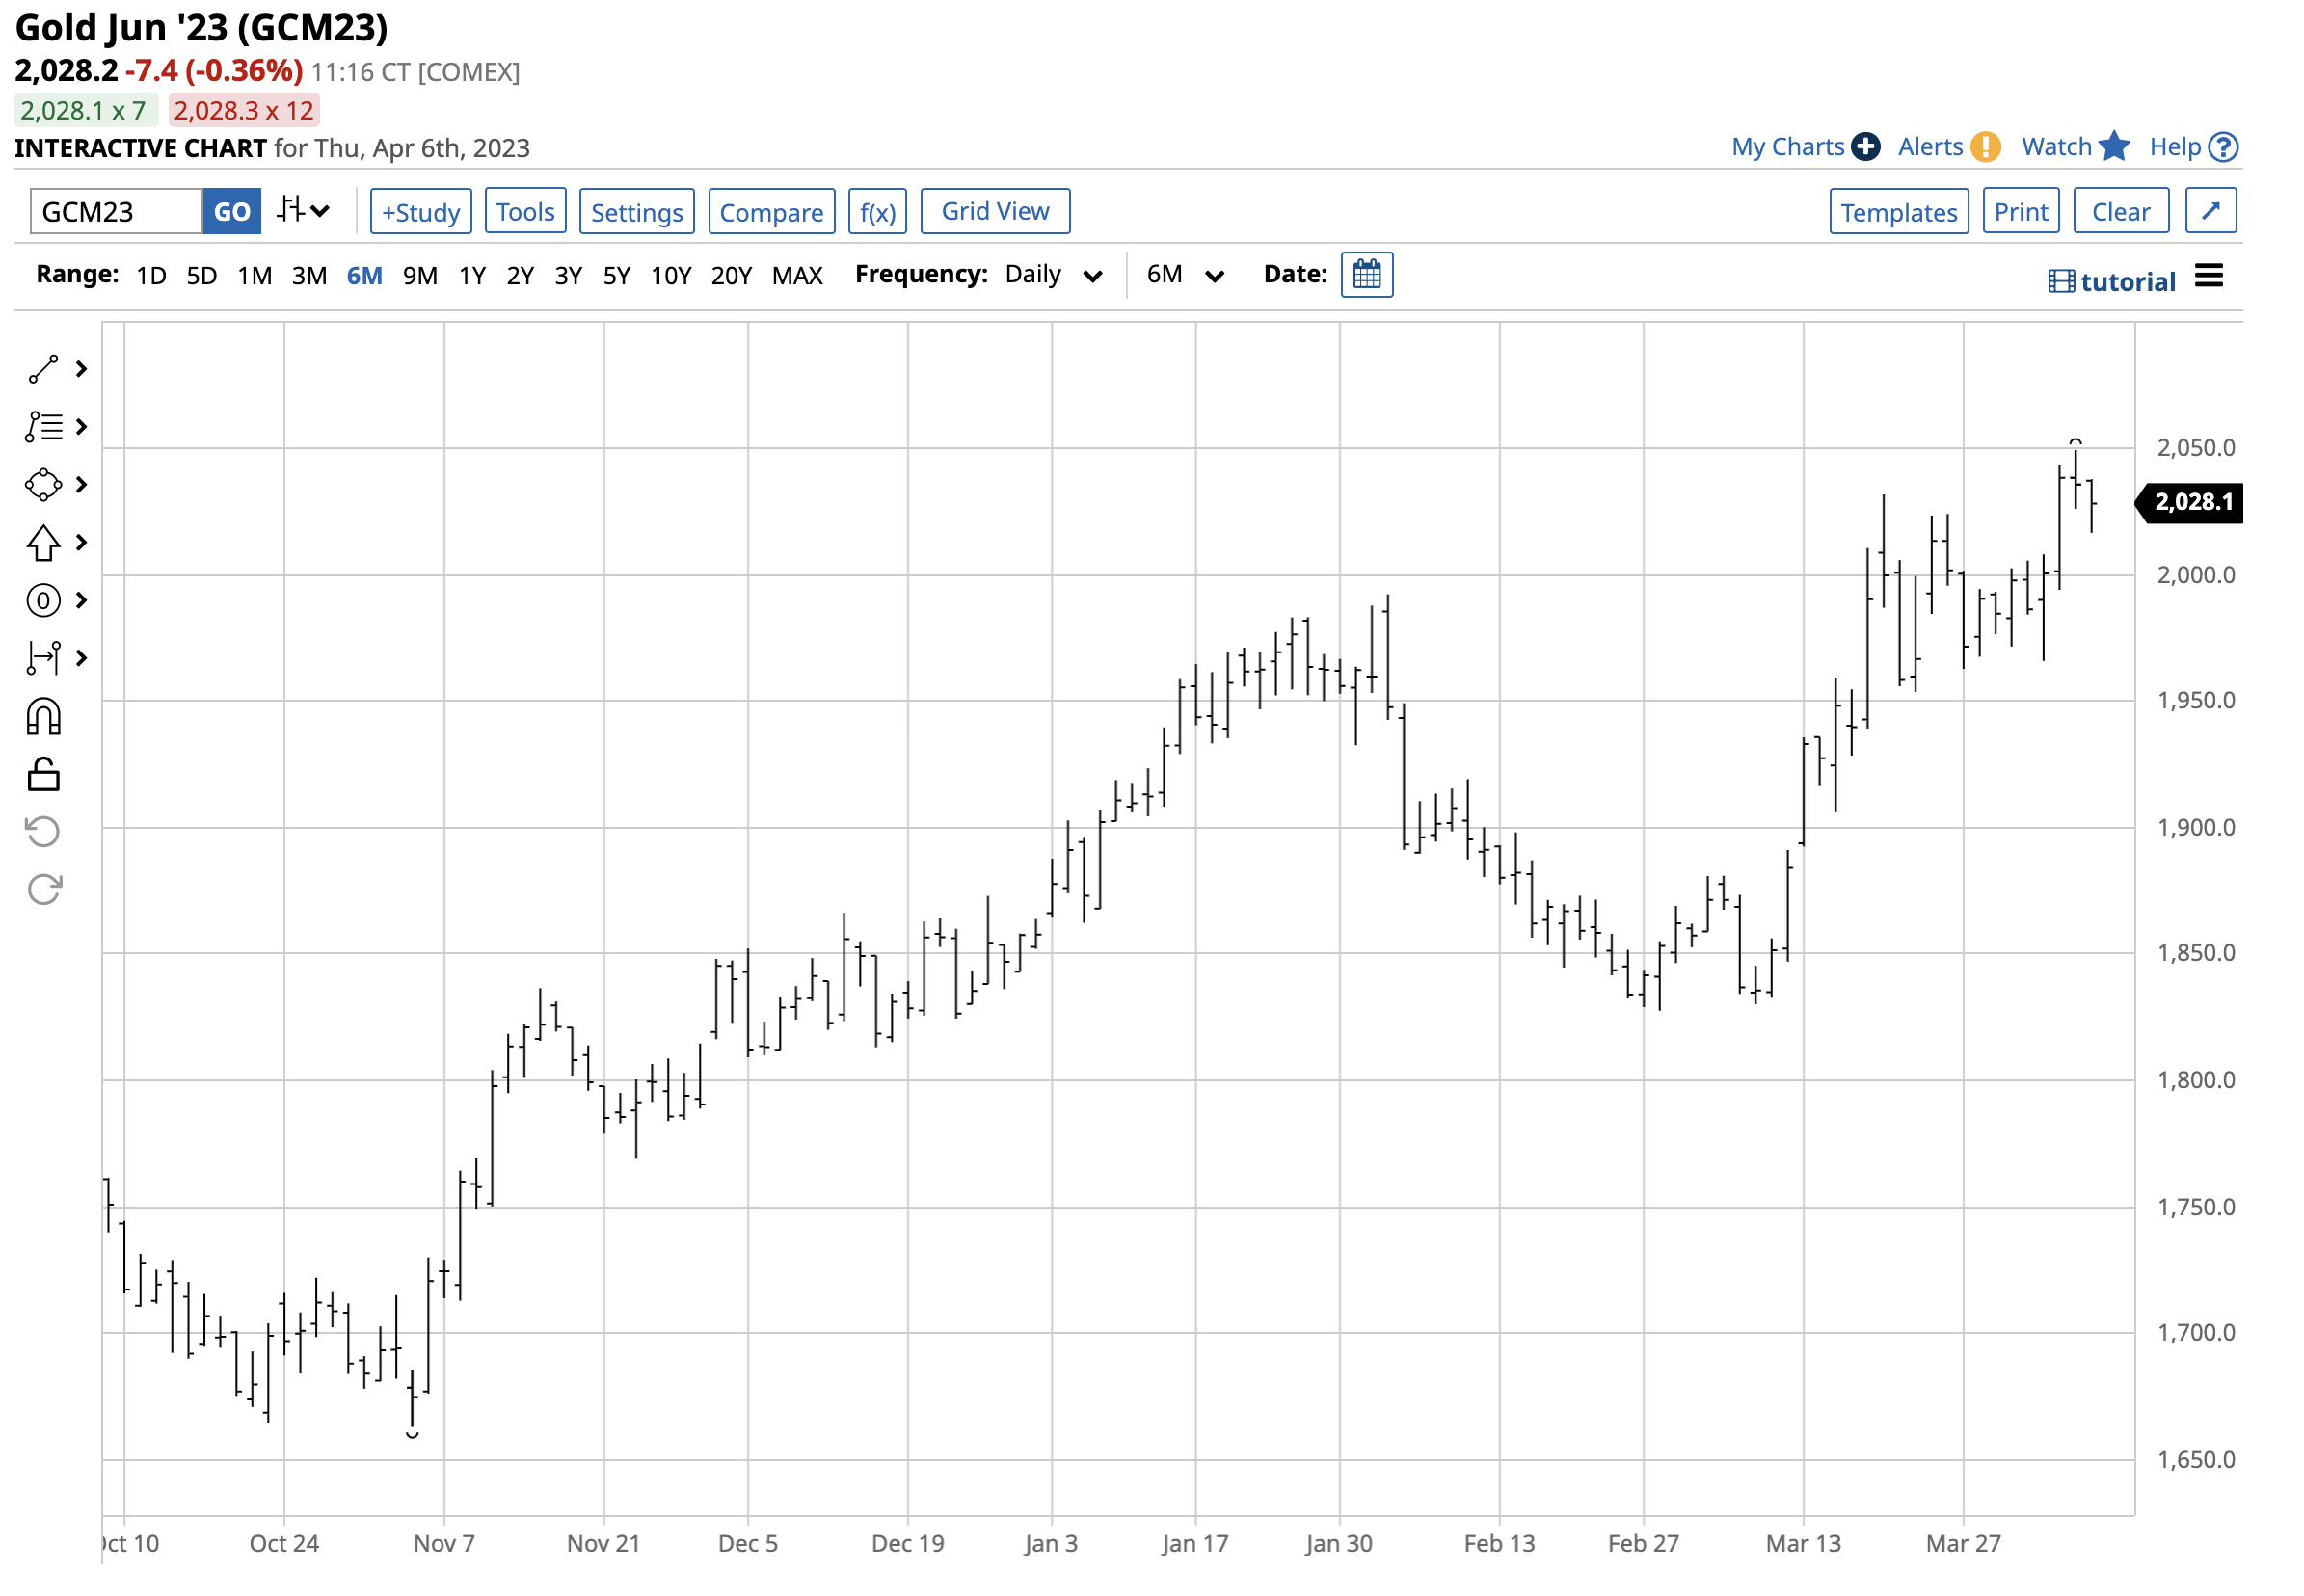
The chart highlights at the $2,028.20 level on April 6, June gold futures was already 2.11% higher from the Q1 closing level in early Q2 2023.
Copper, like gold, rose in Q1 2023. LME copper forwards moved 13.87% lower in 2022 but reached a new record peak at $10,845 per ton in March 2022. COMEX copper futures fell 14.63% in 2022 after reaching a new all-time high of $5.01 per pound in March 2022. In Q1 2023, LME and COMEX copper forwards and futures increased by 7.42% and 7.45%, respectively. LME copper was at the $8,993 per metric ton level on March 31, with nearby May COMEX copper futures at $4.0945 per pound.
While gold rallied in early Q2 2023, copper declined to the $4 level as of April 6.
Chart of COMEX Copper Futures (Barchart)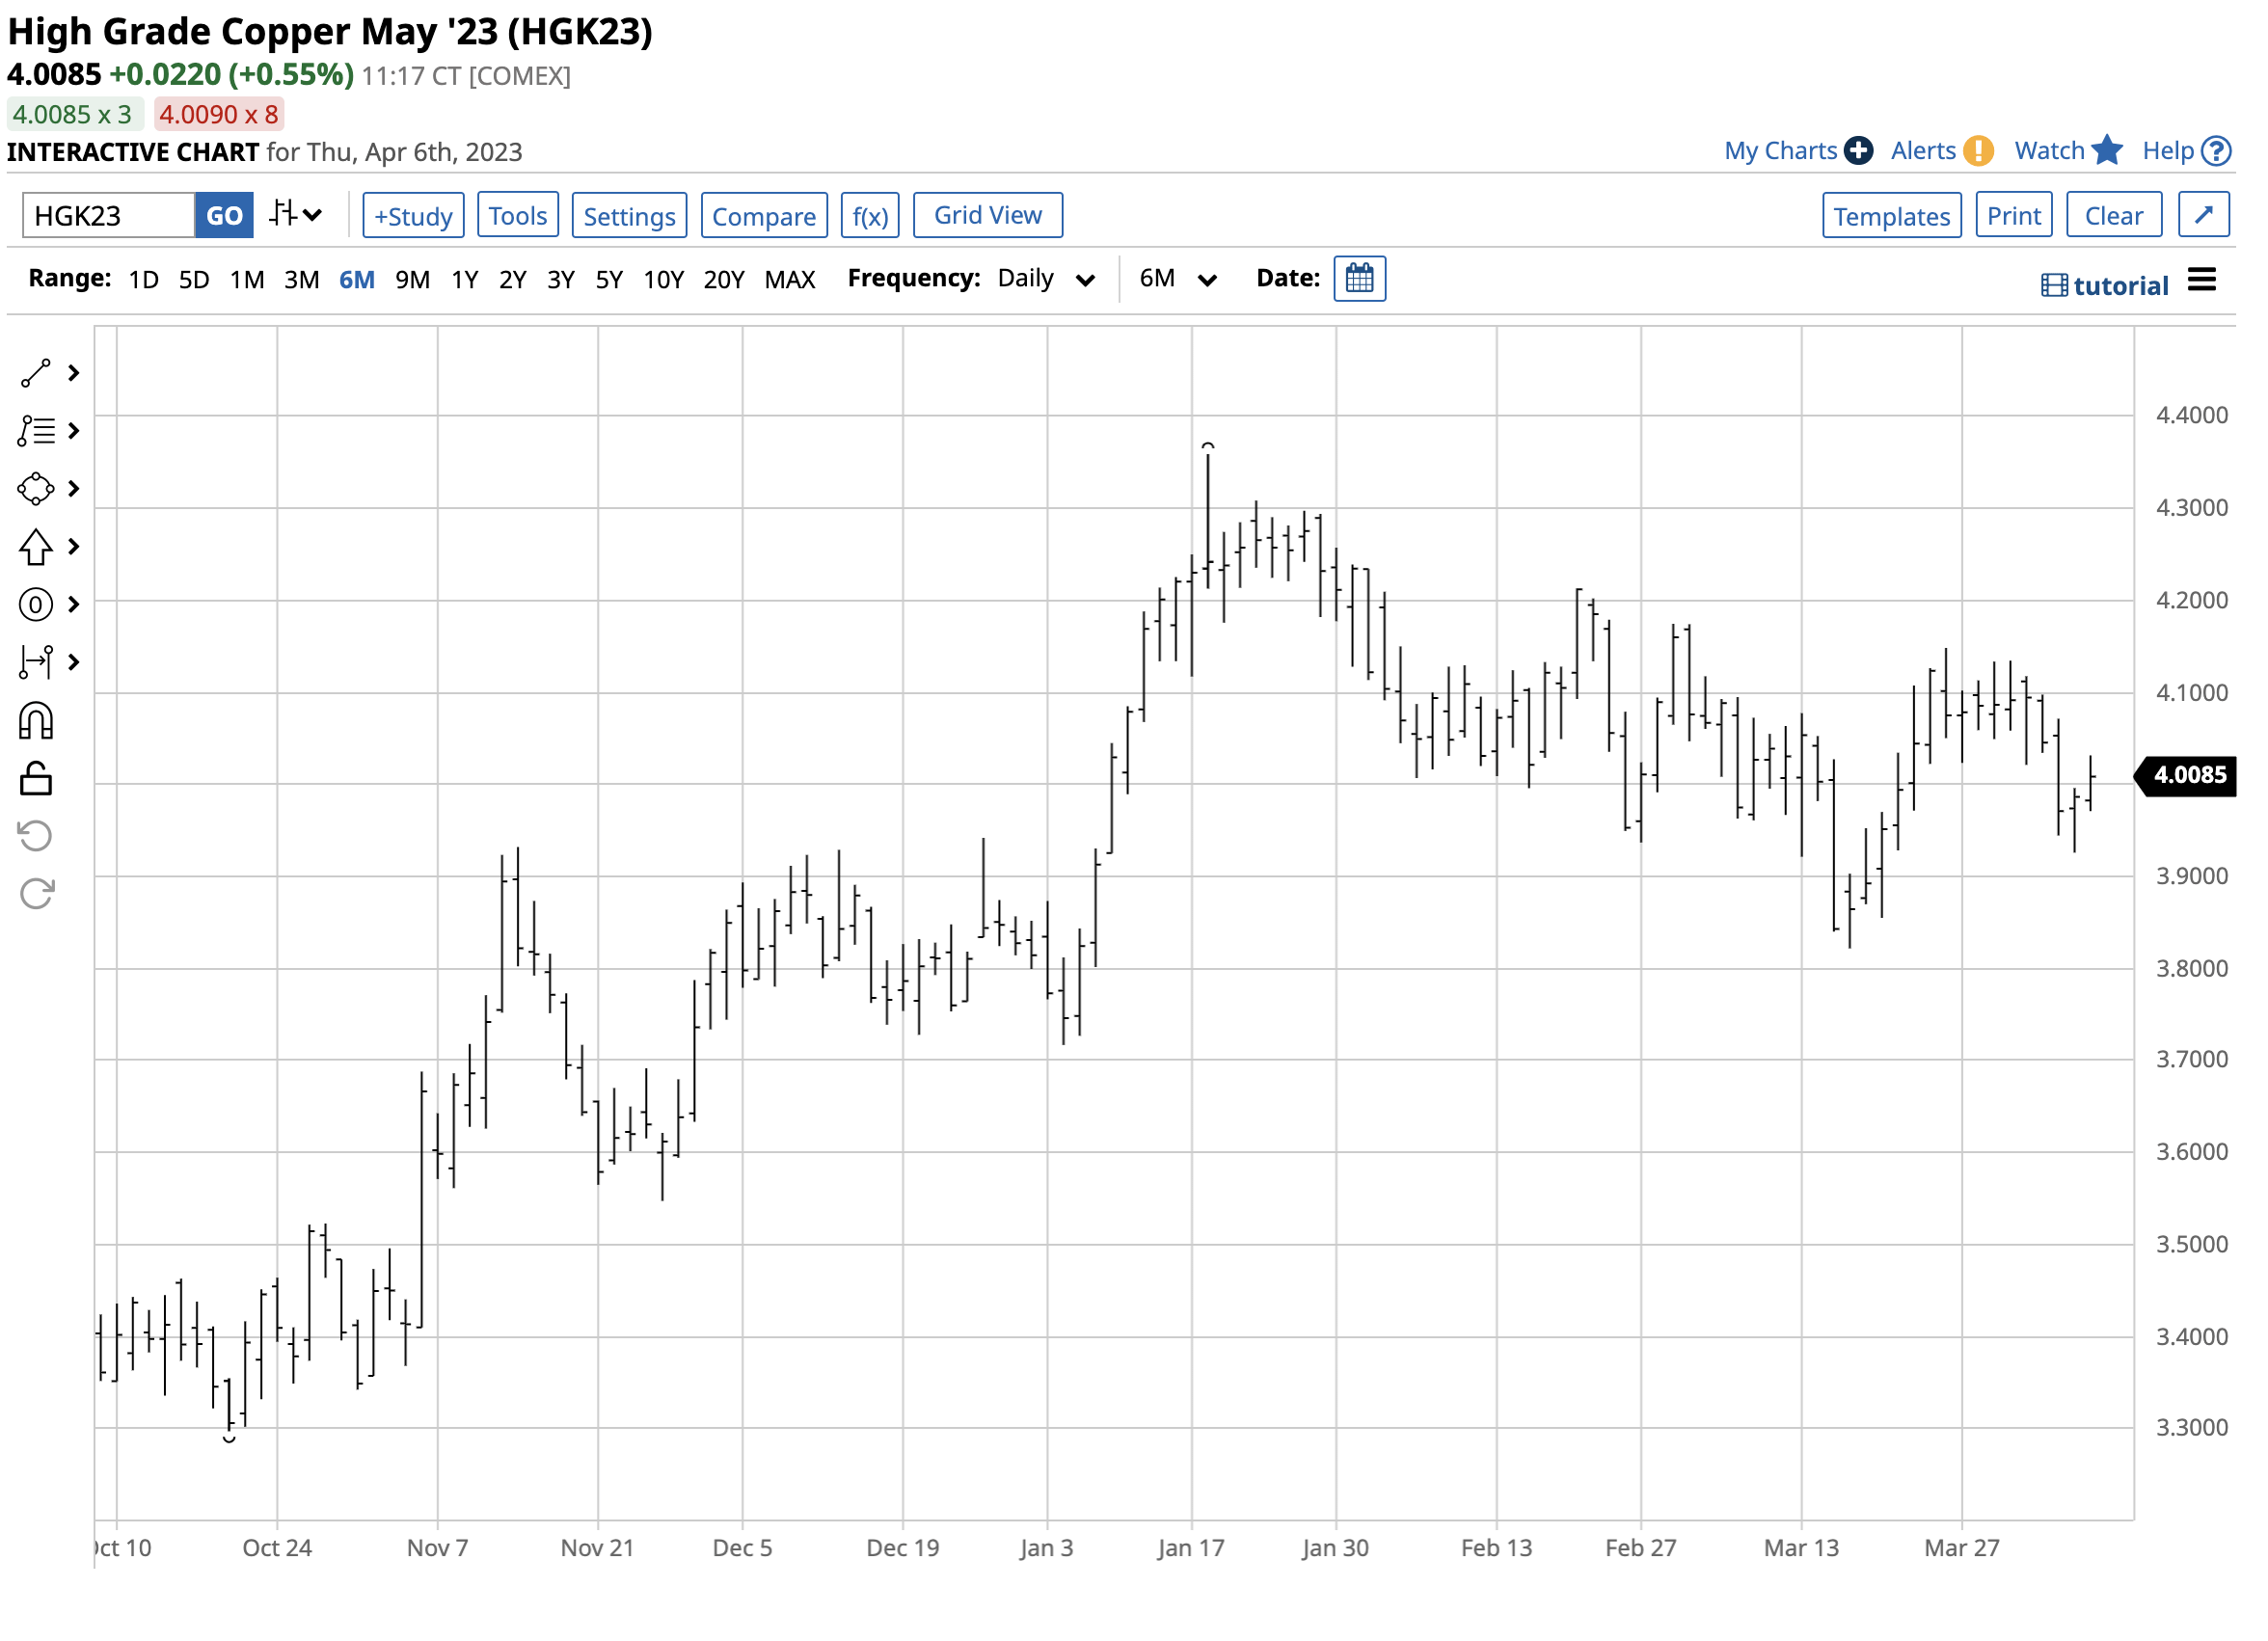
At the $4.0085 level on April 6, COMEX copper futures were 2.10% lower than the March 31, 2023, closing price.
Gold's rise in Q1 and early Q2 is a commentary on fiat currency values. The current path of least resistance in the gold market suggests a challenge of the March 2022 record high is on the horizon.
Copper's rise in Q1 reflected the base metal's overall supply and demand fundamentals. LME copper inventories declined 27.2% in Q1 to below the 65,000 metric ton level on March 31, 2023. Meanwhile, copper futures have been trading on either side of the $4 per pound level over the past weeks, a midpoint between the March 2022 $5.01 record high and the July 2022 $3.15 low.
Copper and gold prices are a critical barometer for the commodities asset class and the overall economy. The long-term path of least resistance of copper and gold remains higher in early 2023.
Energy falls
Crude oil prices traded at over $130 per barrel in March 2022 when Russia invaded Ukraine. Since reaching its highest price since 2008, crude oil has made lower highs and lower lows in a correction that took nearby NYMEX futures to a $64.12 low in March 2023.
The U.S. Biden administration sold an unprecedented amount of the U.S. Strategic Petroleum Reserve ("SPR") in 2022, pushing the SPR to the lowest level since December 1983 at 371.6 million barrels. The administration had said it would replace the SPR when prices fell below the $70 per barrel level. Meanwhile, there are no signs that the administration purchased oil below $70 when the opportunity arose.
The administration may have missed the mark, as OPEC+ cut production by over one million barrels per day on April 2, sending the price back over the $80 per barrel level.
Chart of NYMEX Crude Oil Futures (Barchart)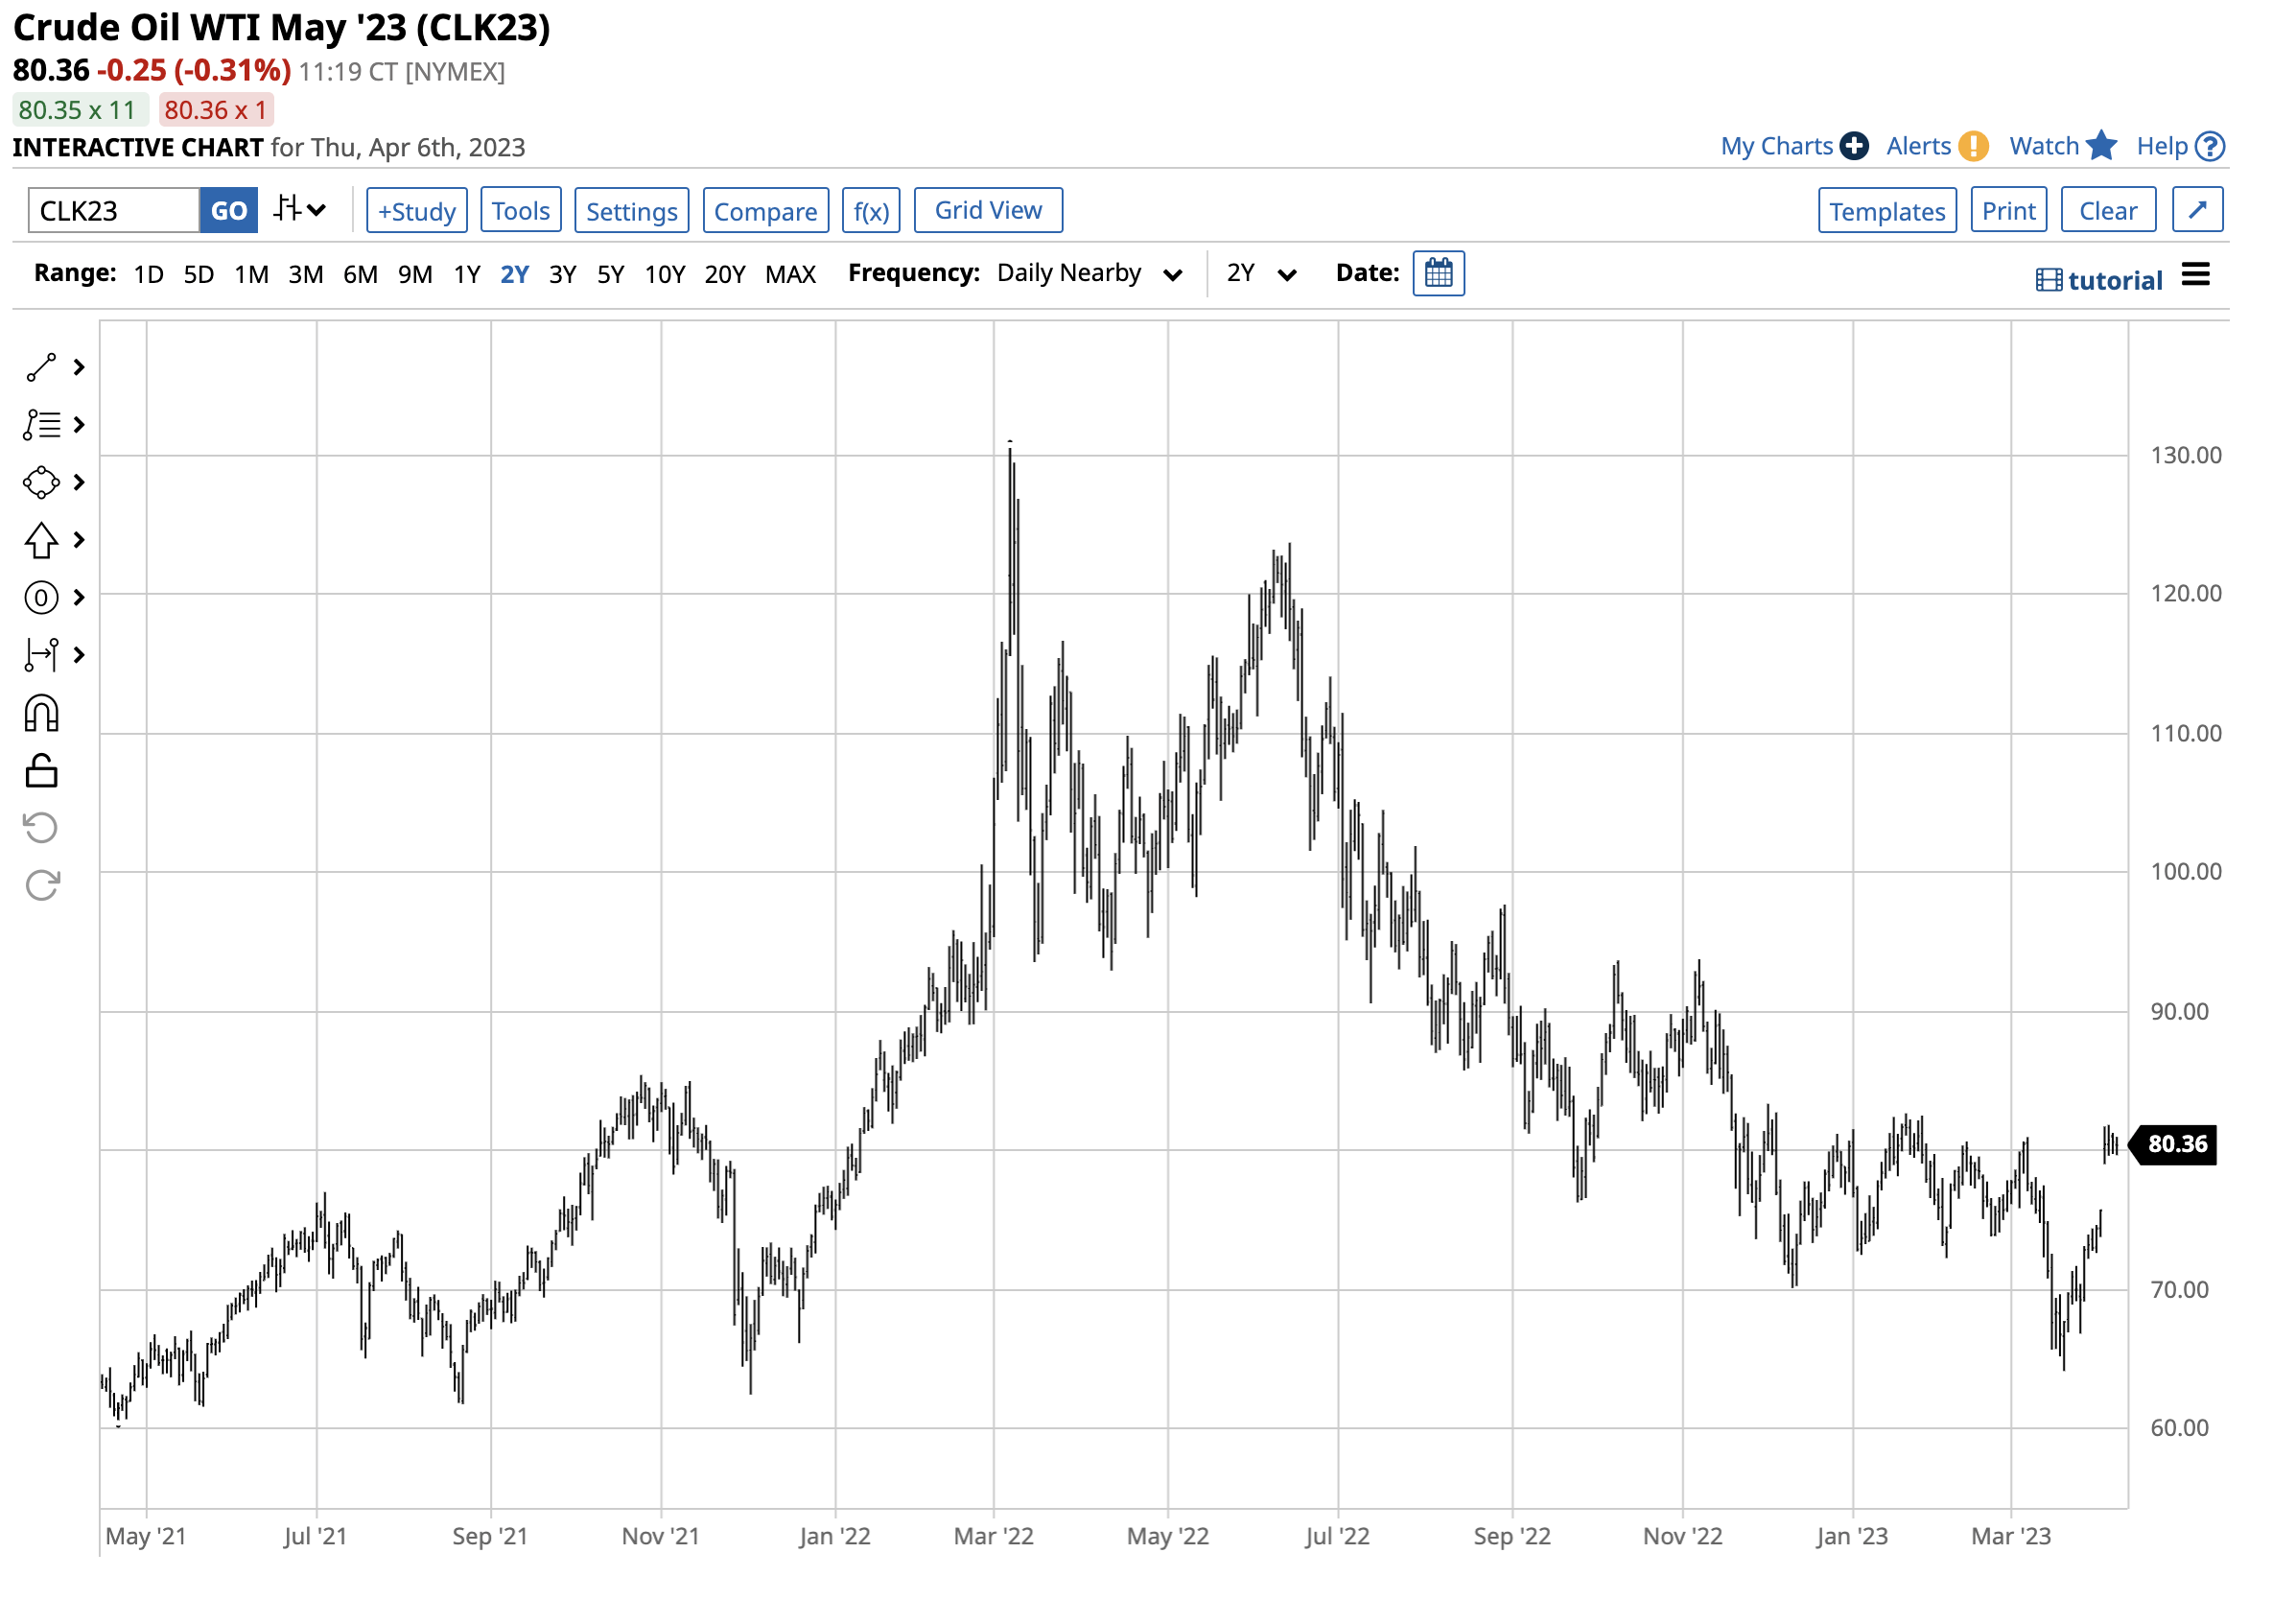
Nearby NYMEX crude oil fell 5.72% in Q1, with the May contract settling at $75.67 on March 31. Nearby June Brent futures were 6.91% lower, settling at $79.89 at the end of Q1. WTI and Brent crude oil futures moved 6.71% and 10.39% higher, respectively, in 2022.
At $80.36 on April 6, NYMEX May crude oil futures were 6.20% higher in early Q2. At $84.76 per barrel on April 6, ICE June Brent futures moved 6.10% higher since the end of Q1.
OPEC+ cut production, and the U.S. is out of SPR bullets, with the administration missing an opportunity to replace the sold barrels when the price fell below $70.
The reasons to be bullish for commodity prices
Markets reflect the economic and geopolitical landscapes. The following factors support higher commodity prices over the coming weeks and months:
- The war in Ukraine continues to rage, distorting food and energy prices and impacting all commodities.
- Energy is moving from the seasonally weak to the seasonally strong period, supporting prices.
- The bifurcation of the world's nuclear powers impacts the U.S. dollar's role as the global reserve currency. The U.S. dollar is the benchmark pricing mechanism for most commodities. The recent events and agreements between commodity-producing countries and China and other countries could exclude the U.S. currency from transactions, weakening the dollar and its relationship with global raw material prices.
- Supply-side inflation caused by food and energy prices exceeds the Fed and other central banks' monetary policy reach.
- The long-term trend in the commodity asset class remains mostly higher since the 2020 pandemic-inspired lows. The trend in markets is always your best friend.
These factors and the unknown, including the weather conditions and any geopolitical surprises, will drive the path of least resistance of commodity prices and markets across all asset classes over the coming weeks and months.
DBC is an energy-weighted ETF product
The Invesco DB Commodity Index Tracking Fund ETF is a highly liquid ETF that tracks the price action in the commodities asset class, with a concentration on energy prices.
DBC's most recent top holdings include:
DBC ETF Top Holdings (Seeking Alpha)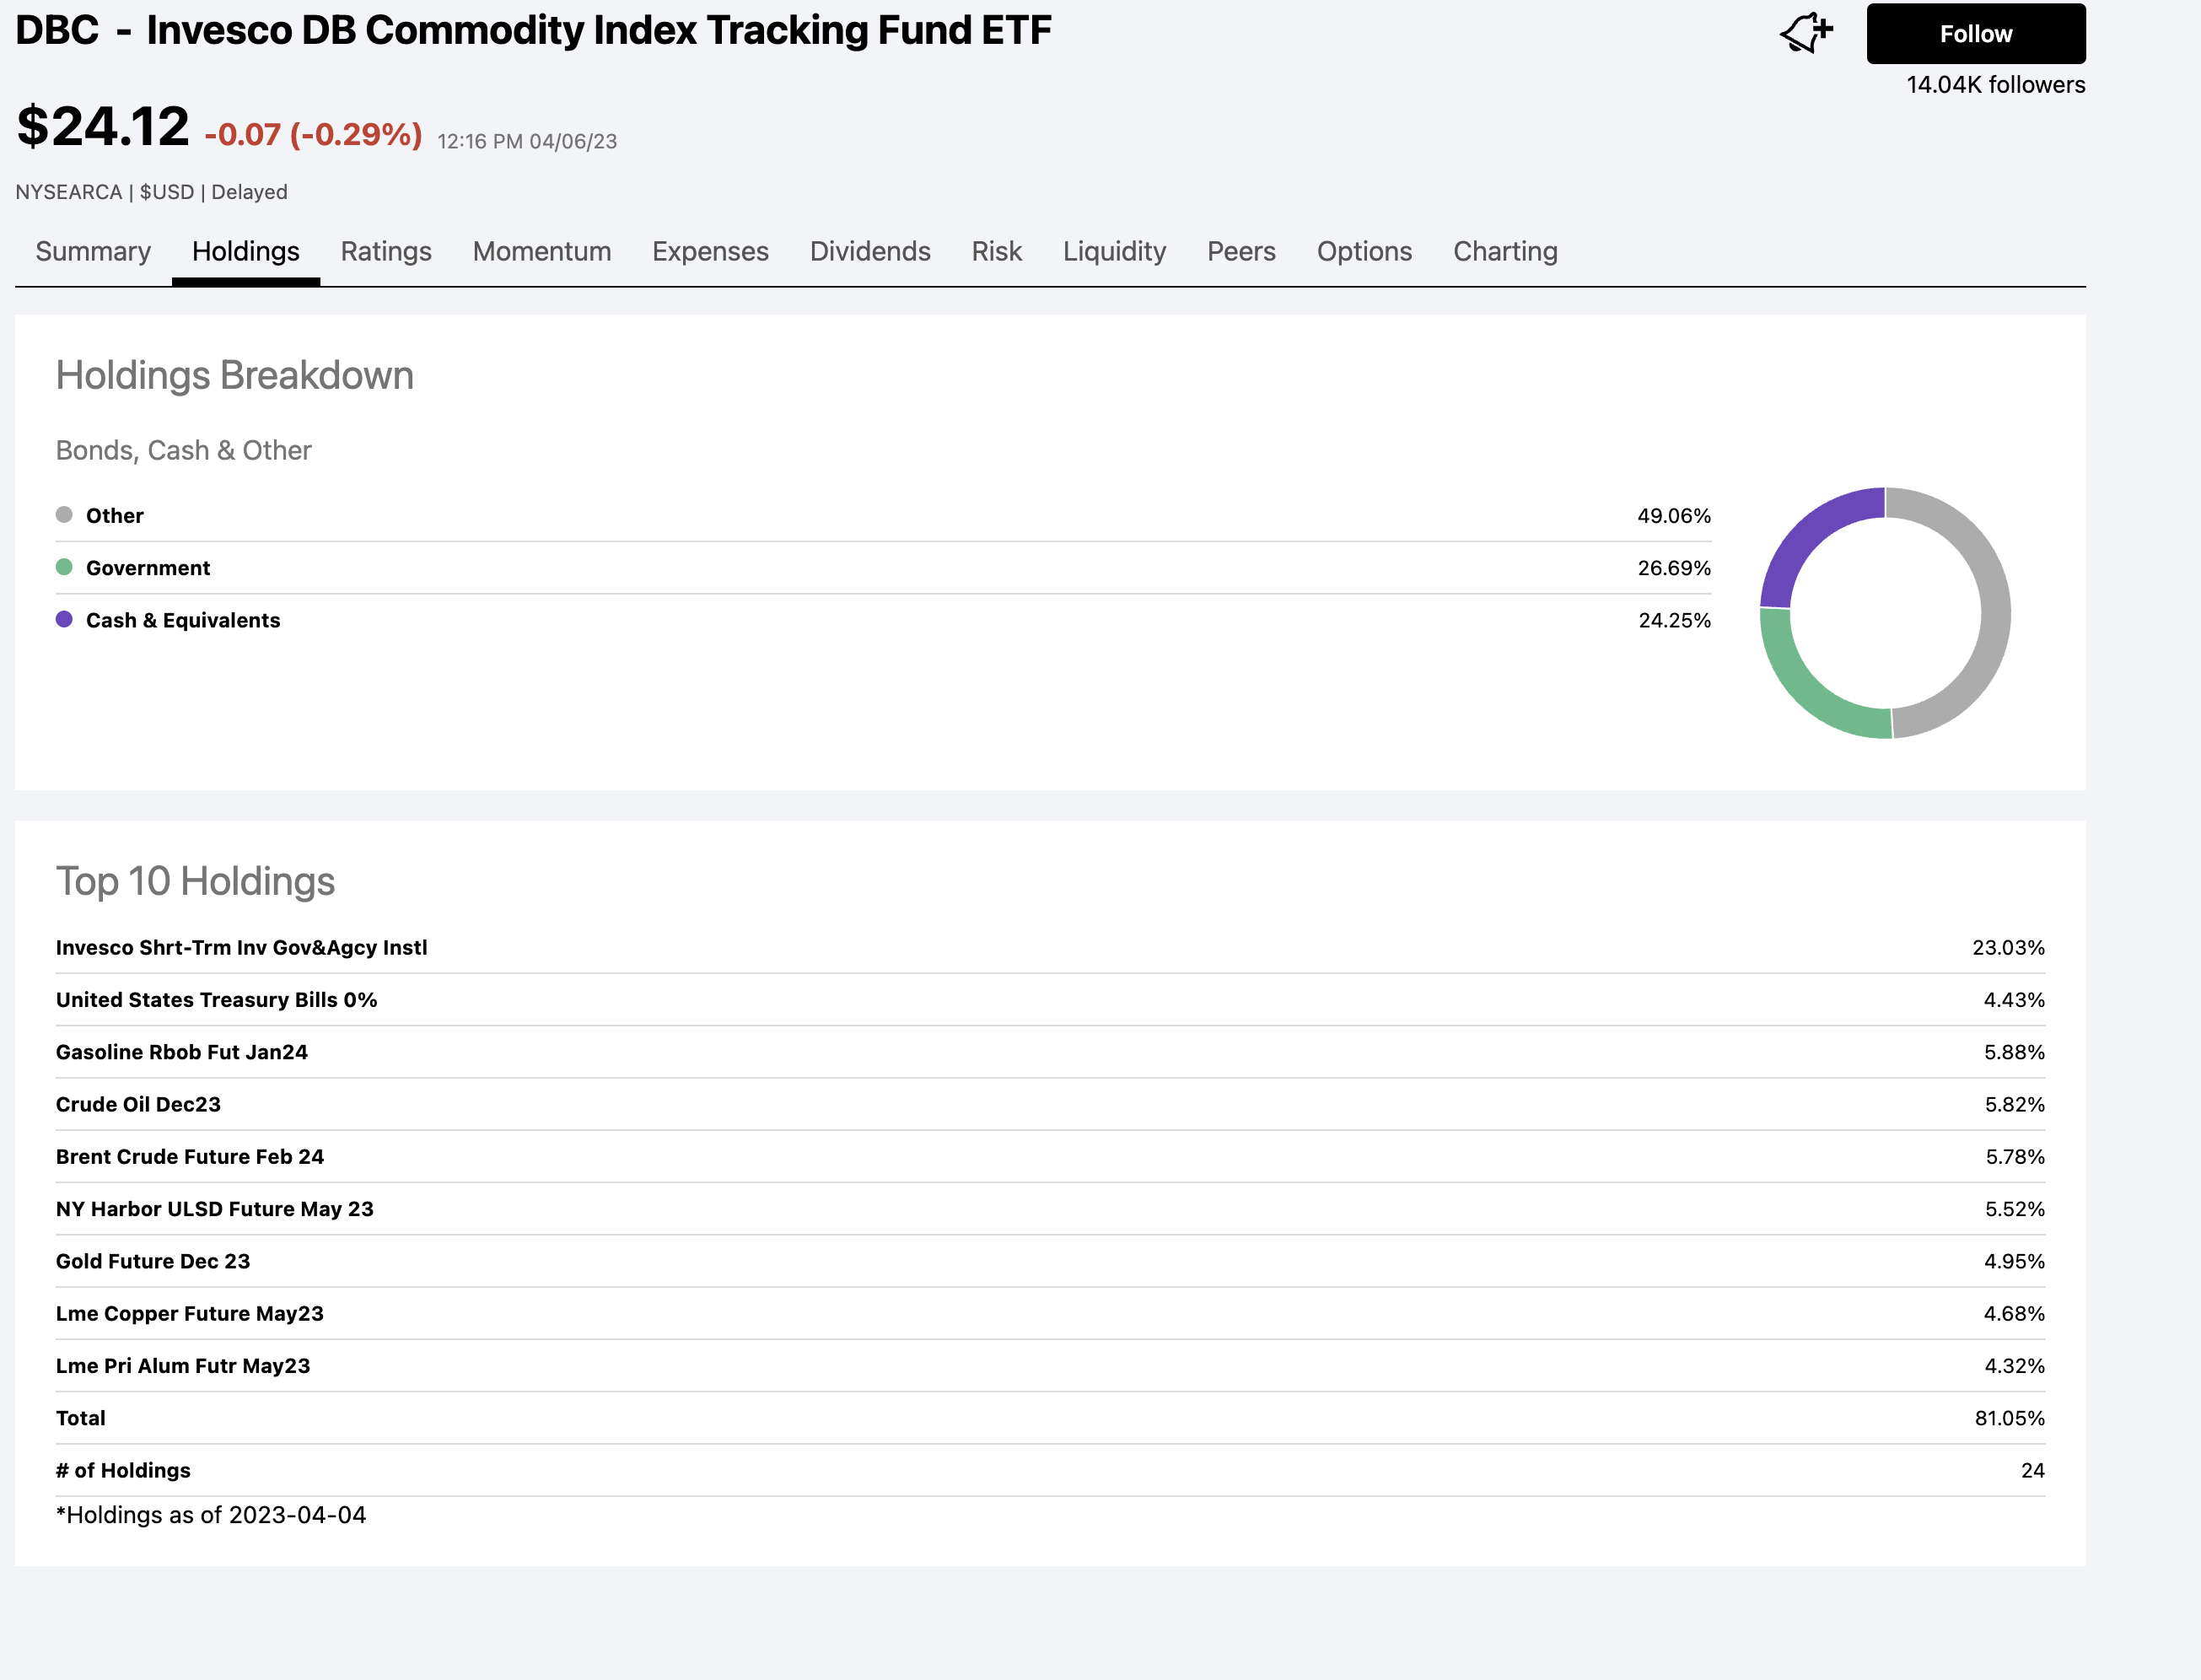
The chart shows DBC has significant energy and metals exposure.
At $24.11 per share on April 6, DBC had $2.206 billion in assets under management. DBC trades an average of over 1.525 million shares daily and charges a 0.87% management fee.
A composite of the commodities asset class declined 1.94% in Q1. Energy commodities fell 11.98%, and metals were 2.91% lower over the first three months of 2023.
Chart of the DBC ETF Product (Barchart)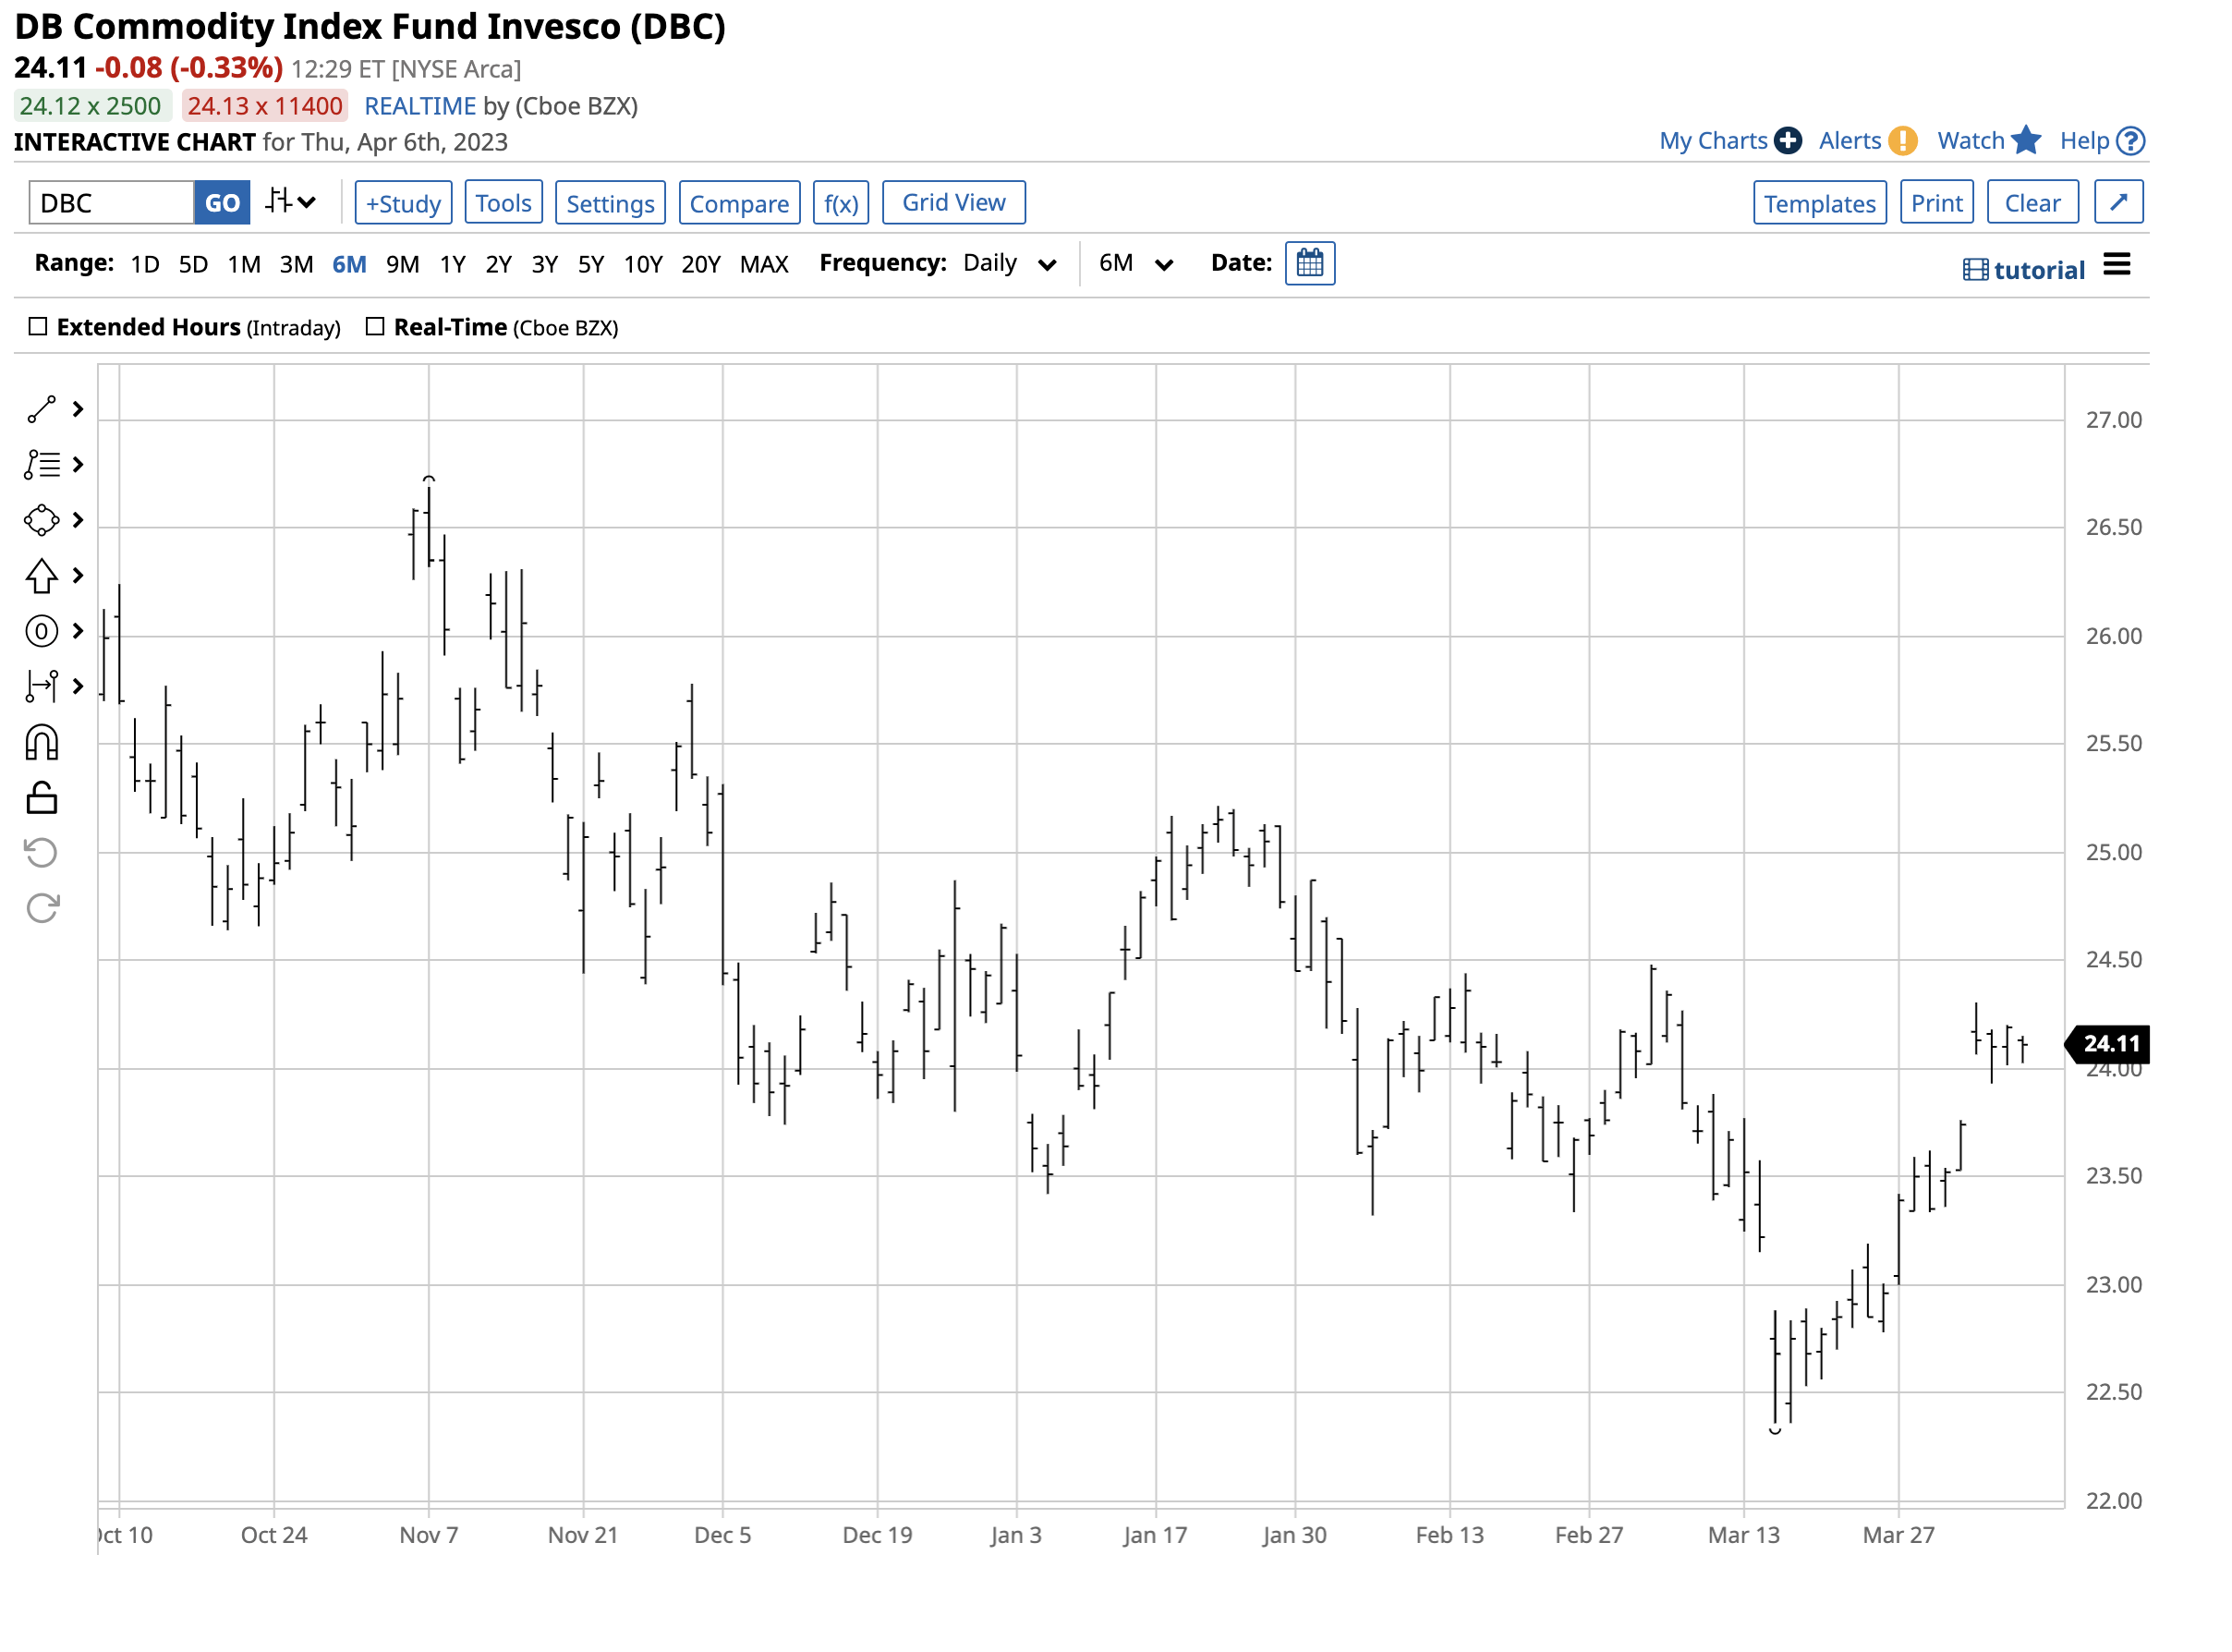
The chart shows Invesco DB Commodity Index Tracking Fund ETF closed 2022 at $24.65 and moved to $23.74 on March 31, 2023, a 3.69% decline. DBC fell more than the asset class composite in Q1 and slightly more than the base metals sector. However, DBC far outperformed the energy sector during the three months. DBC was higher in early Q2 as energy prices moved to the upside.
I remain bullish on commodity prices in April 2023, but bull markets rarely move in straight lines. Since the 2020 lows, buying raw materials on price weakness has been the optimal approach, and I expect that trend to continue in Q2 and beyond.
The Hecht Commodity Report is one of the most comprehensive commodities reports available today from a top-ranked author in commodities, forex, and precious metals. My weekly report covers the market movements of over 29 different commodities and provides bullish, bearish, and neutral calls, directional trading recommendations, and actionable ideas for traders. I am offering a free trial and discount for new subscribers for a limited time.
This article was written by

Andy spent nearly 35 years on Wall Street, including two decades on the trading desk of Phillip Brothers, which became Salomon Brothers and ultimately part of Citigroup.
Over the past two decades, he has researched, structured and executed some of the largest trades ever made, involving massive quantities of precious metals and bulk commodities.Andy understands the market in a way many traders can’t imagine. He’s booked vessels, armored cars, and trains to transport and store a broad range of commodities. And he’s worked directly with The United Nations and the legendary trading group Phibro.
Today, Andy remains in close contact with sources around the world and his network of traders.
“I have a vast Rolodex of information in my head… so many bull and bear markets. When something happens, I don’t have to think. I just react. History does tend to repeat itself over and over.”
His friends and mentors include highly regarded energy and precious metals traders, supply line specialists and international shipping companies that give him vast insight into the market.
Andy’s writing and analysis are on many market-based websites including CQG. Andy lectures at colleges and Universities. He also contributes to Traders Magazine. He consults for companies involved in producing and consuming commodities. Andy’s first book How to Make Money with Commodities, published by McGraw-Hill was released in 2013 and has received excellent reviews. Andy held a Series 3 and Series 30 license from the National Futures Association and a collaborator and strategist with hedge funds. Andy is the commodity expert for the website about.com and blogs on his own site dynamiccommodities.com. He is a frequent contributor on Stock News- https://stocknews.com/authors/?author=andrew-hecht
Analyst’s Disclosure: I/we have no stock, option or similar derivative position in any of the companies mentioned, and no plans to initiate any such positions within the next 72 hours. I wrote this article myself, and it expresses my own opinions. I am not receiving compensation for it (other than from Seeking Alpha). I have no business relationship with any company whose stock is mentioned in this article.
The author always has positions in commodities markets in futures, options, ETF/ETN products, and commodity equities. These long and short positions tend to change on an intraday basis.
Seeking Alpha's Disclosure: Past performance is no guarantee of future results. No recommendation or advice is being given as to whether any investment is suitable for a particular investor. Any views or opinions expressed above may not reflect those of Seeking Alpha as a whole. Seeking Alpha is not a licensed securities dealer, broker or US investment adviser or investment bank. Our analysts are third party authors that include both professional investors and individual investors who may not be licensed or certified by any institute or regulatory body.