TimkenSteel Has A New Cost Structure To Be Profitable

Summary
- TimkenSteel's pre-2021 losses were due to it operating below its breakeven level. It has changed its cost structure to bring down the breakeven level to below its shipment tonnage.
- But its past 2 years' results were skewed by high steel prices. To wash out this, I developed a financial model pegging earnings to steel prices and shipment tonnage.
- Based on my model, I found that TMST is now able to be profitable even if Hot Roll steel prices fall to USD 400 per ton.

Monty Rakusen
Investment thesis
Over the past 2 years, TimkenSteel (NYSE:TMST) had taken steps to change its cost structure. The company recognized that its losses from 2015 to 2020 were due to it operating below its breakeven level.
I developed a financial model to understand the impact on earnings given different combinations of steel prices and shipment tonnage. Using the model, I found that the new cost structure would enable TMST to be profitable at its post-IPO shipment tonnage. It would even be profitable if Hot Roll steel prices were at USD 400 per ton and the shipment tonnage was low.
I concluded that there is a margin of safety based on the current market price. This was based on looking at its performance over the cycle.
Thrust of my analysis
In my previous 2 articles on TMST, I opined the following:
- Its annual losses from 2015 to 2020 were due to it operating below its breakeven levels. Refer to “TimkenSteel - Time To Go In As The Worst Is Behind It.”
- TMST is a cyclical company and its long-term performance and valuation should be based on a cyclical lens. Refer to “TimkenSteel: Under-Priced Even Through A Cyclical Lens”
There are several ways to go beyond the break-even levels – reduce costs, increase sale volume, or increase selling prices.
Over the past 2 years, the company had taken steps to reduce its costs. In 2021 and 2022, it was also fortunate to experience extraordinary high steel prices. These were profitable years with an EPS of USD 3.73 in 2021.
Unfortunately, in the second half of 2022, TMST experienced a melt shop operational incident. This resulted in unplanned downtime and significantly impacted the company’s financial results. Its 2022 EPS was reduced to USD 1.42 per share.
I am a long-term value investor holding stocks for 5 to 8 years. I wanted to know whether the cost reduction efforts enabled it to operate beyond the breakeven level without high steel prices.
Specifically, is there a margin of safety based on a cyclical lens and a market price of USD 18.09 per share (as of 30 March 2023)?
To answer this, I developed a financial model where I tied revenue and production costs to the Hot Roll steel prices as well as shipment tonnage.
Company performance
TMST is a steel company. Steel is a commodity and its prices are cyclical. This makes TMST a cyclical company.
There are two critical issues for a cyclical company:
- Would it be profitable over the cycle?
- Does it have the financial strength to withstand a prolonged downtrend?
TMST IPO in 2014 with USD 1.01 EPS. But from 2015 to 2022, it incurred losses every year because it was operating below its breakeven level. It was profitable in 2021 and 2022 because the high steel prices enabled it to operate above its breakeven levels.
For it to be profitable over the steel price cycle, TMST must be able to operate beyond its breakeven level. There are 3 general ways to do this – increase its selling prices, increase its shipment tonnage, or reduce its costs.
While TMST differentiates itself by focusing on specialty steel, its product prices are still influenced by general steel prices. At this same time, TMST seemed to have difficulty in increasing its shipment tonnage. From 2014 to 2022, its average annual shipment was 900,000 tons.
The company has focused on cost reduction as the way to operate beyond the breakeven level. In the first quarter of 2021, it permanently idled its Harrison melt and cast plant. This reduced its melt capacity from 2 million tons per year to 1.2 million tons per year.
To see whether it can be profitable over the steel price cycle, I developed a financial model with steel prices and shipment tonnage as key inputs. Based on this I concluded that TMST’s operating model now enables it to be profitable over the cycle.
I would also rate TMST as financially sound for the following reasons:
- It currently has USD 257 million cash. This is about 24 % of its total assets.
- It had been able to generate positive cash flow from operations every year since its 2014 IPO.
- Its Debt Equity ratio has reduced significantly since its IPO as can be seen in Chart 1.
If you look at Chart 2, you can see that the downtrend leg of the past cycle could be as long as 5 years. TMST financial strengths ensures that it is able to withstand the negative impact of any prolonged downtrend.

Chart 1: DE Ratio (Author)
Cyclical Sector
Steel prices are cyclical as illustrated in Chart 2. But prices over the past 2 years were exceptionally higher than those between 2010 to 2020.
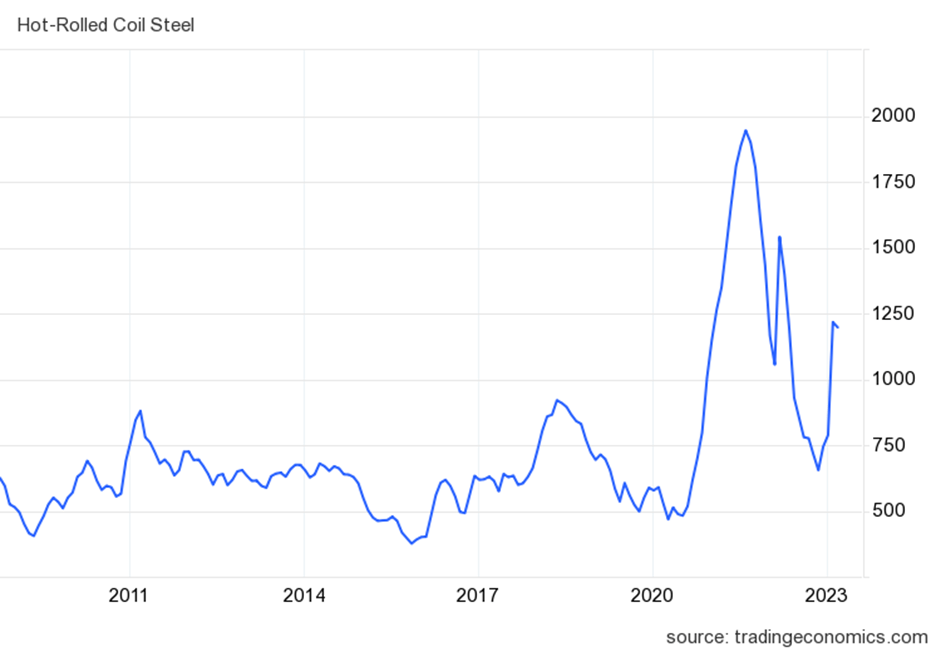
Chart 2: Hot Roll steel prices (Trading Economics.com)
As a cyclical company, TMST should be analyzed and valued as such. Damodaran has this to say about valuing cyclical companies:
Cyclical and commodity companies share a common feature, insofar as their value is often more dependent on the movement of a macro variable (the commodity price or the growth in the underlying economy) then it is on firm specific characteristics…the biggest problem we face in valuing companies tied to either is that the earnings and cash flows reported in the most recent year are a function of where we are in the cycle, and extrapolating those numbers into the future can result in serious misvaluation.
To overcome the cyclical issue, we have to normalize the performance over the cycle. Damodaran suggested 2 ways to do this:
- Take the average values over the cycle.
- Take the current revenue and determine the earnings by multiplying it with the normalized margins
The challenge with the first approach is that the size of the company in 2022 is different from that of pre-2021. This was due to the shutdown of the Harrison melt and casting plant.
There is also problem with the second approach. The current revenues (2021 and 2022) were skewed by the exceptionally high steel prices.
To derive the normalized earnings, I have to consider the normalized steel prices and expected shipment tonnage. At the same time, to be profitable the revenue has to be beyond the breakeven level.
This requires me to first develop a financial model that enables this breakeven analysis.
Financial model
There are generally 3 key components in a breakeven analysis.
- Fixed costs. For TMST, I assumed that this comprises the Selling, General, and Admin (SG&A) expenses, interest charges, and Depreciation & Amortization (D&A).
- Production costs. I assumed that these comprise steel scrap costs and other non-raw material costs.
- Selling prices. In the case of TMST, the company has broken this down into a base price and a surcharge.
Fixed costs
In the first quarter of 2021, TMST completed the shutdown of its Harrison melt and casting assets. This reduced its melt capacity to 1.2 million tons of steel with a shipment capacity of approximately 0.9 million tons.
More importantly, it reduced its fixed costs by almost half as illustrated in Table 1. The impact is to reduce the breakeven volume (quantity shipped) assuming that there is no change in the selling prices or variable costs.
I took the average 2021 and 2022 values to represent the current fixed-cost situation.
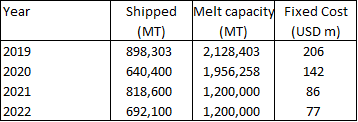
Table 1: Fixed Costs (Author)
Production Costs
I broke down the production costs into 2 components:
- Raw materials and other non-raw material costs.
- Depreciation & Amortization (D&A).
TMST did not provide details of its raw materials and non-raw material costs. In my financial model, I assumed that the raw material costs = steel scrap costs. The steel scrap costs were based on the US Geological Survey iron and steel scrap statistics.
Chart 3 illustrates the relationship between the raw material and non-raw material components and the Hot Roll steel prices
- There was a 0.85 correlation between the scrap costs and the Hot Roll steel prices between 2014 and 2022.
- The correlation between the non-raw material costs and Hot Roll steel prices was (0.52) during the same period. I do not consider this significant.
Given the above, I modeled the production cost as = variable component + fixed component.
- The variable component was based on the best-fit line between the scrap price per ton and the Hot Roll steel price per ton.
- The fixed component was the average cost per ton of 2014 to 2022 non-raw material costs.
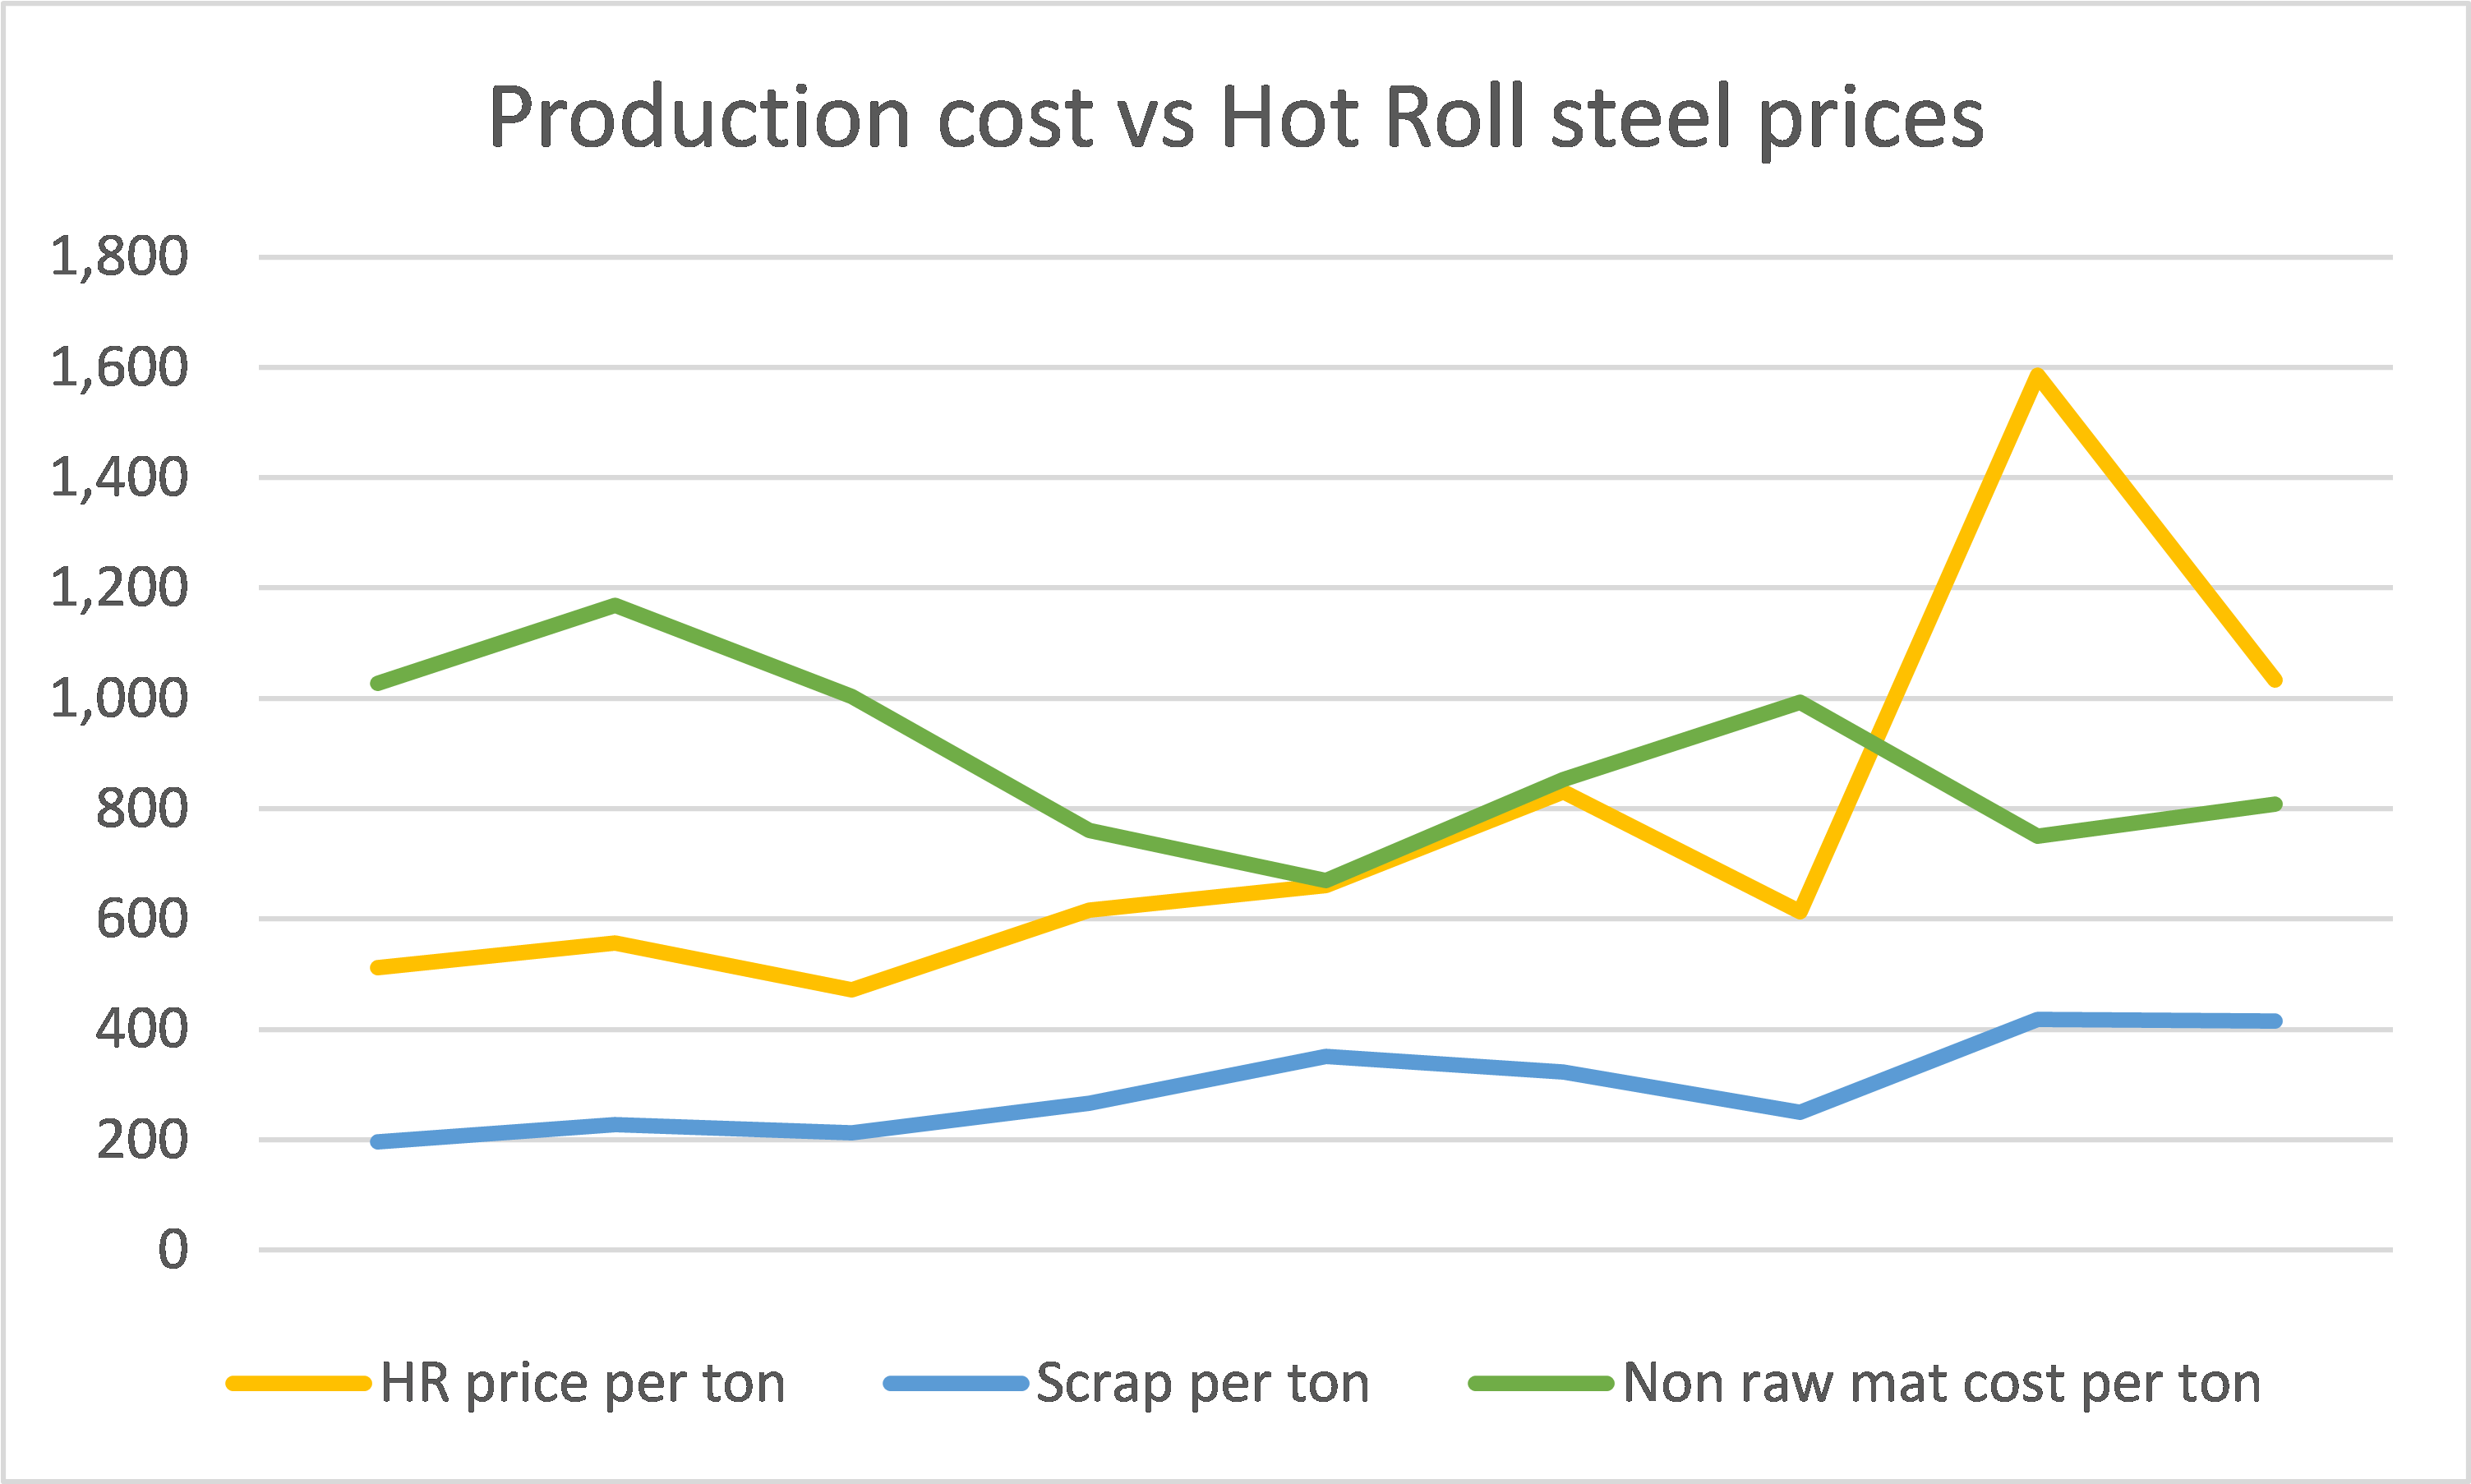
Chart 3: Production costs vs Hot Roll steel prices (Author)
Notes to Chart 3:
a) TMST did not provide details of the raw material costs and non-raw material costs. I assumed the raw material to be the steel scrap costs.
b) I derived the non-material costs from the Form 10k data using the following equation:
- Revenue – cost of sales = gross profit.
- Revenue – raw materials costs – non-raw material costs – D&A = gross profit.
- Non-raw material costs = Revenue – scrap costs – D&A – gross profit.
Selling price
TMST has broken down its selling price into a base price and a surcharge.
According to TMST, the surcharge pricing provisions were designed to enable the company to recover raw material cost increases. They have a raw material and natural gas surcharge mechanism when pricing products to customers.
There are two components of our raw material surcharge. One component is related to the scrap metal content…The other component is related to the alloy material content in our finished product… The natural gas surcharge is only applicable when the price of natural gas exceeds a certain dollar amount per MMBtu. TMST Form 10k 2022.
There is a 0.80 correlation between TMST surcharge per ton and the Hot Roll steel price per ton. Refer to Chart 4. However, for the base sales, the correlation at 0.20 was not significant.
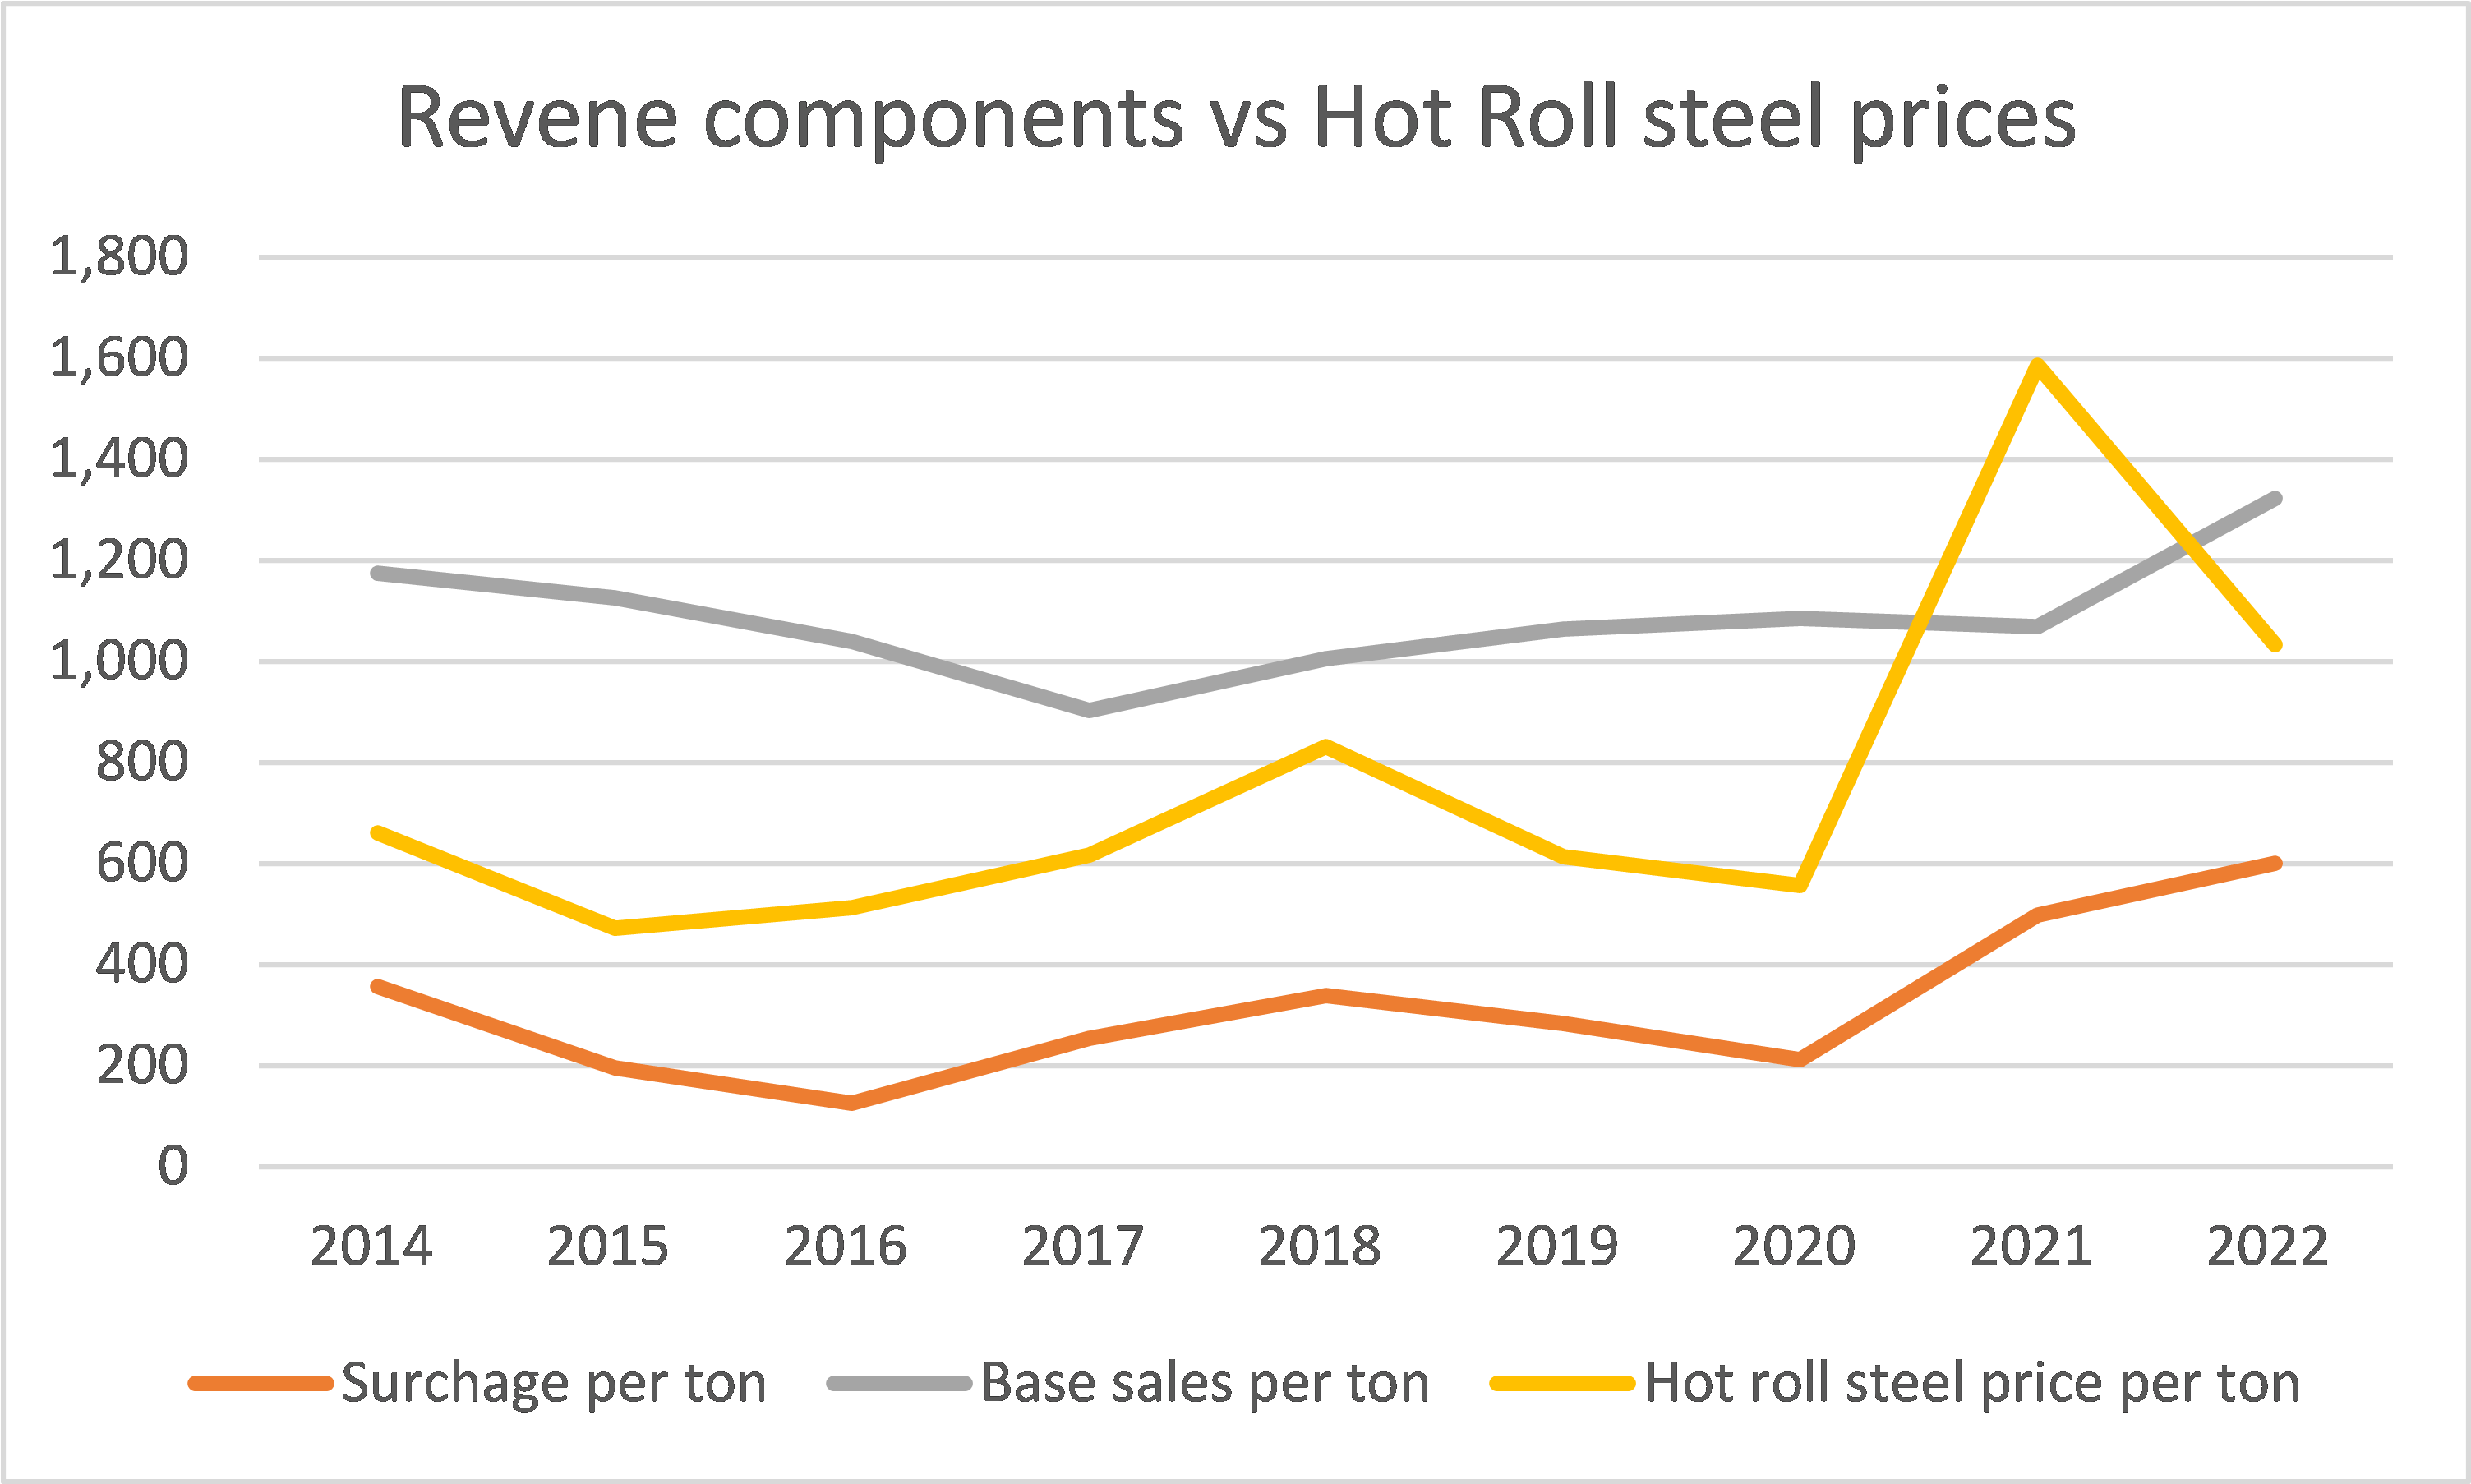
Chart 4: Revenue vs Hot Roll steel prices (Author)
Notes to Chart 4:
a) The base sales and surcharge data for each year was extracted from the corresponding TMST Form 10k
b) The Hot Roll steel prices for each year were extracted from Trading Economics.com
Given the above, in my financial model of TMST, I have pegged the revenue per ton to the Hot Roll steel price per ton based on 2 components.
- Base component that is independent of the Hot Roll steel price. I assumed that it was based on the average 2014 to 2022 base sale per ton.
- Surcharge component that is pegged to the Hot Roll steel price. I assumed a linear relationship based on the best-fit line using the 2014 to 2022 data.
Financial model
The financial model for TMST based on the above-mentioned relationships is summarized in Table 2.
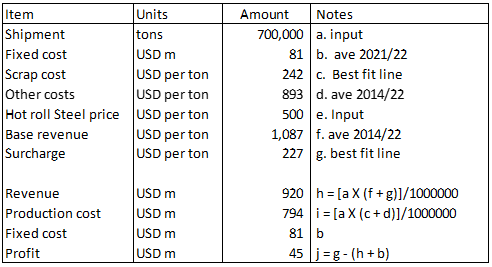
Table 2: Financial Model (Author)
Notes to Table 2:
h) Revenue = base revenue + surcharge.
i) Production cost = scrap cost + Other costs
To check the validity of the model, I compared the results of the model with the actual operating profits for 2021 and 2022. As can be seen from Table 3, the difference between the model and the actual operating profits was 5 % for 2021 and 13 % for 2022.
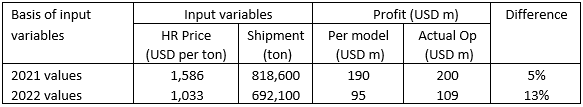
Table 3: Validating the financial model (Author)
Note to Table 3: % Difference = [Square root (model – actual) ^ 2] / actual
Projected cyclical performance
Using the financial model, I estimated the earnings for different combinations of Hot Rolled steel prices and shipment tonnage. The results are summarized in Table 4. You can see that TMST can be profitable for all combinations.
In other words, with shipment greater than 700,000 tons per year and at Hot Roll steel prices greater than USD 400 per ton, TMST now operates above the breakeven level.
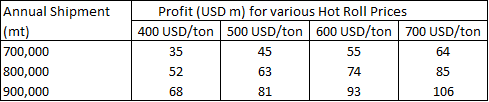
Table 4: Profits under various combinations (Author)
Note the following:
- Based on Trading Economics.com data, over the past 14 years, there was only one quarter (Oct 2015) when the Hot Roll steel price was below USD 400 per ton. Even then the reported price was USD 397 per ton.
- The lowest shipment tonnage since its IPO was 692,100 tons. This was in 2022 when TMST had its melt shop incident.
- The average Hot Roll steel price from 2014 to 2020 was USD 609 per ton. This period covered at least one steel price cycle without the extraordinarily high steel prices. Refer to Chart 2.
- The average shipment tonnage from 2014 to 2020 was 940,000 tons. TMST stated that its current shipment capacity is 900,000 tons.
Given the above, I would peg the cyclical earnings to USD 83.5 million per year, reading off Table 4. This is a combination of USD 600 per ton Hot Roll steel price and 850,000 tons (average of 800,000 and 900,000 tons) shipment.
Valuation
Given the cyclical nature of the steel price and the “relatively stable” shipment tonnage, I would value TMST based on the Earnings Power Value (EPV).
I estimated the EPV = USD 25.23 per share. Based on the market price of USD 18.09 per share, I would have a margin of safety of 39 %.
I had earlier shown that my financial model would have a difference (or error) of 5 % to 13 %. Even if I accounted for this, the EPV would still provide more than 26 % market of safety.
My valuation model is based on the Free Cash Flow to the Firm (FCFF) model of EPV = FCFF/WACC
Value of Equity = EPV – Minority Interests – Debt + Cash
FCFF = Earnings X (1-t)
Where:
Earnings = USD 83.5 million
t = tax rate = 21 %
WACC = 0.071. This was derived based on the Damodaran synthetic rating method. I used a risk-free rate of 2.5 %, cash unlevered Beta of 0.98, and weighted equity risk premium of 4.3 %.
The Minority Interests, Debt, and Cash were based on the Dec 2022 Book values.
Risks and limitations
I spent considerable time describing my financial model as is the heart of my analysis. I have used the 2021 and 2022 actual results to check its validity.
While the differences (errors) for 2021 and 2022 were small, they were very large when I tested the model with the average 2014 to 2022 values. There are 2 possible reasons for this:
- The pre-2021 fixed costs were more than double what I had assumed in my model.
- The surcharge component in the model were based on the best-fit line with the Hot Roll steel prices. This equation over-estimated the revenue at the lower pre-2020 Hot Roll steel prices.
As such I have ignored the 2014 to 2022 results when validating my model. But because of this, I would look for a higher margin of safety.
In this context, my margin of safety has not factored in the USD 80 million profitability improvements. In its March 2023 letter to the shareholders, TMST stated that this improvement is expected between 2022 to 2026. Compared to my assumed normalized earnings of USD 83.5 million, this USD 80 million is significant. I would treat this as an additional margin of safety.
Conclusion
TMST is a cyclical company. Its performance and valuation should be based on its performance over the cycle.
Before 2021, TMST had a poor track record. Except for its IPO year of 2014, it incurred losses from 2015 to 2020. This was due to it operating below its breakeven levels.
In 2021, the company took steps to change its cost structure by matching its melt and casting capacity to its shipment. This reduced its breakeven level.
While 2021 and 2022 were profitable, this was due to a combination of high steel prices and changing cost structure. But the 2021 and 2022 steel prices were exceptional.
To see the impact of the new cost structure without extraordinarily high steel prices, I developed a financial model pegging earnings to steel prices shipment volume.
Based on my financial model and the “normal” steel prices, I concluded that
- TMST can be profitable over the steel price cycle.
- There is a margin of safety at the current market price.
On top of being profitable over the cycle, TMST is also financially sound. This would enable it to withstand any prolonged downtrend of the price cycle.
This article was written by

Analyst’s Disclosure: I/we have no stock, option or similar derivative position in any of the companies mentioned, and no plans to initiate any such positions within the next 72 hours. I wrote this article myself, and it expresses my own opinions. I am not receiving compensation for it (other than from Seeking Alpha). I have no business relationship with any company whose stock is mentioned in this article.
Seeking Alpha's Disclosure: Past performance is no guarantee of future results. No recommendation or advice is being given as to whether any investment is suitable for a particular investor. Any views or opinions expressed above may not reflect those of Seeking Alpha as a whole. Seeking Alpha is not a licensed securities dealer, broker or US investment adviser or investment bank. Our analysts are third party authors that include both professional investors and individual investors who may not be licensed or certified by any institute or regulatory body.