KNG: Boosting Dividends At The Expense Of Return

Summary
- KNG invests in dividend aristocrats and sells covered calls on them.
- About 47% of asset value is in two sectors: consumer staples and industrials.
- Valuation and quality metrics are similar to those of the S&P 500 index.
- The covered call strategy boosts the yield, cuts the total return, and lets volatility unchanged.
- The fund has lagged major dividend growth ETFs.
- Quantitative Risk & Value members get exclusive access to our real-world portfolio. See all our investments here »
Nikolay Chekalin/iStock via Getty Images
This article series aims at evaluating ETFs regarding the relative past performance of their strategies and quality metrics of their current portfolios. As holdings and their weights change over time, updated reviews are posted when necessary.
KNG strategy and portfolio
First Trust Cboe Vest S&P 500 Dividend Aristocrats Target Income ETF (BATS:KNG) has been tracking the Cboe S&P 500 Dividend Aristocrats Target Income Index since 3/26/2018. It has 66 stock holdings, 65 positions in options, a distribution yield of 3.97%, and a total expense ratio of 0.75%. KNG seeks income from holding dividend stocks and selling covered call options on these stocks.
As described by First Trust:
The Index is composed of two parts: (1) an equal-weighted portfolio of the stocks contained in the S&P 500 Dividend Aristocrats Index (the "Aristocrat Stocks") that have options that trade on a national securities exchange and (2) a rolling series of short (written) call options on each of the Aristocrat Stocks (the "Covered Calls"). The S&P 500 Dividend Aristocrats Index generally includes companies in the S&P 500 Index that have increased dividend payments each year for at least 25 consecutive years and meet certain market capitalization and liquidity requirements.
The fund invests exclusively in a subset of the S&P 500 index. The stock portfolio is reconstituted annually and rebalanced quarterly. Covered calls are written each month to expire the following month at a strike price close to the last daily closing price, on no more than 20% of the position in each stock.
The top 2 sectors are consumer staples (25% of asset value) and industrials (22.6%). Other sectors are below 12%. Compared to the S&P 500 (SPY), the fund massively overweights these two sectors, along with materials, and to a lesser extent utilities and real estate. It massively underweights technology, consumer discretionary, and ignores communication services.
Sector breakdown (Chart: author; data: First Trust, SSGA)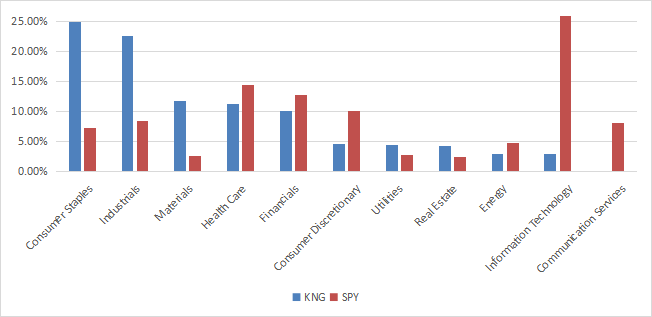
The top 10 holdings, listed in the next table with fundamental ratios, represent 17% of asset value. Positions are in equal weight on rebalancing dates, but they may drift with price action. As of writing, the largest one weighs about 2.07%, so risks related to individual companies are low.
Ticker | Name | Weight% | EPS growth %TTM | P/E TTM | P/E fwd | Yield% |
West Pharmaceutical Services, Inc. | 2.07% | -11.29 | 44.86 | 47.01 | 0.22 | |
W.W. Grainger, Inc. | 1.77% | 51.53 | 21.38 | 19.41 | 1.06 | |
The Clorox Co. | 1.70% | 76.47 | 44.83 | 37.26 | 3.00 | |
A. O. Smith Corp. | 1.67% | -51.16 | 43.77 | 19.44 | 1.86 | |
Linde Plc | 1.67% | 12.32 | 43.16 | 26.64 | 1.43 | |
AbbVie, Inc. | 1.66% | 2.82 | 24.25 | 14.52 | 3.68 | |
McCormick & Co., Inc. | 1.66% | -10.99 | 34.59 | 32.47 | 1.83 | |
Church & Dwight Co., Inc. | 1.65% | -49.55 | 53.64 | 29.21 | 1.22 | |
Ecolab, Inc. | 1.65% | -2.52 | 43.60 | 33.42 | 1.28 | |
Pentair plc | 1.64% | -12.04 | 18.02 | 14.65 | 1.68 |
Historical performance
For performance, I will use as the benchmark the S&P 500 Dividend Aristocrats Index, represented hereafter by ProShares S&P 500 Dividend Aristocrats ETF (NOBL). The next table also includes popular dividend-growth ETFs: iShares Core Dividend Growth ETF (DGRO), Vanguard Dividend Appreciation Fund (VIG) and Schwab U.S. Dividend Equity ETF (SCHD).
since inception | Total Return | Annual Return | Drawdown | Sharpe ratio | Volatility |
KNG | 56.49% | 9.36% | -35.12% | 0.53 | 17.58% |
NOBL | 63.41% | 10.30% | -35.43% | 0.58 | 17.63% |
DGRO | 68.13% | 10.93% | -35.10% | 0.6 | 17.44% |
VIG | 69.57% | 11.12% | -31.72% | 0.64 | 16.57% |
SCHD | 77.63% | 12.16% | -33.37% | 0.66 | 17.92% |
Data calculated with Portfolio123
KNG has underperformed these 4 ETFs since its inception. The risk measured in drawdown and volatility (standard deviation of monthly returns) is similar to the Dividend Aristocrats Index without covered calls. It appears that boosting the dividend with covered calls had a cost in capital and resulted in a lower total return. SCHD has been the best performer in this period.
However, in the last 12 months, the leader is VIG:
KNG vs. Competitors, last 12 months (Seeking Alpha)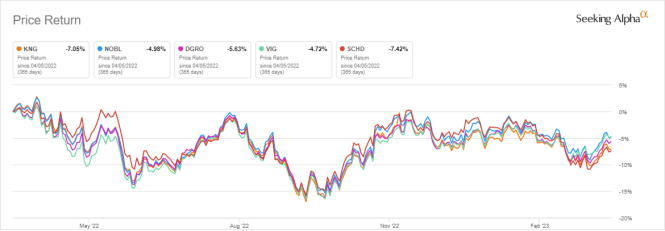
Scanning the portfolio
The price-to-book ratio is similar to S&P 500's value. KNG is cheaper in price/sales and slightly more expensive in price/earnings and price/cash flow (see next table).
KNG | SPY | |
Price / Earnings TTM | 21.24 | 19.89 |
Price / Book | 3.58 | 3.64 |
Price / Sales | 1.42 | 2.31 |
Price / Cash Flow | 15.37 | 14.62 |
In previous articles, I have shown how three factors may help cut the risk in a dividend portfolio: Return on Assets, Piotroski F-score, Altman Z-score. My core portfolio holds 14 stocks selected using these metrics (more info at the end of this post). I have scanned KNG holdings with these quality metrics. I consider that risky stocks are companies with at least 2 red flags among: bad Piotroski score, negative ROA, unsustainable payout ratio, bad or dubious Altman Z-score, excluding financials and real estate where these metrics are less relevant. With these assumptions, only 4 stocks are risky. They weigh 6% of asset value, which is a good point.
Based on my calculation, aggregate Altman Z-score and return on assets are a bit above SPY's aggregate values. The Piotroski F-score is very close to the benchmark. These metrics point to a portfolio quality similar to the S&P 500.
KNG | SPY | |
Altman Z-score | 4.21 | 3.42 |
Piotroski F-score | 5.56 | 5.57 |
ROA % TTM | 8.07 | 7.61 |
Takeaway
KNG holds stocks of all the dividend aristocrats of the S&P 500, rebalanced in equal weight on a quarterly basis. It also sells short-term covered calls on a maximum of 20% of each stock position. Compared to the S&P 500 Dividend Aristocrats Index since the fund's inception, this strategy has improved the dividend yield, but it has deteriorated the total return. Risk metrics are unchanged by the option strategy. The most popular dividend growth ETFs have outperformed KNG since 2018. Based on past data covering different market conditions, it seems KNG has some difficulty to justify its covered call strategy, and the high expense ratio coming with it. However, price history is still too short to assess long-term performance over a complete market cycle.
Quantitative Risk & Value (QRV) features data-driven strategies in stocks and closed-end funds outperforming their benchmarks since inception. Get started with a two-week free trial now.

This article was written by

Step up your investing experience: try Quantitative Risk & Value for free now (limited offer).
I am an individual investor and an IT professional, not a finance professional. My writings are data analysis and opinions, not investment advice. They may contain inaccurate information, despite all the effort I put in them. Readers are responsible for all consequences of using information included in my work, and are encouraged to do their own research from various sources.
Analyst’s Disclosure: I/we have no stock, option or similar derivative position in any of the companies mentioned, and no plans to initiate any such positions within the next 72 hours. I wrote this article myself, and it expresses my own opinions. I am not receiving compensation for it (other than from Seeking Alpha). I have no business relationship with any company whose stock is mentioned in this article.
Seeking Alpha's Disclosure: Past performance is no guarantee of future results. No recommendation or advice is being given as to whether any investment is suitable for a particular investor. Any views or opinions expressed above may not reflect those of Seeking Alpha as a whole. Seeking Alpha is not a licensed securities dealer, broker or US investment adviser or investment bank. Our analysts are third party authors that include both professional investors and individual investors who may not be licensed or certified by any institute or regulatory body.