VFMF: Exploring Why Vanguard's Multifactor Approach Hasn't Worked

Summary
- VFMF is an actively-managed multi-factor ETF emphasizing momentum, quality, and value, after applying a volatility screen to eliminate the market's most volatile stocks.
- Oddly, VFMF has underperformed three other Vanguard ETFs that emphasize these factors individually. In this case, the whole is less than the sum of the parts.
- This article takes a closer look at VFMF's strategy to explain reasons for the poor performance. The initial volatility screen is suspicious and could inadvertently exclude too many high-potential stocks.
- My fundamental analysis compares VFMF with Vanguard's three other factor ETFs: VFMO, VFQY, and VFVA. This analysis also revealed a surprising weakness for all funds: poor profitability.
- I don't recommend readers buy VFMF, but I hope this analysis provides some insight into the strengths and weaknesses of factor-based investing.
- Looking for a portfolio of ideas like this one? Members of Hoya Capital Income Builder get exclusive access to our subscriber-only portfolios. Learn More »
Nastassia Samal
Investment Thesis
The Vanguard U.S. Multifactor ETF (BATS:VFMF) has a 43% monthly win rate over its benchmark iShares Russell 3000 ETF (IWV), indicating that pressure is mounting for VFMF's active fund managers to increase the fund's $175 million in net assets before too many investors lose interest. VFMF screens large-cap stocks for momentum, quality, and valuation, after first applying a volatility screen. It's a reasonable strategy at first glance, but clearly, there's something wrong, and this article explores some of those perceived shortcomings. I look forward to explaining how the fund operates and comparing it against other, more successful, multifactor ETFs.
ETF Overview
Strategy Discussion
VFMF is an actively-managed ETF that follows a proprietary strategy. Its 0.18% expense ratio is low for such a fund but consistent with the Vanguard brand. Although proprietary, the general investment approach is described on VFMF's fund page. A summary is below.
1. A quantitative model constructs a U.S. equity portfolio that achieves exposure to multiple factors.
2. An initial screen removes the 20% most volatile names in each market cap segment (small, mid, large) and equally across all sectors.
3. Stocks are selected according to an equally-weighted ranking on momentum, quality, and value.
4. One-month, six-month, and one-year price returns influence the momentum factor.
5. The quality factor for non-financial companies is influenced by return on equity, gross profitability, change in net operating assets, and leverage. For financial companies, return on equity and share issuance are the inputs.
6. The value factor is influenced by a company's book value to price ratio, forward earnings to price ratio, and operating cash flow to price ratio (for non-financial companies only).
7. The fund is actively managed and rebalances as needed to maintain appropriate exposure to these factors.
One explanation for VFMF's underperformance might be that it tries to be too many things simultaneously. For example, the price momentum screen, reflected by the Vanguard U.S. Momentum Factor ETF (VFMO), worked relatively well over the last five years (described later), outperforming VFMF by 13%. Similarly, the Vanguard U.S. Quality Factor ETF (VFQY) outperformed VFMF by 12%, and even the Vanguard U.S. Value Factor ETF (VFVA) led by 2%. It might seem logical to combine all three factors, but it's not that straightforward. After evaluating the fundamentals of all four ETFs, VFMF looks closest to VFVA, the fund emphasizing the value factor. It shouldn't happen because all three elements are equal-weighted, but the initial volatility screen could remove too many high-potential names. That step doesn't accomplish much because it applies to a broad universe of stocks (the Russell 3000).
Sector Exposures and Top Ten Holdings
Currently, VFMF is balanced across most sectors, which is one of the objectives described on its fund page. It has 15-19% exposure to Energy, Financials, and Health Care but little exposure to Real Estate and Utilities. As shown below, that's not unusual for any Vanguard Factor ETFs.
Morningstar
VFMF has 575 constituents, so its top holdings list won't reveal much. Still, they include Energy giants Exxon Mobil (XOM) and Chevron (CVX) and three others from the sector (MPC, VLO, EOG). All these companies have market caps above $50 billion, but the rest mainly have market caps of less than $10 billion. They include 408 stocks with a combined 51% weighting, so I want to point out how important it is not to rely on these front-page stocks.
Vanguard
VFMF Analysis
Performance
Several active and passive total market ETFs use a non-market-cap-weighted selection process. The following list isn't exhaustive, but I screened for two features: ETFs with current five-year betas above 1.15 and ones with weighted-average market caps between $25 and $75 billion. VFMF, VFMO, VFQY, and VFVA are included, and I also added the Cambria Shareholder Yield ETF (SYLD), despite its lower $20 billion market cap. As shown, it's easily the top performer over the last five years.
The Sunday Investor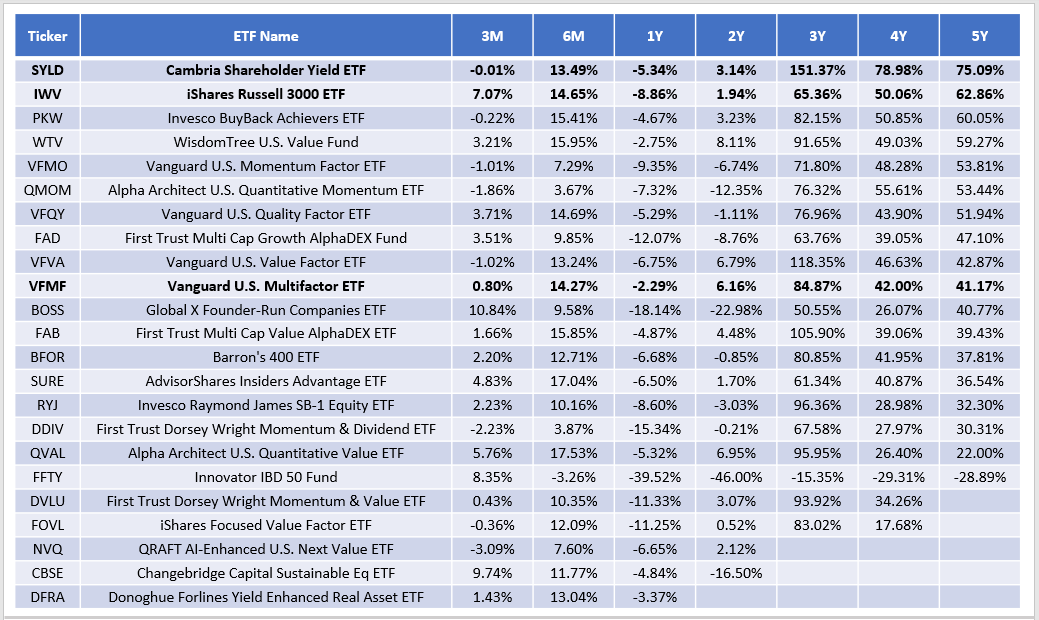
Except for SYLD, all underperformed IWV, which may say something about the multifactor approach applied to the entire U.S. stock market. Here is how VFMF ranked over each period listed:
- 3M: #14/23
- 6M: #8/23
- 1Y: #1/23
- 2Y: #4/22
- 3Y: #8/20
- 4Y: #9/20
- 5Y: #10/20
Thinking about the market over the last few years, it's telling how VFMF was the best-performing ETF in this sample over the last year when markets declined. That's good news for defensive investors and could result from the volatility screen described earlier. Still, returns were less strong over the previous three years, from April 2020 to March 2023. April 2020 marked the beginning of the pandemic recovery when riskier stocks did better, and VFMF's four- and five-year ranking was only average. In nearly all cases, VFMF lagged its stated benchmark, the Russell 3000 Index. If the idea is to outperform, it hasn't succeeded.
VFMF Fundamentals
VFMF had a rough quarter, failing to capture the gains of many riskier large-cap stocks. The current fundamentals look solid, but that's not necessarily surprising because it's a fundamentals-based ETF. Here is a summary of VFMF's top 25 industries, which total 60% of the portfolio. For perspective, I also included summary metrics for VFMO, VFQY, VFVA, and IWV.
The Sunday Investor
I want to note VFMF's 1.23 five-year beta, which is slightly lower than VFVA's 1.28, the highest of the four-factor ETFs. This metric tells me that if there were no volatility screens, the beta likely would be too high, possibly over 1.30. However, as discussed, it's also one possible reason for the fund's poor results.
The price returns in the final three columns make sense. VFMO's holdings, representing momentum stocks, gained a weighted average of 25.18% over the last year, while VFVA's value-focused holdings declined by 8.88%. VFMF's returns are roughly in between. We can make similar observations on expected sales and earnings growth and, to a lesser extent, valuation, and quality. I also want to point out how VFMO's 6.44/10 EPS Revision Score is very high compared to most U.S. equity ETFs. It supports the concept that its holdings have strong price momentum because Wall Street analysts raised consensus earnings estimates, possibly because of recent strong results. VFMF also scores high at 6.05/10, which is good news overall for VFMF shareholders.
However, quality could be better for all four ETFs, including VFQY. Profitability scores range from 7.63/10 to 8.30/10, which is poor for a large-cap ETF and significantly less than IWV's 8.94/10. The SPDR S&P 500 ETF (SPY) is consistently around 9.30/10; even most of the large-cap dividend and value ETFs I cover are 9/10 or better. It's difficult to say what's causing this, as it likely limits long-term returns. Alternatively, if VFMF managers set a more strict profitability screen, they wouldn't need the initial volatility screen. The fund's beta would also decrease because more profitable stocks are often less volatile. That's just my two cents, but as it stands, Vanguard's multi-factor approach hasn't worked.
Investment Recommendation
VFMF evaluates Russell 3000 companies based on three factors: momentum, quality, and value, tracked by VFMO, VFQY, and VFVA, respectively. You might assume VFMF's returns would fall somewhere in between, but that's not true. Over the last five years, VFMF was the worst-performing of the four, suggesting that, in this case, the whole is less than the sum of the parts. This article identified two potential reasons for this abnormality.
First, the volatility screen could inadvertently exclude too many high-potential companies. Based on the portfolio's already-high 1.23 five-year beta, managers probably felt it necessary to lessen the risk, but the effect was to limit return in upwards-trending markets. VFMF is still a deep-value fund, so I'm not sure this screen serves its intended audience well. Second, the profitability scores for all four ETFs were surprisingly weak. A more strict profitability screen would enhance quality and automatically drive down the portfolio's beta. Despite the March 2023 change in portfolio managers noted in the latest prospectus, the fund remains bound by its rules-based process, and until that's addressed, I don't recommend readers buy VFMF. Thank you for reading, and I look forward to the discussion in the comments section below.
The Sunday Investor Joins Income Builder
The Sunday Investor has teamed up with Hoya Capital to launch the premier income-focused investing service on Seeking Alpha. Members receive complete early access to our articles along with exclusive income-focused model portfolios and a comprehensive suite of tools and models to help build sustainable portfolio income targeting premium dividend yields of up to 10%.
Whether your focus is High Yield or Dividend Growth, we’ve got you covered with actionable investment research focusing on real income-producing asset classes that offer potential diversification, monthly income, capital appreciation, and inflation hedging. Start A Free 2-Week Trial Today!

This article was written by

I perform independent fundamental analysis for over 850 U.S. Equity ETFs and aim to provide you with the most comprehensive ETF coverage on Seeking Alpha. My insights into how ETFs are constructed at the industry level are unique rather than surface-level reviews that’s standard on other investment platforms. My deep-dive articles always include a set of alternative funds, and I am active in the comments section and ready to answer your questions about the ETFs you own or are considering.
My qualifications include a Certificate in Advanced Investment Advice from the Canadian Securities Institute, the completion of all educational requirements for the Chartered Investment Manager (CIM) designation, and a Bachelor of Commerce degree with a major in Accounting. In addition, I passed the CFA Level 1 Exam and am on track to become licensed to advise on options and derivatives in 2023. In November 2021, I became a contributor for the Hoya Capital Income Builder Marketplace Service and manage the "Active Equity ETF Model Portfolio", which as a total return objective. Sign up for a free trial today! Hoya Capital Income Builder.
Analyst’s Disclosure: I/we have a beneficial long position in the shares of SPY either through stock ownership, options, or other derivatives. I wrote this article myself, and it expresses my own opinions. I am not receiving compensation for it (other than from Seeking Alpha). I have no business relationship with any company whose stock is mentioned in this article.
Seeking Alpha's Disclosure: Past performance is no guarantee of future results. No recommendation or advice is being given as to whether any investment is suitable for a particular investor. Any views or opinions expressed above may not reflect those of Seeking Alpha as a whole. Seeking Alpha is not a licensed securities dealer, broker or US investment adviser or investment bank. Our analysts are third party authors that include both professional investors and individual investors who may not be licensed or certified by any institute or regulatory body.