Barrick Gold: Don't Buy The Rip

Summary
- Barrick Gold stock has outperformed the S&P 500 since its lows in September, as investors bet on a Fed pivot.
- The recent banking crisis also led to a 20% plunge, as dip buyers returned quickly to snap up GOLD again.
- As underlying gold prices move closer to their previous highs, the risk/reward in GOLD is much less compelling now.
- I do much more than just articles at Ultimate Growth Investing: Members get access to model portfolios, regular updates, a chat room, and more. Learn More »
bodnarchuk
In our previous article in December, we encouraged investors to wait for a steep pullback in Barrick Gold Corporation (NYSE:GOLD) stock before jumping back on board.
As a reminder, we upgraded GOLD to a Buy rating in September, emphasizing that it was near its "peak pessimism." Accordingly, it has outperformed the S&P 500 (SPX) (SPY) since then, notching a total return of nearly 40%, compared to the SPX's 4.2% uptick.
However, GOLD fell after notching its early February highs, declining nearly 20% toward its March lows. As such, investors were afforded the opportunity to buy the plunge in early March as the fearful investors parsed the fallout from the recent banking crisis.
The fear has proved unfounded, as the contagion risks were likely overstated. JPMorgan (JPM) CEO Jamie Dimon also stressed in his recent annual letter that "the current situation is not comparable to the 2008 financial crisis." Moreover, financial insiders in the Financial Select Sector SPDR ETF (XLF) have also put their money where their mouth is, as they scooped up their shares from investors who fled.
As such, GOLD and its gold mining peers, represented in the VanEck Gold Miners ETF (GDX) and iShares MSCI Global Gold Miners ETF (RING), saw their stock bolstered by the sharp recovery in gold prices.
GC1/DXY price chart (monthly) (TradingView)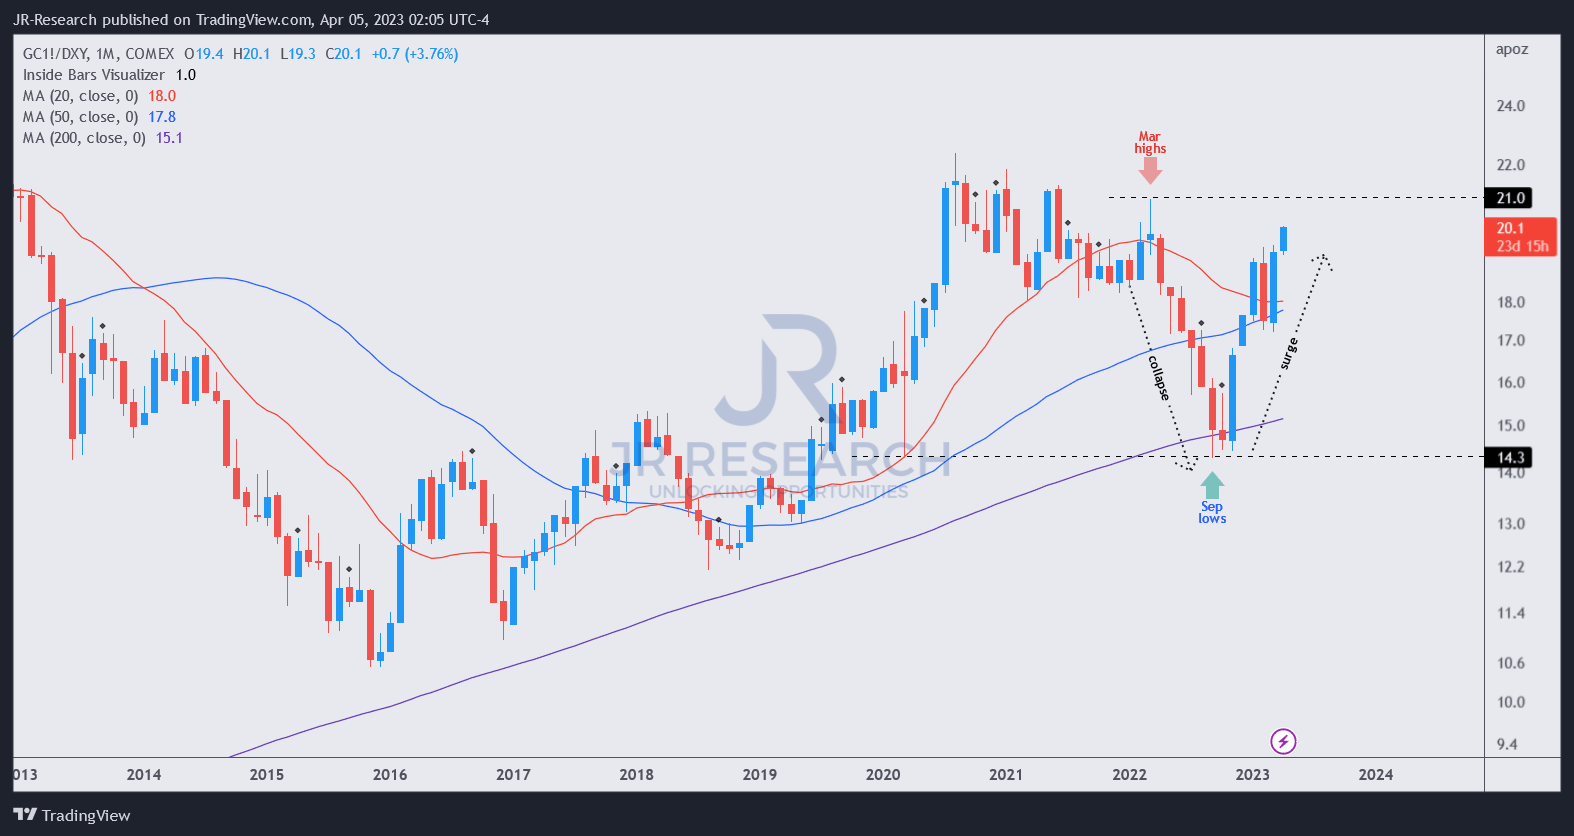
The long-term chart of GC1/DXY shows that the US Dollar Index (DXY) has underperformed against the resurgence in gold prices since September 2022. Notably, the pessimism in gold prices and outlook reached a peak in September, as it formed a bear trap or false downside breakdown as gold sellers fled in a hurry in response to the Fed's rapid rate hikes.
That bear trap has played out accordingly, as GC1/DXY mean-reverted. As such, by the time you read this (and if you didn't capitalize on GOLD's deep pullbacks in September and March), your reward-to-risk profile is much less attractive now.
Barrick Gold adjusted net margins consensus estimates % (By FY) (TIKR)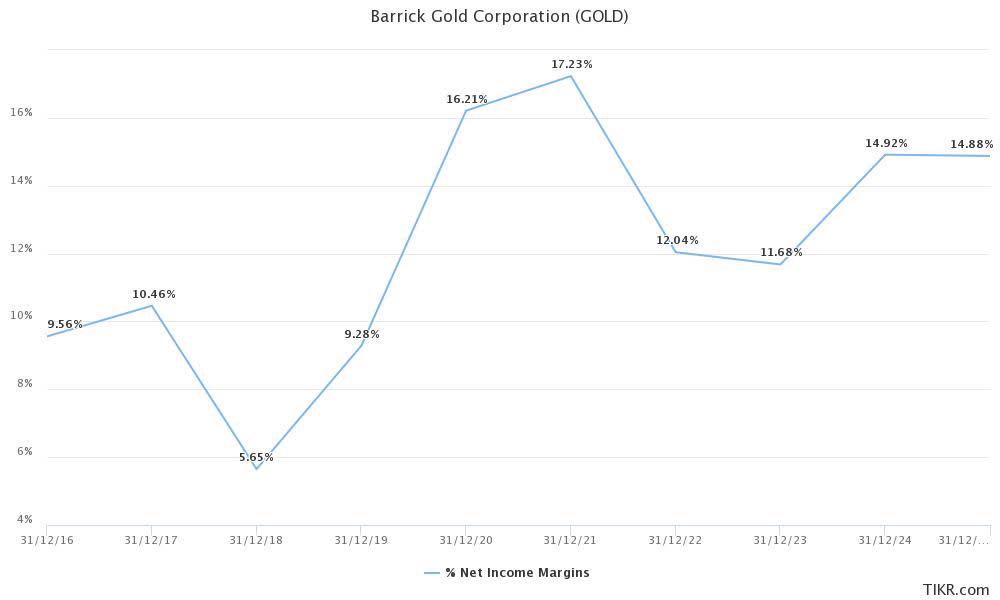
Morningstar rates gold miners as stocks with no sustainable economic moat. These companies possess highly volatile profitability margins impacted by the economic cycles.
Barrick Gold's adjusted net margins are expected to improve through FY25, suggesting Wall Street analysts are not expecting gold prices to fall below the lows last seen in 2022.
Moreover, the company is confident its costs could be mitigated by falling energy prices this year. However, the recent surge in underlying crude oil prices (CL1:COM) (USO) must be watched carefully, as they appear to be potentially resuming their secular uptrend.
Barrick Gold cash flow metrics (Morningstar)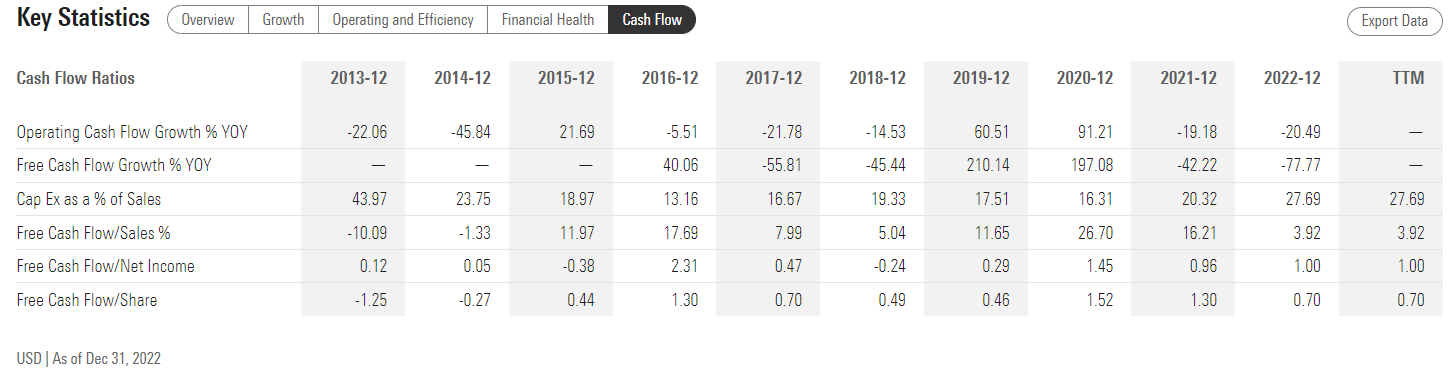
Despite that, the recent surge in gold prices could still mitigate the downside risks to its costs if it can be sustained. Moreover, as a gold miner, the company has significant operating leverage given its CapEx margins, as seen above.
It posted a TTM CapEx margin of about 27.7%. However, weak gold prices resulted in a TTM free cash flow or FCF margin of just 3.9% in FQ4'22. Barrick Gold is expected to post an FCF margin of 9.4% in FY23 before improving further to 13.8% in FY24.
Given the recent improvement in underlying prices, we believe analysts could subsequently mark up their forward estimates if they could be maintained.
However, has the market priced in the recent optimism?
GOLD blended fair value estimates (InvestingPro)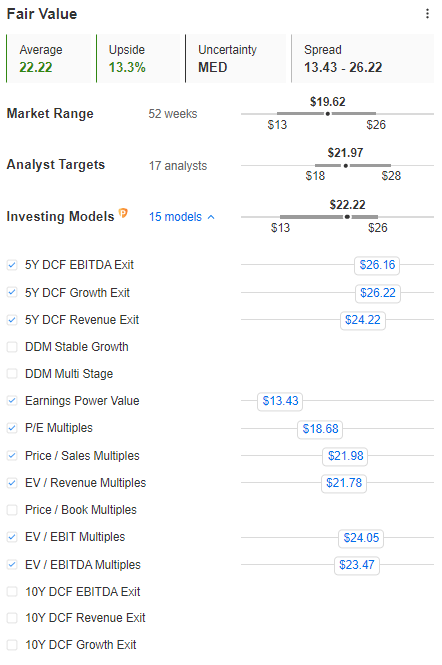
Based on GOLD's blended fair value estimate, it has a 13% upside to its implied fair value. However, a closer look at its valuation metrics suggests that the DCF models could have overstated its blended fair value estimate.
As we highlighted earlier, the DCF models consider the markedly improving FCF projections over the next few years. Therefore, investors will likely need to factor in a more considerable margin of safety to reflect these uncertainties.
Trefis' sum-of-the-part or SOTP valuation suggests that more than 75% of GOLD's valuation is predicated on the performance of its North American gold mines.
Barrick Gold announced recently that its Nevada Gold Mines "is showing significant mineral resource growth and new discoveries" as it forms "the value foundation of Barrick." Therefore, investors should continue to monitor its performance, given the outsized valuation impact the market could consider on GOLD's valuation.
GOLD price chart (weekly) (TradingView)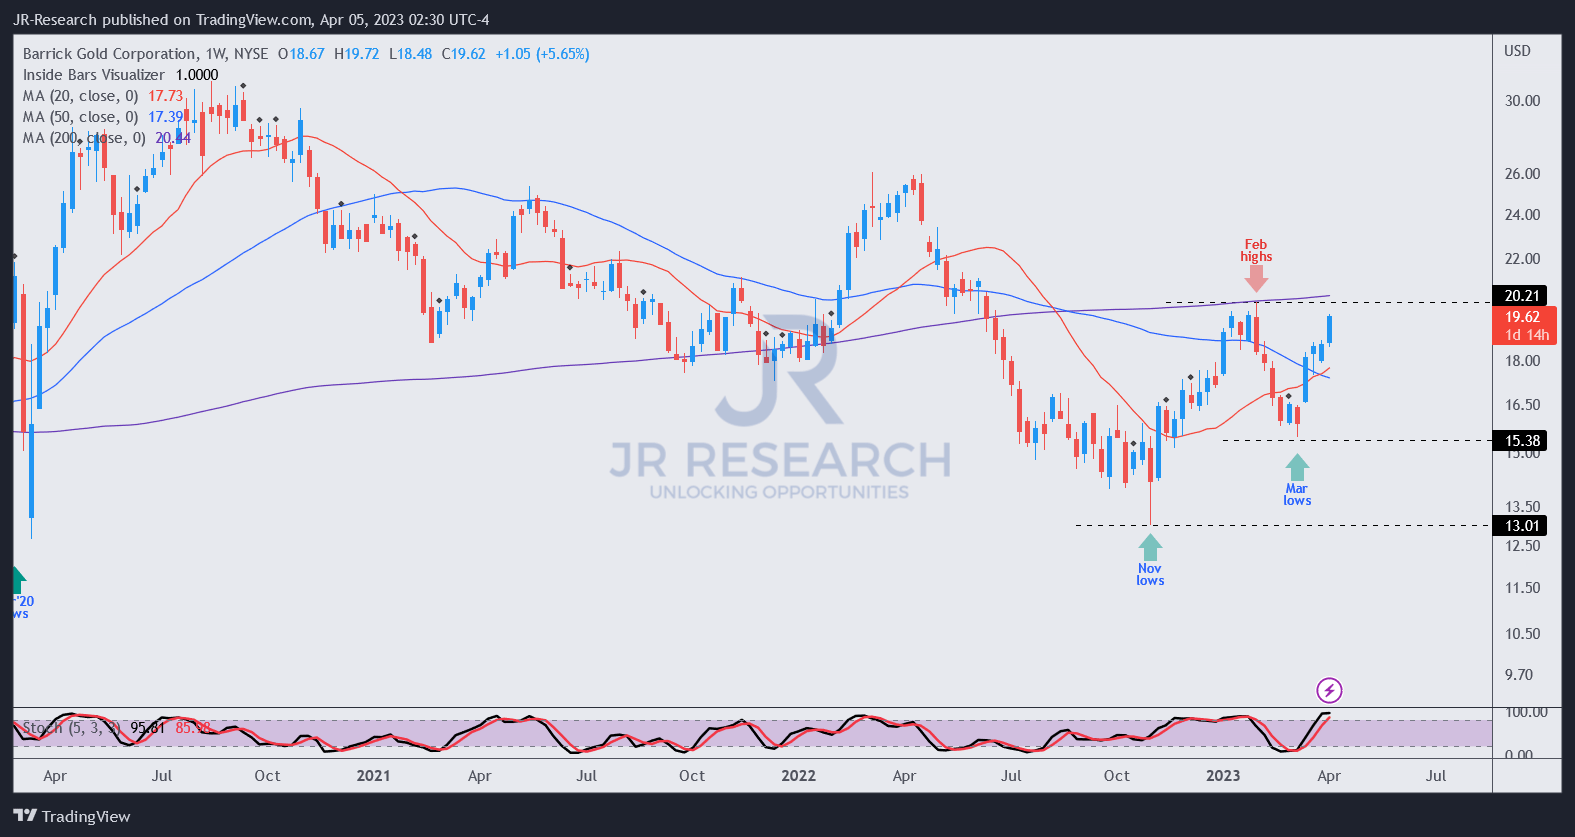
We don't observe an optimal buy point at the current levels, as buyers rushed in since GOLD bottomed out in March.
Moreover, Morningstar's peer analysis suggests no valuation dislocation, as Newmont (NEM) trades at a 23% premium and Agnico Eagle Mines (AEM) at a 34% premium.
Given the sharp recovery recently, we don't think there's a lower-risk entry point to add more positions here.
Hence, we urge investors not to chase the momentum spike. Instead, they should consider waiting for the next steep pullback before pulling the Buy trigger.
Rating: Hold (Reiterated).
Important note: Investors are reminded to do their own due diligence and not rely on the information provided as financial advice. The rating is also not intended to time a specific entry/exit at the point of writing unless otherwise specified.
We Want To Hear From You
Have you spotted a critical gap in our thesis? Saw something important that we didn't? Agree or disagree? Comment below and let us know why, and help everyone to learn better!
A Unique Price Action-based Growth Investing Service
- We believe price action is a leading indicator.
- We called the TSLA top in late 2021.
- We then picked TSLA's bottom in December 2022.
- We updated members that the NASDAQ had long-term bearish price action signals in November 2021.
- We told members that the S&P 500 likely bottomed in October 2022.
- Members navigated the turning points of the market confidently in our service.
- Members tuned out the noise in the financial media and focused on what really matters: Price Action.
Sign up now for a Risk-Free 14-Day free trial!

This article was written by

JR research was featured as one of Seeking Alpha's leading contributors in 2022. See: https://seekingalpha.com/article/4578688-seeking-alpha-contributor-community-2022-by-the-numbers
Unlock the key insights to growth investing with JR Research - led by founder and lead writer JR. Our dedicated team is focused on providing you with the clarity you need to make confident investment decisions.
Transform your investment strategy with our popular Investing Groups service.
Ultimate Growth Investing specializes in a price action-based approach to uncovering the opportunities in growth and technology stocks, backed by actionable fundamental analysis.
We believe price action is a leading indicator.
Price action analysis is a powerful and versatile toolkit for the informed investor because it can be used to analyze any publicly traded security. As such, it offers investors with invaluable insights into understanding market behavior and sentiments.
Plus, stay ahead of the game with our general stock analysis across a wide range of sectors and industries.
Improve your returns and stay ahead of the curve with our short- to medium-term stock analysis.
We not only identify long-term potential but also seize opportunities to profit from short-term market swings, using a combination of long and short set-ups.
Join us and start seeing experiencing the quality of our service today.
I was previously an Executive Director with a global financial services corporation. I led company-wide award-winning wealth management teams that were consistently ranked among the best in the company.
I graduated with an Economics Degree from National University of Singapore [NUS]. NUS is Asia's #1 university according to Quacquarelli Symonds [QS] annual higher education ranking. It also held the #11 position in QS World University Rankings 2022.
I'm also a Commissioned Officer (Reservist) with the Singapore Armed Forces. I was the Battalion Second-in-command of an Armored Regiment. I currently hold the rank of Major. I graduated as the Distinguished Honor Graduate from the Armor Officers' Advanced Course as I finished first in my cohort of Armor officers. I was also conferred the Best in Knowledge award.
My LinkedIn: www.linkedin.com/in/seekjo
Analyst’s Disclosure: I/we have a beneficial long position in the shares of XLF either through stock ownership, options, or other derivatives. I wrote this article myself, and it expresses my own opinions. I am not receiving compensation for it (other than from Seeking Alpha). I have no business relationship with any company whose stock is mentioned in this article.
Seeking Alpha's Disclosure: Past performance is no guarantee of future results. No recommendation or advice is being given as to whether any investment is suitable for a particular investor. Any views or opinions expressed above may not reflect those of Seeking Alpha as a whole. Seeking Alpha is not a licensed securities dealer, broker or US investment adviser or investment bank. Our analysts are third party authors that include both professional investors and individual investors who may not be licensed or certified by any institute or regulatory body.