The Future Of Cedar Fair: Why Investors Should Look Beyond Short-Term Fears

Summary
- Cedar Fair, a theme park and entertainment company, has returned to business as usual coming out of the pandemic, but its unit price has not.
- The company may be undervalued due to valid fears of a 2023 recession.
- Modeling the impact of such an event, it is not nearly as bad as what seems to be currently priced in.
- Long-term investors could see the unit price double once we get past this economic uncertainty in my view.
Joe Hendrickson/iStock Editorial via Getty Images
Investment Thesis
Theme parks were one of the many businesses hit hard by the pandemic. However, Cedar Fair quickly recovered attendance numbers and the unit price mostly followed suit. The next challenge is a potential 2023 recession and impacts on customer’s discretionary income. The unit price is down to around $45, over 20% below its most recent peak of $57.38 in February 2022. While fears of a recession taking place may be well-founded, they can easily over-inflate the potential impact. Even with a rather bearish outlook on attendance numbers, find out why I think this equity is still undervalued and the unit price should double in the next couple of years.
Introduction
Cedar Fair, L.P. (NYSE:FUN) is an entertainment company that owns and operates numerous amusement parks and water parks across the U.S. as well as restaurants and hotels associated with the parks. It is a Publicly Traded Partnership ('PTP'), so I will refer to “unit” prices rather than “share” or “stock” prices and “distributions” rather than “dividends”. This setup, common for real estate and energy companies, passes on profits to limited partners and provides certain tax benefits.
Founded in 1870, Cedar Fair has been quite successful in developing attractive vacation destinations. For instance, Cedar Point, located near company headquarters in Sandusky, Ohio has four stars on Yelp with many visitors highlighting the park’s thrilling coasters like Millennium Force and Maverick. Schlitterbahn New Braunfels near San Antonio Texas is recognized as the world’s best water park, according to Amusement Today’s Golden Ticket Award. The company has slowly added new parks over the years with similar positive perception. This company has longevity. The only thing questionable is how it will be affected by short-term uncertainty.
Cedar Fair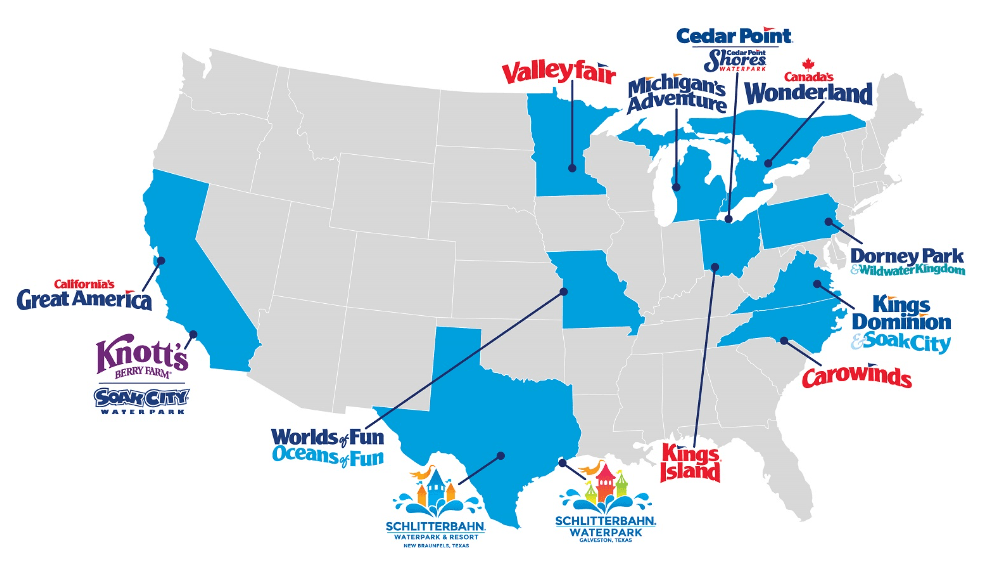
The Impact of a Recession
One of the main concerns the market may have regarding Cedar Fair is how sensitive it is to recessions. Going to theme parks certainly falls in the “nice-to-have'' category that consumers cut back on when money gets tight. In 2009, for instance, when unemployment had reached its peak as a result of the Financial Crisis, attendance numbers to Cedar Fair parks fell 7%. This was nothing, however, compared to the impact of the Covid-19 pandemic. With shutdowns and fears of getting sick, admissions fell off a cliff, going from nearly 28 million in 2019 to less than 10% of that, 2.6 million, in 2020.
Now there are concerns of another potential recession in 2023. Just recently, economists raised the recession odds from 60% to 65%. The yield curve remains inverted, a sign of investors’ concerns around short-term uncertainty. In periods of recession, real disposable income falls or at least flattens, and real disposable income has already had a pretty big dip in 2022 due to inflation. If a recession comes on top of that, it could take something like a fun family vacation at Soak City off the table for many Americans. For reference the chart below shows real disposable income since 2007; I am assuming the spikes in 2020-2021 were the government-issued stimulus checks.
St. Louis Fed
Considering the risk of recession, I tried to model what attendance numbers might look like into the future. Up to 2019, they climbed pretty linearly and then dropped precipitously as mentioned. Coming out of the pandemic, they recovered quickly, returning to the 2019 level of around 27 million in 2022. I assumed that if we did have a recession, attendance numbers could fall 7% again, similar to 2009. In the long-run, though, I would expect them to return to their steady upward climb of around 400,000-500,000 more visitors each year, noting that Cedar Fair has only developed about 70% of its acreage (3050 out of 4440 owned acres) and has room to expand. This is my fundamental basis for projecting Cedar Fair’s future earnings in the sections below.
Author created from annual reports and author forecasts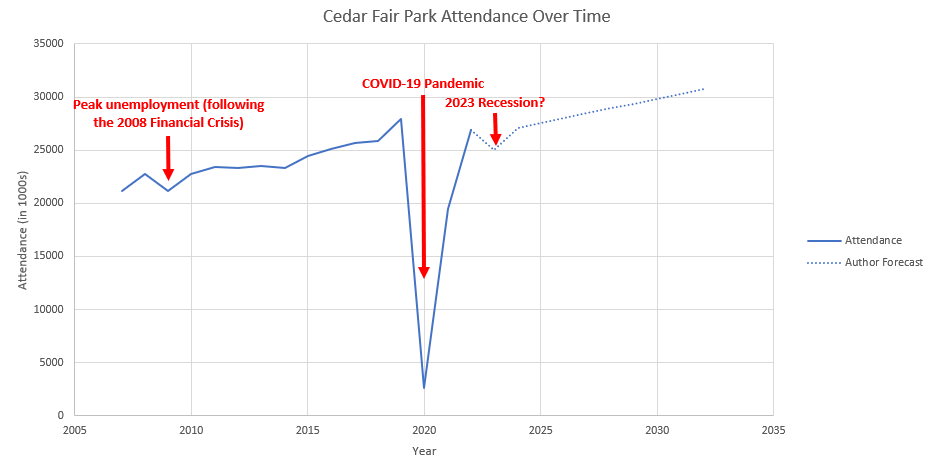
Financial Assumptions and Valuation
Digging into the income statements since 2007, I wanted to better understand the sources of revenue and cost and what assumptions could be used to estimate earnings going forward. Since I had estimated attendance numbers, the first place I looked was per-capita revenue. One result of the pandemic was that per-capita revenues jumped up in 2020 and 2021, and I assumed these could hold pretty steady into the future given the inflation over that period. Total revenue could then be easily estimated by multiplying the most recent per-capita revenue number by projected attendance numbers. The chart below shows the sources of per-capita revenue over time.
Author created from annual reports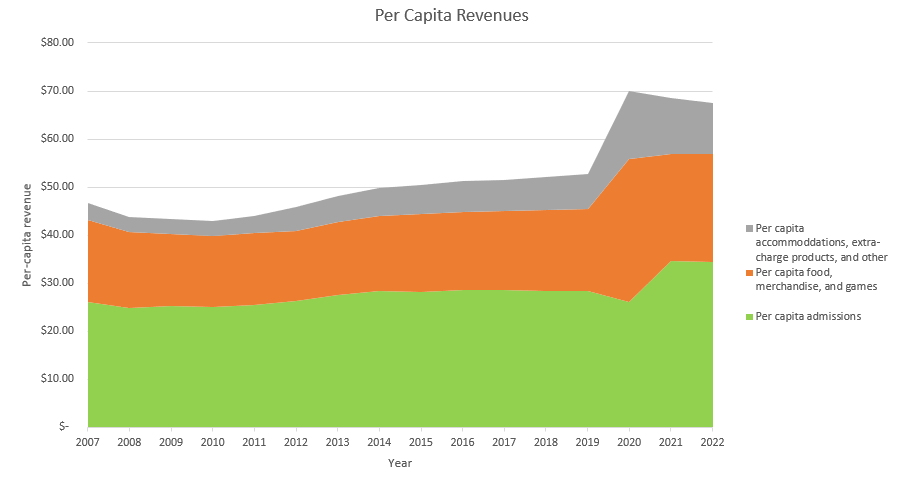
Next, I looked at Operating Costs and Expenses, which have stayed at about 65% of Net Revenues, excluding 2020 when revenues dropped much faster than costs, as can be seen below.
Author created from annual reports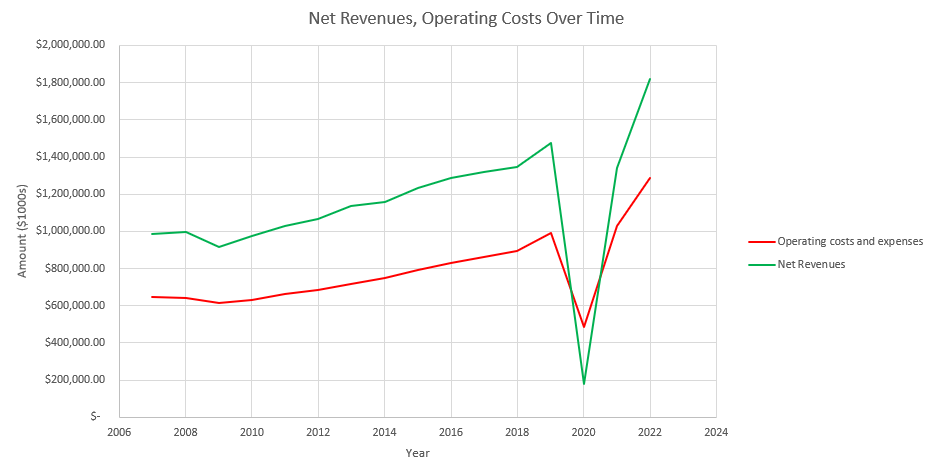
Going through the rest of the income statement, depreciation and amortization has been in the range of $125-$175 million, so I assumed $150 million going forward. Loss on impairment / retirement of fixed assets bounced around quite a bit early on, but has steadied at around $10 million per year. Interest expenses ranged from $80-$180 million, so I assumed $130 million going forward. For this model, I assumed a provision for taxes of 9% of operating income going forward based on the average provision from 2007 to 2022. Please note, that while the partnership arrangement is tax-advantaged for investors, it requires different filings and calculations for personal tax returns. Consider all the implications before investing.
Some lines of the income statement were unpredictable and not included in the forecast. Loss on impairment of goodwill and other intangibles, gain on sale of land, and loss (gain) on other assets are sporadic and were ignored. Likewise, net effect of swaps, loss on early debt extinguishment, and loss (gain) on foreign currency were ignored. All of the ignored sources of cost or additional income, though potentially quite large in particular years, have a relatively small impact on net income on average. For instance, In 2008 the company took a large loss on intangibles due to the recession ($87 million), in 2020 the company took a large loss on intangibles during the pandemic ($104 million), and in 2022 the company had a large one-time sale of land ($155 million). Outside of these anomalous events, though, the impact of these categories was only around a negative $16 million impact on earnings per year.
With all of these assumptions I was able to project future earnings, discounting those projected earnings over 50 years with the average real stock market rate of return of 7%. The full details of the analysis can be seen in the table below.
| 2007 | 2008 | 2009 | 2010 | 2011 | 2012 | 2013 | 2014 | 2015 | 2016 | 2017 | 2018 | 2019 | 2020 | 2021 | 2022 | 2023 | 2024 | 2025 | 2026 | 2027 | 2028 | 2029 | 2030 | 2031 | 2032 | 2033 | 2034 | 2035 | 2036 | 2037 | 2038 | 2039 | 2040 | 2041 | 2042 | 2043 | 2044 | 2045 | 2046 | 2047 | 2048 | 2049 | 2050 | 2051 | 2052 | 2053 | 2054 | 2055 | 2056 | 2057 | 2058 | 2059 | 2060 | 2061 | 2062 | 2063 | 2064 | 2065 | 2066 | 2067 | 2068 | 2069 | 2070 | 2071 | 2072 | |
| Admissions | $ 552,100.00 | $ 566,300.00 | $ 532,800.00 | $ 568,800.00 | $ 596,000.00 | $ 612,100.00 | $ 647,000.00 | $ 661,500.00 | $ 687,400.00 | $ 716,189.00 | $ 734,060.00 | $ 737,676.00 | $ 795,271.00 | $ 67,852.00 | $ 674,799.00 | $ 925,903.00 | ||||||||||||||||||||||||||||||||||||||||||||||||||
| Food, merchandise, and games | $ 360,100.00 | $ 355,900.00 | $ 316,400.00 | $ 337,300.00 | $ 349,500.00 | $ 342,200.00 | $ 356,100.00 | $ 365,500.00 | $ 398,000.00 | $ 407,673.00 | $ 422,469.00 | $ 433,315.00 | $ 473,499.00 | $ 76,921.00 | $ 432,513.00 | $ 602,603.00 | ||||||||||||||||||||||||||||||||||||||||||||||||||
| Accommodations, extra-charge products, and other | $ 74,800.00 | $ 74,000.00 | $ 66,900.00 | $ 71,500.00 | $ 83,000.00 | $ 114,100.00 | $ 131,500.00 | $ 132,600.00 | $ 150,300.00 | $ 164,859.00 | $ 165,438.00 | $ 177,539.00 | $ 206,155.00 | $ 36,782.00 | $ 230,907.00 | $ 288,877.00 | ||||||||||||||||||||||||||||||||||||||||||||||||||
| Net Revenues | $ 987,000.00 | $ 996,200.00 | $ 916,100.00 | $ 977,600.00 | $ 1,028,500.00 | $ 1,068,400.00 | $ 1,134,600.00 | $ 1,159,600.00 | $ 1,235,700.00 | $ 1,288,721.00 | $ 1,321,967.00 | $ 1,348,530.00 | $ 1,474,925.00 | $ 181,555.00 | $ 1,338,219.00 | $ 1,817,383.00 | $ 1,690,166.19 | $ 1,828,892.93 | $ 1,860,127.31 | $ 1,891,361.68 | $ 1,922,596.06 | $ 1,953,830.44 | $ 1,985,064.82 | $ 2,016,299.19 | $ 2,047,533.57 | $ 2,078,767.95 | $ 2,110,002.33 | $ 2,141,236.71 | $ 2,172,471.08 | $ 2,203,705.46 | $ 2,234,939.84 | $ 2,266,174.22 | $ 2,297,408.60 | $ 2,328,642.97 | $ 2,359,877.35 | $ 2,391,111.73 | $ 2,422,346.11 | $ 2,453,580.49 | $ 2,484,814.86 | $ 2,516,049.24 | $ 2,547,283.62 | $ 2,578,518.00 | $ 2,609,752.38 | $ 2,640,986.75 | $ 2,672,221.13 | $ 2,703,455.51 | $ 2,734,689.89 | $ 2,765,924.27 | $ 2,797,158.64 | $ 2,828,393.02 | $ 2,859,627.40 | $ 2,890,861.78 | $ 2,922,096.16 | $ 2,953,330.53 | $ 2,984,564.91 | $ 3,015,799.29 | $ 3,047,033.67 | $ 3,078,268.05 | $ 3,109,502.42 | $ 3,140,736.80 | $ 3,171,971.18 | $ 3,203,205.56 | $ 3,234,439.94 | $ 3,265,674.31 | $ 3,296,908.69 | $ 3,328,143.07 |
| Operating costs and expenses | $ 646,300.00 | $ 640,300.00 | $ 616,200.00 | $ 632,000.00 | $ 663,300.00 | $ 684,700.00 | $ 716,500.00 | $ 748,100.00 | $ 793,900.00 | $ 827,319.00 | $ 862,683.00 | $ 892,416.00 | $ 990,716.00 | $ 483,891.00 | $ 1,030,466.00 | $ 1,289,142.00 | $ 1,098,608.02 | $ 1,188,780.40 | $ 1,209,082.75 | $ 1,229,385.09 | $ 1,249,687.44 | $ 1,269,989.79 | $ 1,290,292.13 | $ 1,310,594.48 | $ 1,330,896.82 | $ 1,351,199.17 | $ 1,371,501.51 | $ 1,391,803.86 | $ 1,412,106.21 | $ 1,432,408.55 | $ 1,452,710.90 | $ 1,473,013.24 | $ 1,493,315.59 | $ 1,513,617.93 | $ 1,533,920.28 | $ 1,554,222.62 | $ 1,574,524.97 | $ 1,594,827.32 | $ 1,615,129.66 | $ 1,635,432.01 | $ 1,655,734.35 | $ 1,676,036.70 | $ 1,696,339.04 | $ 1,716,641.39 | $ 1,736,943.74 | $ 1,757,246.08 | $ 1,777,548.43 | $ 1,797,850.77 | $ 1,818,153.12 | $ 1,838,455.46 | $ 1,858,757.81 | $ 1,879,060.16 | $ 1,899,362.50 | $ 1,919,664.85 | $ 1,939,967.19 | $ 1,960,269.54 | $ 1,980,571.88 | $ 2,000,874.23 | $ 2,021,176.58 | $ 2,041,478.92 | $ 2,061,781.27 | $ 2,082,083.61 | $ 2,102,385.96 | $ 2,122,688.30 | $ 2,142,990.65 | $ 2,163,293.00 |
| Depreciation and amortization | $ 130,600.00 | $ 125,900.00 | $ 132,800.00 | $ 128,900.00 | $ 125,800.00 | $ 126,300.00 | $ 122,500.00 | $ 124,200.00 | $ 125,600.00 | $ 131,876.00 | $ 153,222.00 | $ 155,529.00 | $ 170,458.00 | $ 157,549.00 | $ 148,803.00 | $ 153,274.00 | $ 150,000.00 | $ 150,000.00 | $ 150,000.00 | $ 150,000.00 | $ 150,000.00 | $ 150,000.00 | $ 150,000.00 | $ 150,000.00 | $ 150,000.00 | $ 150,000.00 | $ 150,000.00 | $ 150,000.00 | $ 150,000.00 | $ 150,000.00 | $ 150,000.00 | $ 150,000.00 | $ 150,000.00 | $ 150,000.00 | $ 150,000.00 | $ 150,000.00 | $ 150,000.00 | $ 150,000.00 | $ 150,000.00 | $ 150,000.00 | $ 150,000.00 | $ 150,000.00 | $ 150,000.00 | $ 150,000.00 | $ 150,000.00 | $ 150,000.00 | $ 150,000.00 | $ 150,000.00 | $ 150,000.00 | $ 150,000.00 | $ 150,000.00 | $ 150,000.00 | $ 150,000.00 | $ 150,000.00 | $ 150,000.00 | $ 150,000.00 | $ 150,000.00 | $ 150,000.00 | $ 150,000.00 | $ 150,000.00 | $ 150,000.00 | $ 150,000.00 | $ 150,000.00 | $ 150,000.00 | $ 150,000.00 | $ 150,000.00 |
| Equity-based compensation | $ 600.00 | $ 700.00 | ||||||||||||||||||||||||||||||||||||||||||||||||||||||||||||||||
| Loss on impairment / retirement of fixed assets, net | $ 54,900.00 | $ 8,400.00 | $ 200.00 | $ 62,800.00 | $ 11,400.00 | $ 30,300.00 | $ 2,500.00 | $ 9,800.00 | $ 20,900.00 | $ 12,587.00 | $ 12,728.00 | $ 10,178.00 | $ 4,931.00 | $ 8,135.00 | $ 10,486.00 | $ 10,275.00 | $ 10,000.00 | $ 10,000.00 | $ 10,000.00 | $ 10,000.00 | $ 10,000.00 | $ 10,000.00 | $ 10,000.00 | $ 10,000.00 | $ 10,000.00 | $ 10,000.00 | $ 10,000.00 | $ 10,000.00 | $ 10,000.00 | $ 10,000.00 | $ 10,000.00 | $ 10,000.00 | $ 10,000.00 | $ 10,000.00 | $ 10,000.00 | $ 10,000.00 | $ 10,000.00 | $ 10,000.00 | $ 10,000.00 | $ 10,000.00 | $ 10,000.00 | $ 10,000.00 | $ 10,000.00 | $ 10,000.00 | $ 10,000.00 | $ 10,000.00 | $ 10,000.00 | $ 10,000.00 | $ 10,000.00 | $ 10,000.00 | $ 10,000.00 | $ 10,000.00 | $ 10,000.00 | $ 10,000.00 | $ 10,000.00 | $ 10,000.00 | $ 10,000.00 | $ 10,000.00 | $ 10,000.00 | $ 10,000.00 | $ 10,000.00 | $ 10,000.00 | $ 10,000.00 | $ 10,000.00 | $ 10,000.00 | $ 10,000.00 |
| Loss on impairment of goodwill and other intangibles | $ 87,000.00 | $ 4,500.00 | $ 2,300.00 | $ 103,999.00 | $ 100,000.00 | |||||||||||||||||||||||||||||||||||||||||||||||||||||||||||||
| Gain on sale of land | $ (155,250.00) | |||||||||||||||||||||||||||||||||||||||||||||||||||||||||||||||||
| Loss (gain) on other assets | $ (23,100.00) | $ (6,600.00) | $ (8,700.00) | $ (900.00) | $ (1,877.00) | $ (112.00) | $ (617.00) | $ (11.00) | $ 129.00 | |||||||||||||||||||||||||||||||||||||||||||||||||||||||||
| Operating Income (loss) | $ 154,600.00 | $ 133,900.00 | $ 185,500.00 | $ 151,600.00 | $ 228,000.00 | $ 233,700.00 | $ 301,800.00 | $ 278,400.00 | $ 295,300.00 | $ 316,939.00 | $ 295,211.00 | $ 290,519.00 | $ 309,437.00 | $ (572,008.00) | $ 148,335.00 | $ 519,942.00 | $ 331,558.17 | $ 480,112.52 | $ 491,044.56 | $ 501,976.59 | $ 512,908.62 | $ 523,840.65 | $ 534,772.69 | $ 545,704.72 | $ 556,636.75 | $ 567,568.78 | $ 578,500.82 | $ 589,432.85 | $ 600,364.88 | $ 611,296.91 | $ 622,228.94 | $ 633,160.98 | $ 644,093.01 | $ 655,025.04 | $ 665,957.07 | $ 676,889.11 | $ 687,821.14 | $ 698,753.17 | $ 709,685.20 | $ 720,617.23 | $ 731,549.27 | $ 742,481.30 | $ 753,413.33 | $ 764,345.36 | $ 775,277.40 | $ 786,209.43 | $ 797,141.46 | $ 808,073.49 | $ 819,005.53 | $ 829,937.56 | $ 840,869.59 | $ 851,801.62 | $ 862,733.65 | $ 873,665.69 | $ 884,597.72 | $ 895,529.75 | $ 906,461.78 | $ 917,393.82 | $ 928,325.85 | $ 939,257.88 | $ 950,189.91 | $ 961,121.95 | $ 972,053.98 | $ 982,986.01 | $ 993,918.04 | $ 1,004,850.07 |
| Interest and other expense, net | $ 144,900.00 | $ 129,100.00 | $ 126,000.00 | $ 149,200.00 | $ 158,000.00 | $ 110,600.00 | $ 102,900.00 | $ 96,200.00 | $ 86,800.00 | $ 83,686.00 | $ 84,633.00 | $ 84,354.00 | $ 98,860.00 | $ 150,222.00 | $ 183,732.00 | $ 148,332.00 | $ 130,000.00 | $ 130,000.00 | $ 130,000.00 | $ 130,000.00 | $ 130,000.00 | $ 130,000.00 | $ 130,000.00 | $ 130,000.00 | $ 130,000.00 | $ 130,000.00 | $ 130,000.00 | $ 130,000.00 | $ 130,000.00 | $ 130,000.00 | $ 130,000.00 | $ 130,000.00 | $ 130,000.00 | $ 130,000.00 | $ 130,000.00 | $ 130,000.00 | $ 130,000.00 | $ 130,000.00 | $ 130,000.00 | $ 130,000.00 | $ 130,000.00 | $ 130,000.00 | $ 130,000.00 | $ 130,000.00 | $ 130,000.00 | $ 130,000.00 | $ 130,000.00 | $ 130,000.00 | $ 130,000.00 | $ 130,000.00 | $ 130,000.00 | $ 130,000.00 | $ 130,000.00 | $ 130,000.00 | $ 130,000.00 | $ 130,000.00 | $ 130,000.00 | $ 130,000.00 | $ 130,000.00 | $ 130,000.00 | $ 130,000.00 | $ 130,000.00 | $ 130,000.00 | $ 130,000.00 | $ 130,000.00 | $ 130,000.00 |
| Net effect of swaps | $ 9,200.00 | $ 18,200.00 | $ (13,100.00) | $ (1,500.00) | $ 6,900.00 | $ (2,100.00) | $ (6,900.00) | $ (1,197.00) | $ (45.00) | $ 7,442.00 | $ 16,532.00 | $ 15,849.00 | $ (19,000.00) | $ (25,641.00) | ||||||||||||||||||||||||||||||||||||||||||||||||||||
| Loss on early debt extinguishment | $ 35,300.00 | $ 34,600.00 | $ 29,300.00 | $ 23,121.00 | $ 1,073.00 | $ 2,262.00 | $ 5,909.00 | $ 1,810.00 | ||||||||||||||||||||||||||||||||||||||||||||||||||||||||||
| Loss (gain) on foreign currency | $ (20,600.00) | $ 9,900.00 | $ (9,000.00) | $ 28,900.00 | $ 40,900.00 | $ 81,000.00 | $ (14,656.00) | $ (29,086.00) | $ 36,254.00 | $ (21,107.00) | $ (12,183.00) | $ 6,177.00 | $ 23,784.00 | |||||||||||||||||||||||||||||||||||||||||||||||||||||
| Provision (benefit) for taxes | $ 14,200.00 | $ (900.00) | $ 14,900.00 | $ 2,600.00 | $ 7,900.00 | $ 31,700.00 | $ 20,300.00 | $ 9,900.00 | $ 22,200.00 | $ 71,418.00 | $ 1,112.00 | $ 34,743.00 | $ 42,789.00 | $ (137,915.00) | $ 20,035.00 | $ 63,989.00 | $ 29,840.23 | $ 43,210.13 | $ 44,194.01 | $ 45,177.89 | $ 46,161.78 | $ 47,145.66 | $ 48,129.54 | $ 49,113.42 | $ 50,097.31 | $ 51,081.19 | $ 52,065.07 | $ 53,048.96 | $ 54,032.84 | $ 55,016.72 | $ 56,000.60 | $ 56,984.49 | $ 57,968.37 | $ 58,952.25 | $ 59,936.14 | $ 60,920.02 | $ 61,903.90 | $ 62,887.79 | $ 63,871.67 | $ 64,855.55 | $ 65,839.43 | $ 66,823.32 | $ 67,807.20 | $ 68,791.08 | $ 69,774.97 | $ 70,758.85 | $ 71,742.73 | $ 72,726.61 | $ 73,710.50 | $ 74,694.38 | $ 75,678.26 | $ 76,662.15 | $ 77,646.03 | $ 78,629.91 | $ 79,613.79 | $ 80,597.68 | $ 81,581.56 | $ 82,565.44 | $ 83,549.33 | $ 84,533.21 | $ 85,517.09 | $ 86,500.98 | $ 87,484.86 | $ 88,468.74 | $ 89,452.62 | $ 90,436.51 |
| Tax rate | 9% | -1% | 8% | 2% | 3% | 14% | 7% | 4% | 8% | 23% | 0% | 12% | 14% | 24% | 14% | 12% | 9% | 9% | 9% | 9% | 9% | 9% | 9% | 9% | 9% | 9% | 9% | 9% | 9% | 9% | 9% | 9% | 9% | 9% | 9% | 9% | 9% | 9% | 9% | 9% | 9% | 9% | 9% | 9% | 9% | 9% | 9% | 9% | 9% | 9% | 9% | 9% | 9% | 9% | 9% | 9% | 9% | 9% | 9% | 9% | 9% | 9% | 9% | 9% | 9% | 9% |
| Net (loss) income | $ (4,500.00) | $ 5,700.00 | $ 35,400.00 | $ (33,100.00) | $ 65,300.00 | $ 101,900.00 | $ 108,200.00 | $ 104,200.00 | $ 112,200.00 | $ 177,688.00 | $ 215,476.00 | $ 126,653.00 | $ 172,363.00 | $ (590,243.00) | $ (48,518.00) | $ 307,668.00 | $ 171,717.93 | $ 306,902.40 | $ 316,850.55 | $ 326,798.70 | $ 336,746.85 | $ 346,694.99 | $ 356,643.14 | $ 366,591.29 | $ 376,539.44 | $ 386,487.59 | $ 396,435.74 | $ 406,383.89 | $ 416,332.04 | $ 426,280.19 | $ 436,228.34 | $ 446,176.49 | $ 456,124.64 | $ 466,072.79 | $ 476,020.94 | $ 485,969.09 | $ 495,917.24 | $ 505,865.38 | $ 515,813.53 | $ 525,761.68 | $ 535,709.83 | $ 545,657.98 | $ 555,606.13 | $ 565,554.28 | $ 575,502.43 | $ 585,450.58 | $ 595,398.73 | $ 605,346.88 | $ 615,295.03 | $ 625,243.18 | $ 635,191.33 | $ 645,139.48 | $ 655,087.63 | $ 665,035.78 | $ 674,983.92 | $ 684,932.07 | $ 694,880.22 | $ 704,828.37 | $ 714,776.52 | $ 724,724.67 | $ 734,672.82 | $ 744,620.97 | $ 754,569.12 | $ 764,517.27 | $ 774,465.42 | $ 784,413.57 |
| Net Margin | -0.46% | 0.57% | 3.86% | -3.39% | 6.35% | 9.54% | 9.54% | 8.99% | 9.08% | 13.79% | 16.30% | 9.39% | 11.69% | -325.10% | -3.63% | 16.93% | ||||||||||||||||||||||||||||||||||||||||||||||||||
| EPS | $ 3.31 | $ 5.91 | $ 6.10 | $ 6.29 | $ 6.48 | $ 6.68 | $ 6.87 | $ 7.06 | $ 7.25 | $ 7.44 | $ 7.63 | $ 7.83 | $ 8.02 | $ 8.21 | $ 8.40 | $ 8.59 | $ 8.78 | $ 8.98 | $ 9.17 | $ 9.36 | $ 9.55 | $ 9.74 | $ 9.93 | $ 10.12 | $ 10.32 | $ 10.51 | $ 10.70 | $ 10.89 | $ 11.08 | $ 11.27 | $ 11.47 | $ 11.66 | $ 11.85 | $ 12.04 | $ 12.23 | $ 12.42 | $ 12.61 | $ 12.81 | $ 13.00 | $ 13.19 | $ 13.38 | $ 13.57 | $ 13.76 | $ 13.96 | $ 14.15 | $ 14.34 | $ 14.53 | $ 14.72 | $ 14.91 | $ 15.11 | ||||||||||||||||
| EPS discounted (7%) | $ 3.31 | $ 5.52 | $ 5.33 | $ 5.14 | $ 4.95 | $ 4.76 | $ 4.58 | $ 4.40 | $ 4.22 | $ 4.05 | $ 3.88 | $ 3.72 | $ 3.56 | $ 3.41 | $ 3.26 | $ 3.11 | $ 2.98 | $ 2.84 | $ 2.71 | $ 2.59 | $ 2.47 | $ 2.35 | $ 2.24 | $ 2.14 | $ 2.03 | $ 1.94 | $ 1.84 | $ 1.75 | $ 1.67 | $ 1.58 | $ 1.51 | $ 1.43 | $ 1.36 | $ 1.29 | $ 1.23 | $ 1.16 | $ 1.10 | $ 1.05 | $ 0.99 | $ 0.94 | $ 0.89 | $ 0.85 | $ 0.80 | $ 0.76 | $ 0.72 | $ 0.68 | $ 0.65 | $ 0.61 | $ 0.58 | $ 0.55 |
Summing the discounted cash flows resulted in a valuation of $117.47, over 2.5 times the current unit price of around $45. At current earnings per share of $5.45, that is a PE ratio of 21.4. Just before the pandemic units were trading at a PE ratio of 26. Since business is returning to pre-pandemic levels, it makes sense that the unit price deserves to rise to pre-pandemic levels as well, so this valuation seems reasonable as a first pass.
Risks
There are numerous risks that should be considered. Firstly, as of 4th quarter 2022, Cedar Fair’s debts were greater than its liabilities, creating a partner deficit of nearly $600 million. This puts it in a less secure position going into a possible recession. However, the company has made significant progress toward its stated goals around debt achieving net leverage close to pre-pandemic levels and net debt close to its $2 billion target.
Something else I find helpful is the company’s new approach to distributions, which affords a greater amount of flexibility. It is common for Limited Partnerships to pass on their profits in the form of distributions, and Cedar Fair had done so for a long time, steadily raising its quarterly payments up until the pandemic. At the end of 2019 the quarterly payment was up to $0.935, though they paused payments during 2020 and 2021. Then, in 2022, they re-established distributions at a much lower quarterly amount of $0.30, but still returned earnings to partners through a unit buyback program. This approach gives much greater flexibility on how to deploy capital. In my mind this helps safeguard to a greater extent against significant downturns by keeping the optionality to use capital to shore up the business in another recession without feeling pressure to maintain high distributions. This gives me greater confidence in the company’s ability to survive such an event.
The big risk for the accuracy of this model, though, for those who are familiar with Nassim Taleb’s works such as 'The Black Swan', is that we cannot simply assume that the next catastrophe will have the same impact as a previous one, even the worst previous one. I doubt a recession could have the same impact as a global pandemic, but consider if instead of attendance falling 7% as it did in 2009, it falls double that. This company is in an industry that is especially sensitive to recessions, so that is a possibility. Beyond that, some economists like Gad Levanon are saying that growth could slow for the next decade, not just the next year.
To account for these risks, I repeated the earnings forecast above but changed the assumptions to put together a bear case where a 2023 recession causes a 14% decline in attendance rather than a 7% decline and assumed attendance would level off at 2019/2022 levels of about 27.5 million rather than continue to grow. The full details can be seen in the following table.
2007 | 2008 | 2009 | 2010 | 2011 | 2012 | 2013 | 2014 | 2015 | 2016 | 2017 | 2018 | 2019 | 2020 | 2021 | 2022 | 2023 | 2024 | 2025 | 2026 | 2027 | 2028 | 2029 | 2030 | 2031 | 2032 | 2033 | 2034 | 2035 | 2036 | 2037 | 2038 | 2039 | 2040 | 2041 | 2042 | 2043 | 2044 | 2045 | 2046 | 2047 | 2048 | 2049 | 2050 | 2051 | 2052 | 2053 | 2054 | 2055 | 2056 | 2057 | 2058 | 2059 | 2060 | 2061 | 2062 | 2063 | 2064 | 2065 | 2066 | 2067 | 2068 | 2069 | 2070 | 2071 | 2072 | |
Admissions | $ 552,100.00 | $ 566,300.00 | $ 532,800.00 | $ 568,800.00 | $ 596,000.00 | $ 612,100.00 | $ 647,000.00 | $ 661,500.00 | $ 687,400.00 | $ 716,189.00 | $ 734,060.00 | $ 737,676.00 | $ 795,271.00 | $ 67,852.00 | $ 674,799.00 | $ 925,903.00 | ||||||||||||||||||||||||||||||||||||||||||||||||||
Food, merchandise, and games | $ 360,100.00 | $ 355,900.00 | $ 316,400.00 | $ 337,300.00 | $ 349,500.00 | $ 342,200.00 | $ 356,100.00 | $ 365,500.00 | $ 398,000.00 | $ 407,673.00 | $ 422,469.00 | $ 433,315.00 | $ 473,499.00 | $ 76,921.00 | $ 432,513.00 | $ 602,603.00 | ||||||||||||||||||||||||||||||||||||||||||||||||||
Accommodations, extra-charge products, and other | $ 74,800.00 | $ 74,000.00 | $ 66,900.00 | $ 71,500.00 | $ 83,000.00 | $ 114,100.00 | $ 131,500.00 | $ 132,600.00 | $ 150,300.00 | $ 164,859.00 | $ 165,438.00 | $ 177,539.00 | $ 206,155.00 | $ 36,782.00 | $ 230,907.00 | $ 288,877.00 | ||||||||||||||||||||||||||||||||||||||||||||||||||
Net Revenues | $ 987,000.00 | $ 996,200.00 | $ 916,100.00 | $ 977,600.00 | $ 1,028,500.00 | $ 1,068,400.00 | $ 1,134,600.00 | $ 1,159,600.00 | $ 1,235,700.00 | $ 1,288,721.00 | $ 1,321,967.00 | $ 1,348,530.00 | $ 1,474,925.00 | $ 181,555.00 | $ 1,338,219.00 | $ 1,817,383.00 | $ 1,562,949.38 | $ 1,688,264.53 | $ 1,857,090.98 | $ 1,857,090.98 | $ 1,857,090.98 | $ 1,857,090.98 | $ 1,857,090.98 | $ 1,857,090.98 | $ 1,857,090.98 | $ 1,857,090.98 | $ 1,857,090.98 | $ 1,857,090.98 | $ 1,857,090.98 | $ 1,857,090.98 | $ 1,857,090.98 | $ 1,857,090.98 | $ 1,857,090.98 | $ 1,857,090.98 | $ 1,857,090.98 | $ 1,857,090.98 | $ 1,857,090.98 | $ 1,857,090.98 | $ 1,857,090.98 | $ 1,857,090.98 | $ 1,857,090.98 | $ 1,857,090.98 | $ 1,857,090.98 | $ 1,857,090.98 | $ 1,857,090.98 | $ 1,857,090.98 | $ 1,857,090.98 | $ 1,857,090.98 | $ 1,857,090.98 | $ 1,857,090.98 | $ 1,857,090.98 | $ 1,857,090.98 | $ 1,857,090.98 | $ 1,857,090.98 | $ 1,857,090.98 | $ 1,857,090.98 | $ 1,857,090.98 | $ 1,857,090.98 | $ 1,857,090.98 | $ 1,857,090.98 | $ 1,857,090.98 | $ 1,857,090.98 | $ 1,857,090.98 | $ 1,857,090.98 | $ 1,857,090.98 | $ 1,857,090.98 |
Operating costs and expenses | $ 646,300.00 | $ 640,300.00 | $ 616,200.00 | $ 632,000.00 | $ 663,300.00 | $ 684,700.00 | $ 716,500.00 | $ 748,100.00 | $ 793,900.00 | $ 827,319.00 | $ 862,683.00 | $ 892,416.00 | $ 990,716.00 | $ 483,891.00 | $ 1,030,466.00 | $ 1,289,142.00 | $ 1,015,917.10 | $ 1,097,371.94 | $ 1,207,109.14 | $ 1,207,109.14 | $ 1,207,109.14 | $ 1,207,109.14 | $ 1,207,109.14 | $ 1,207,109.14 | $ 1,207,109.14 | $ 1,207,109.14 | $ 1,207,109.14 | $ 1,207,109.14 | $ 1,207,109.14 | $ 1,207,109.14 | $ 1,207,109.14 | $ 1,207,109.14 | $ 1,207,109.14 | $ 1,207,109.14 | $ 1,207,109.14 | $ 1,207,109.14 | $ 1,207,109.14 | $ 1,207,109.14 | $ 1,207,109.14 | $ 1,207,109.14 | $ 1,207,109.14 | $ 1,207,109.14 | $ 1,207,109.14 | $ 1,207,109.14 | $ 1,207,109.14 | $ 1,207,109.14 | $ 1,207,109.14 | $ 1,207,109.14 | $ 1,207,109.14 | $ 1,207,109.14 | $ 1,207,109.14 | $ 1,207,109.14 | $ 1,207,109.14 | $ 1,207,109.14 | $ 1,207,109.14 | $ 1,207,109.14 | $ 1,207,109.14 | $ 1,207,109.14 | $ 1,207,109.14 | $ 1,207,109.14 | $ 1,207,109.14 | $ 1,207,109.14 | $ 1,207,109.14 | $ 1,207,109.14 | $ 1,207,109.14 | $ 1,207,109.14 |
Depreciation and amortization | $ 130,600.00 | $ 125,900.00 | $ 132,800.00 | $ 128,900.00 | $ 125,800.00 | $ 126,300.00 | $ 122,500.00 | $ 124,200.00 | $ 125,600.00 | $ 131,876.00 | $ 153,222.00 | $ 155,529.00 | $ 170,458.00 | $ 157,549.00 | $ 148,803.00 | $ 153,274.00 | $ 150,000.00 | $ 150,000.00 | $ 150,000.00 | $ 150,000.00 | $ 150,000.00 | $ 150,000.00 | $ 150,000.00 | $ 150,000.00 | $ 150,000.00 | $ 150,000.00 | $ 150,000.00 | $ 150,000.00 | $ 150,000.00 | $ 150,000.00 | $ 150,000.00 | $ 150,000.00 | $ 150,000.00 | $ 150,000.00 | $ 150,000.00 | $ 150,000.00 | $ 150,000.00 | $ 150,000.00 | $ 150,000.00 | $ 150,000.00 | $ 150,000.00 | $ 150,000.00 | $ 150,000.00 | $ 150,000.00 | $ 150,000.00 | $ 150,000.00 | $ 150,000.00 | $ 150,000.00 | $ 150,000.00 | $ 150,000.00 | $ 150,000.00 | $ 150,000.00 | $ 150,000.00 | $ 150,000.00 | $ 150,000.00 | $ 150,000.00 | $ 150,000.00 | $ 150,000.00 | $ 150,000.00 | $ 150,000.00 | $ 150,000.00 | $ 150,000.00 | $ 150,000.00 | $ 150,000.00 | $ 150,000.00 | $ 150,000.00 |
Equity-based compensation | $ 600.00 | $ 700.00 | ||||||||||||||||||||||||||||||||||||||||||||||||||||||||||||||||
Loss on impairment / retirement of fixed assets, net | $ 54,900.00 | $ 8,400.00 | $ 200.00 | $ 62,800.00 | $ 11,400.00 | $ 30,300.00 | $ 2,500.00 | $ 9,800.00 | $ 20,900.00 | $ 12,587.00 | $ 12,728.00 | $ 10,178.00 | $ 4,931.00 | $ 8,135.00 | $ 10,486.00 | $ 10,275.00 | $ 10,000.00 | $ 10,000.00 | $ 10,000.00 | $ 10,000.00 | $ 10,000.00 | $ 10,000.00 | $ 10,000.00 | $ 10,000.00 | $ 10,000.00 | $ 10,000.00 | $ 10,000.00 | $ 10,000.00 | $ 10,000.00 | $ 10,000.00 | $ 10,000.00 | $ 10,000.00 | $ 10,000.00 | $ 10,000.00 | $ 10,000.00 | $ 10,000.00 | $ 10,000.00 | $ 10,000.00 | $ 10,000.00 | $ 10,000.00 | $ 10,000.00 | $ 10,000.00 | $ 10,000.00 | $ 10,000.00 | $ 10,000.00 | $ 10,000.00 | $ 10,000.00 | $ 10,000.00 | $ 10,000.00 | $ 10,000.00 | $ 10,000.00 | $ 10,000.00 | $ 10,000.00 | $ 10,000.00 | $ 10,000.00 | $ 10,000.00 | $ 10,000.00 | $ 10,000.00 | $ 10,000.00 | $ 10,000.00 | $ 10,000.00 | $ 10,000.00 | $ 10,000.00 | $ 10,000.00 | $ 10,000.00 | $ 10,000.00 |
Loss on impairment of goodwill and other intangibles | $ 87,000.00 | $ 4,500.00 | $ 2,300.00 | $ 103,999.00 | $ 100,000.00 | |||||||||||||||||||||||||||||||||||||||||||||||||||||||||||||
Gain on sale of land | $ (155,250.00) | |||||||||||||||||||||||||||||||||||||||||||||||||||||||||||||||||
Loss (gain) on other assets | $ (23,100.00) | $ (6,600.00) | $ (8,700.00) | $ (900.00) | $ (1,877.00) | $ (112.00) | $ (617.00) | $ (11.00) | $ 129.00 | |||||||||||||||||||||||||||||||||||||||||||||||||||||||||
Operating Income (loss) | $ 154,600.00 | $ 133,900.00 | $ 185,500.00 | $ 151,600.00 | $ 228,000.00 | $ 233,700.00 | $ 301,800.00 | $ 278,400.00 | $ 295,300.00 | $ 316,939.00 | $ 295,211.00 | $ 290,519.00 | $ 309,437.00 | $ (572,008.00) | $ 148,335.00 | $ 519,942.00 | $ 287,032.28 | $ 430,892.59 | $ 489,981.84 | $ 489,981.84 | $ 489,981.84 | $ 489,981.84 | $ 489,981.84 | $ 489,981.84 | $ 489,981.84 | $ 489,981.84 | $ 489,981.84 | $ 489,981.84 | $ 489,981.84 | $ 489,981.84 | $ 489,981.84 | $ 489,981.84 | $ 489,981.84 | $ 489,981.84 | $ 489,981.84 | $ 489,981.84 | $ 489,981.84 | $ 489,981.84 | $ 489,981.84 | $ 489,981.84 | $ 489,981.84 | $ 489,981.84 | $ 489,981.84 | $ 489,981.84 | $ 489,981.84 | $ 489,981.84 | $ 489,981.84 | $ 489,981.84 | $ 489,981.84 | $ 489,981.84 | $ 489,981.84 | $ 489,981.84 | $ 489,981.84 | $ 489,981.84 | $ 489,981.84 | $ 489,981.84 | $ 489,981.84 | $ 489,981.84 | $ 489,981.84 | $ 489,981.84 | $ 489,981.84 | $ 489,981.84 | $ 489,981.84 | $ 489,981.84 | $ 489,981.84 | $ 489,981.84 |
Interest and other expense, net | $ 144,900.00 | $ 129,100.00 | $ 126,000.00 | $ 149,200.00 | $ 158,000.00 | $ 110,600.00 | $ 102,900.00 | $ 96,200.00 | $ 86,800.00 | $ 83,686.00 | $ 84,633.00 | $ 84,354.00 | $ 98,860.00 | $ 150,222.00 | $ 183,732.00 | $ 148,332.00 | $ 130,000.00 | $ 130,000.00 | $ 130,000.00 | $ 130,000.00 | $ 130,000.00 | $ 130,000.00 | $ 130,000.00 | $ 130,000.00 | $ 130,000.00 | $ 130,000.00 | $ 130,000.00 | $ 130,000.00 | $ 130,000.00 | $ 130,000.00 | $ 130,000.00 | $ 130,000.00 | $ 130,000.00 | $ 130,000.00 | $ 130,000.00 | $ 130,000.00 | $ 130,000.00 | $ 130,000.00 | $ 130,000.00 | $ 130,000.00 | $ 130,000.00 | $ 130,000.00 | $ 130,000.00 | $ 130,000.00 | $ 130,000.00 | $ 130,000.00 | $ 130,000.00 | $ 130,000.00 | $ 130,000.00 | $ 130,000.00 | $ 130,000.00 | $ 130,000.00 | $ 130,000.00 | $ 130,000.00 | $ 130,000.00 | $ 130,000.00 | $ 130,000.00 | $ 130,000.00 | $ 130,000.00 | $ 130,000.00 | $ 130,000.00 | $ 130,000.00 | $ 130,000.00 | $ 130,000.00 | $ 130,000.00 | $ 130,000.00 |
Net effect of swaps | $ 9,200.00 | $ 18,200.00 | $ (13,100.00) | $ (1,500.00) | $ 6,900.00 | $ (2,100.00) | $ (6,900.00) | $ (1,197.00) | $ (45.00) | $ 7,442.00 | $ 16,532.00 | $ 15,849.00 | $ (19,000.00) | $ (25,641.00) | ||||||||||||||||||||||||||||||||||||||||||||||||||||
Loss on early debt extinguishment | $ 35,300.00 | $ 34,600.00 | $ 29,300.00 | $ 23,121.00 | $ 1,073.00 | $ 2,262.00 | $ 5,909.00 | $ 1,810.00 | ||||||||||||||||||||||||||||||||||||||||||||||||||||||||||
Loss (gain) on foreign currency | $ (20,600.00) | $ 9,900.00 | $ (9,000.00) | $ 28,900.00 | $ 40,900.00 | $ 81,000.00 | $ (14,656.00) | $ (29,086.00) | $ 36,254.00 | $ (21,107.00) | $ (12,183.00) | $ 6,177.00 | $ 23,784.00 | |||||||||||||||||||||||||||||||||||||||||||||||||||||
Provision (benefit) for taxes | $ 14,200.00 | $ (900.00) | $ 14,900.00 | $ 2,600.00 | $ 7,900.00 | $ 31,700.00 | $ 20,300.00 | $ 9,900.00 | $ 22,200.00 | $ 71,418.00 | $ 1,112.00 | $ 34,743.00 | $ 42,789.00 | $ (137,915.00) | $ 20,035.00 | $ 63,989.00 | $ 25,832.91 | $ 38,780.33 | $ 44,098.37 | $ 44,098.37 | $ 44,098.37 | $ 44,098.37 | $ 44,098.37 | $ 44,098.37 | $ 44,098.37 | $ 44,098.37 | $ 44,098.37 | $ 44,098.37 | $ 44,098.37 | $ 44,098.37 | $ 44,098.37 | $ 44,098.37 | $ 44,098.37 | $ 44,098.37 | $ 44,098.37 | $ 44,098.37 | $ 44,098.37 | $ 44,098.37 | $ 44,098.37 | $ 44,098.37 | $ 44,098.37 | $ 44,098.37 | $ 44,098.37 | $ 44,098.37 | $ 44,098.37 | $ 44,098.37 | $ 44,098.37 | $ 44,098.37 | $ 44,098.37 | $ 44,098.37 | $ 44,098.37 | $ 44,098.37 | $ 44,098.37 | $ 44,098.37 | $ 44,098.37 | $ 44,098.37 | $ 44,098.37 | $ 44,098.37 | $ 44,098.37 | $ 44,098.37 | $ 44,098.37 | $ 44,098.37 | $ 44,098.37 | $ 44,098.37 | $ 44,098.37 | $ 44,098.37 |
Tax rate | 9% | -1% | 8% | 2% | 3% | 14% | 7% | 4% | 8% | 23% | 0% | 12% | 14% | 24% | 14% | 12% | 9% | 9% | 9% | 9% | 9% | 9% | 9% | 9% | 9% | 9% | 9% | 9% | 9% | 9% | 9% | 9% | 9% | 9% | 9% | 9% | 9% | 9% | 9% | 9% | 9% | 9% | 9% | 9% | 9% | 9% | 9% | 9% | 9% | 9% | 9% | 9% | 9% | 9% | 9% | 9% | 9% | 9% | 9% | 9% | 9% | 9% | 9% | 9% | 9% | 9% |
Net (loss) income | $ (4,500.00) | $ 5,700.00 | $ 35,400.00 | $ (33,100.00) | $ 65,300.00 | $ 101,900.00 | $ 108,200.00 | $ 104,200.00 | $ 112,200.00 | $ 177,688.00 | $ 215,476.00 | $ 126,653.00 | $ 172,363.00 | $ (590,243.00) | $ (48,518.00) | $ 307,668.00 | $ 131,199.38 | $ 262,112.25 | $ 315,883.48 | $ 315,883.48 | $ 315,883.48 | $ 315,883.48 | $ 315,883.48 | $ 315,883.48 | $ 315,883.48 | $ 315,883.48 | $ 315,883.48 | $ 315,883.48 | $ 315,883.48 | $ 315,883.48 | $ 315,883.48 | $ 315,883.48 | $ 315,883.48 | $ 315,883.48 | $ 315,883.48 | $ 315,883.48 | $ 315,883.48 | $ 315,883.48 | $ 315,883.48 | $ 315,883.48 | $ 315,883.48 | $ 315,883.48 | $ 315,883.48 | $ 315,883.48 | $ 315,883.48 | $ 315,883.48 | $ 315,883.48 | $ 315,883.48 | $ 315,883.48 | $ 315,883.48 | $ 315,883.48 | $ 315,883.48 | $ 315,883.48 | $ 315,883.48 | $ 315,883.48 | $ 315,883.48 | $ 315,883.48 | $ 315,883.48 | $ 315,883.48 | $ 315,883.48 | $ 315,883.48 | $ 315,883.48 | $ 315,883.48 | $ 315,883.48 | $ 315,883.48 | $ 315,883.48 |
Net Margin | -0.46% | 0.57% | 3.86% | -3.39% | 6.35% | 9.54% | 9.54% | 8.99% | 9.08% | 13.79% | 16.30% | 9.39% | 11.69% | -325.10% | -3.63% | 16.93% | ||||||||||||||||||||||||||||||||||||||||||||||||||
EPS | $ 2.53 | $ 5.05 | $ 6.08 | $ 6.08 | $ 6.08 | $ 6.08 | $ 6.08 | $ 6.08 | $ 6.08 | $ 6.08 | $ 6.08 | $ 6.08 | $ 6.08 | $ 6.08 | $ 6.08 | $ 6.08 | $ 6.08 | $ 6.08 | $ 6.08 | $ 6.08 | $ 6.08 | $ 6.08 | $ 6.08 | $ 6.08 | $ 6.08 | $ 6.08 | $ 6.08 | $ 6.08 | $ 6.08 | $ 6.08 | $ 6.08 | $ 6.08 | $ 6.08 | $ 6.08 | $ 6.08 | $ 6.08 | $ 6.08 | $ 6.08 | $ 6.08 | $ 6.08 | $ 6.08 | $ 6.08 | $ 6.08 | $ 6.08 | $ 6.08 | $ 6.08 | $ 6.08 | $ 6.08 | $ 6.08 | $ 6.08 | ||||||||||||||||
EPS discounted (7%) | $ 2.53 | $ 4.72 | $ 5.31 | $ 4.97 | $ 4.64 | $ 4.34 | $ 4.05 | $ 3.79 | $ 3.54 | $ 3.31 | $ 3.09 | $ 2.89 | $ 2.70 | $ 2.52 | $ 2.36 | $ 2.20 | $ 2.06 | $ 1.93 | $ 1.80 | $ 1.68 | $ 1.57 | $ 1.47 | $ 1.37 | $ 1.28 | $ 1.20 | $ 1.12 | $ 1.05 | $ 0.98 | $ 0.91 | $ 0.86 | $ 0.80 | $ 0.75 | $ 0.70 | $ 0.65 | $ 0.61 | $ 0.57 | $ 0.53 | $ 0.50 | $ 0.47 | $ 0.43 | $ 0.41 | $ 0.38 | $ 0.35 | $ 0.33 | $ 0.31 | $ 0.29 | $ 0.27 | $ 0.25 | $ 0.24 | $ 0.22 |
The good news is that even in this bear case scenario the company would still be profitable in 2023 and even with flat attendance levels the security is still undervalued. I calculated a value of $85.30, close to double the current price and at a PE ratio of 15.6. Granted, the unit price could still dip significantly in the short-term given the negativity in the market if there is a downturn this year. Units are currently trading at a PE ratio of around 8 as opposed to 2015-2019 when they traded around a PE ratio of 15 to above 20. A shock to earnings could have a corresponding shock to the unit price until confidence is restored in the company’s continued ability to perform. Long-term investors, though, should see a rapid recovery the following year and in years to come as in nearly any scenario, I believe the unit price deserves to at least double from where it is today.
Conclusion
Cedar Fair has a very long history of existence and a track record of steady growth in recent decades. While it is in an industry that is sensitive to recessions, it weathered the 2008 Financial Crisis and the much more severe impact of COVID-19. It seems likely that the company is being undervalued due to fears of another recession in 2023. Given the inversion of the yield curve and the outlook of many economists, that outcome seems more and more likely. However, modeling how the company could perform in the coming years indicates to me that the impact of such an event is overblown. A PE ratio in the 15-20 range seems more reasonable for this company, in line with unit prices pre-pandemic. While investors should consider the tax and accounting implications first, this company earns a long-term buy rating from me based on its valuations in both base and bear case scenarios.
This article was written by

Analyst’s Disclosure: I/we have no stock, option or similar derivative position in any of the companies mentioned, but may initiate a beneficial Long position through a purchase of the stock, or the purchase of call options or similar derivatives in FUN over the next 72 hours. I wrote this article myself, and it expresses my own opinions. I am not receiving compensation for it (other than from Seeking Alpha). I have no business relationship with any company whose stock is mentioned in this article.
Seeking Alpha's Disclosure: Past performance is no guarantee of future results. No recommendation or advice is being given as to whether any investment is suitable for a particular investor. Any views or opinions expressed above may not reflect those of Seeking Alpha as a whole. Seeking Alpha is not a licensed securities dealer, broker or US investment adviser or investment bank. Our analysts are third party authors that include both professional investors and individual investors who may not be licensed or certified by any institute or regulatory body.