SYLD: High Cyclical Exposure May Underperform In A Recession

Summary
- The Cambria Shareholder Yield ETF provides exposure to companies that exhibit high shareholder yields and value characteristics.
- The fund is very overweight cyclical sectors such as Consumer Discretionary, Energy, Materials, and Financials. In total, cyclical sectors account for 86.8% of the fund.
- With a high probability of a recession in 2023, I would avoid this cyclical fund.
Feverpitched
The Cambria Shareholder Yield ETF (BATS:SYLD) provides exposure to companies with high 'shareholder yields' and value characteristics. The fund's selection criteria appear to skew towards the cyclical sectors, which account for 86.8% of the portfolio. The fund's cyclical bent allowed it to massively outperform in 2020 and early 2021. However, performance has been mediocre since then.
Looking forward, I am worried that the SYLD ETF will underperform in a recession scenario due to its high cyclical exposure. I recommend investors avoid this fund for now.
Fund Overview
The Cambria Shareholder Yield ETF provides exposure to companies with strong free cash flows. The SYLD ETF focuses on 'shareholder yield', which is characterized by high dividend payments, net share repurchases, and net debt paydowns.
The SYLD ETF has $760 million in assets and charges a 0.59% expense ratio.
Strategy
To construct the SYLD ETF, the investment manager first selects the top 20% of stocks in the investment universe ranked by shareholder yield. Next, the manager applies quantitative algorithms to rank the stocks based on value metrics such as price-to-book ("P/B"), price-to-sales ("P/S"), and price-to-earnings ("P/E"). Finally, Cambria selects the top 100 stocks for inclusion into the ETF, picking companies that exhibit the best combination of shareholder yield and value characteristics. These 100 stocks are equal-weighted.
Portfolio Holdings
Figure 1 shows the SYLD ETF's market cap allocation and sector allocation as of December 31, 2022. The ETF predominantly invests in mid- and large-cap companies.
Figure 1 - SYLD market cap and sector allocation (SYLD factsheet)
The ETF is heavily weighted towards the Consumer Discretionary (25.7%), Financials (20.7%), Energy (18.1%), Materials (16.3%) and Health Care (6.6%) sectors.
Investors should note that SYLD's sector exposure is quite different from the market, as modeled by the SPDR S&P 500 ETF Trust (SPY)'s sector weighting (Figure 2).
Figure 2 - SPY sector allocation (ssga.com)
Relative to the SPY ETF, the SYLD ETF is very overweight Consumer Discretionary (25.7% vs. 10.0%), Financials (20.7% vs. 12.9%), Energy (18.1% vs. 4.8%) and Materials (16.3% vs. 2.7%). It is very underweight Information Technology (4.8% vs. 26.0%), Health Care (6.6% vs. 14.3%) and Consumer Staples (1.3% vs. 7.3%).
SYLD's sector weightings can vary from one period to the next. Figure 3 shows the SYLD ETF's sector weights as of April 30, 2022. We can see Energy's weight was only 10.4% in April, but jumped to 18.1% by December primarily at the expense of Financials (23.5% in April to 20.7% in December) and Consumer Staples (3.8% to 1.3%).
Figure 3 - SYLD sector weights as of April 30, 2022 (SYLD 2022 annual report)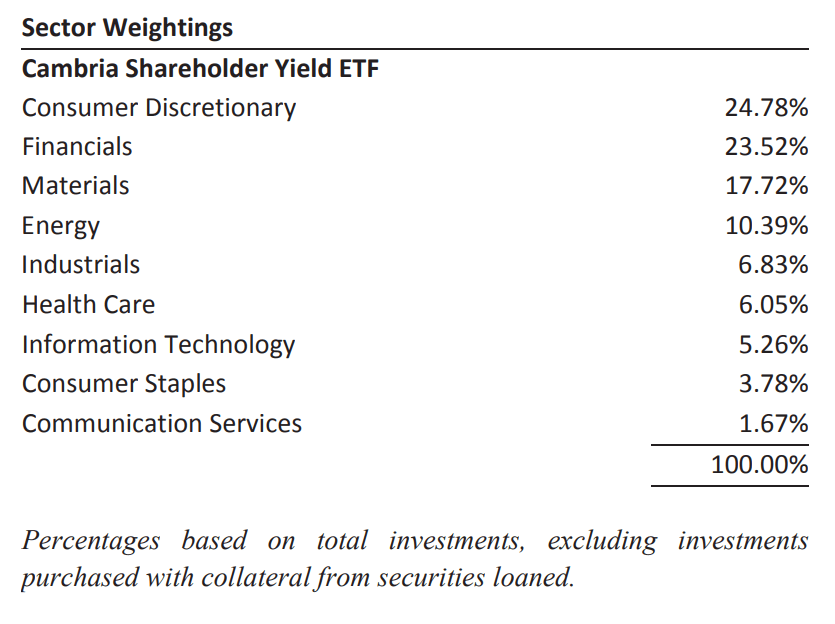
However, its overweight in the cyclical sectors is fairly constant, meaning the security selection criteria skews towards cyclicals.
Returns
The SYLD ETF has a very strong 3Yr average annual return of 35.8% p.a. to March 31, 2022 (Figure 4). Its 5Yr figure is more modest at 12.0%.
Figure 4 - SYLD historical returns (morningstar.com)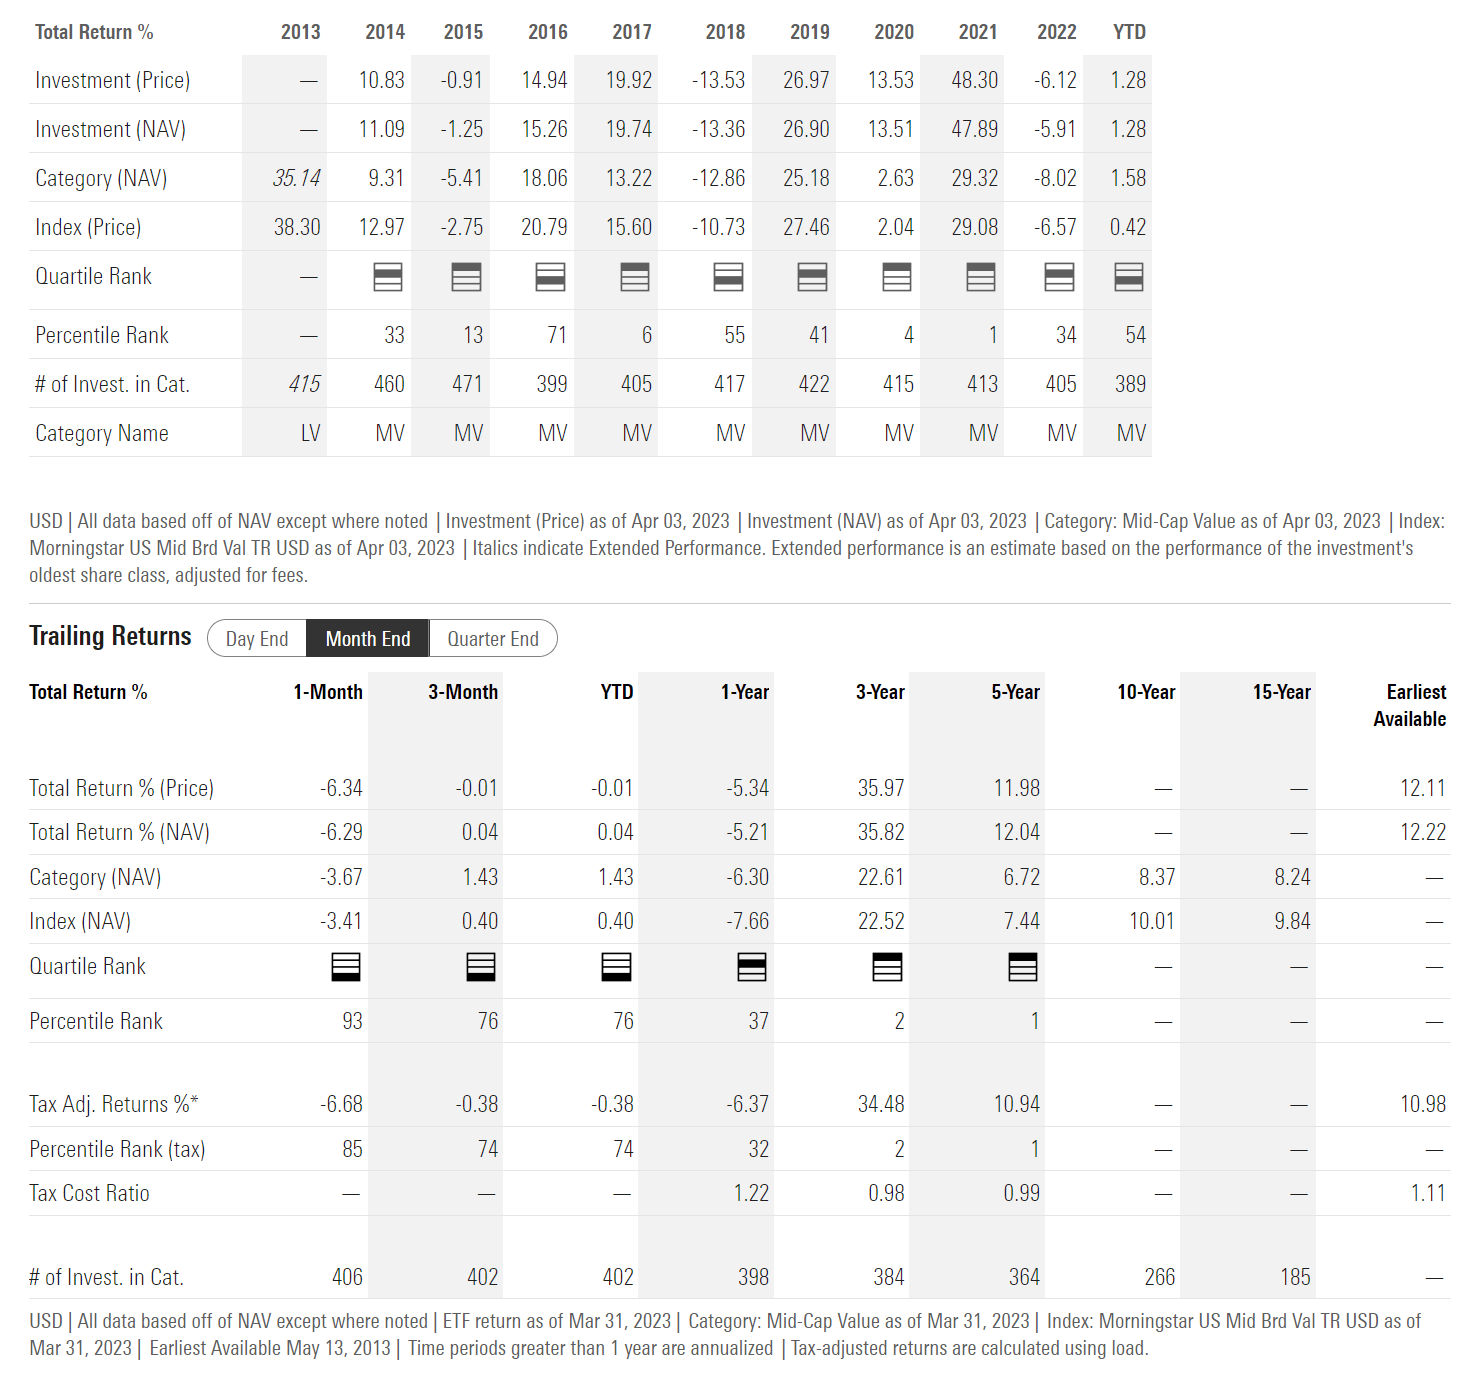
The big reason for SYLD's outperformance on a 3Yr time-horizon could be due to ETF's security selection methodology that favours cyclical/value companies and the fact that cyclical sectors like Energy and Materials suffered large declines in the early days of the COVID pandemic. This caused the subsequent rebound off of the March 2020 lows to be more dramatic for SYLD.
Figure 5 shows the historical returns of the SPY ETF for reference.
Figure 5 - SPY historical returns (morningstar.com)
Distribution & Yield
Although the SYLD ETF can invest in companies that pay high dividend yields, the SYLD ETF itself does not pay a high distribution yield. The ETF has a trailing 12 month distribution of $1.70 or 2.9% yield (Figure 6). SYLD's distribution is paid quarterly.
Figure 6 - SYLD distribution yield (Seeking Alpha)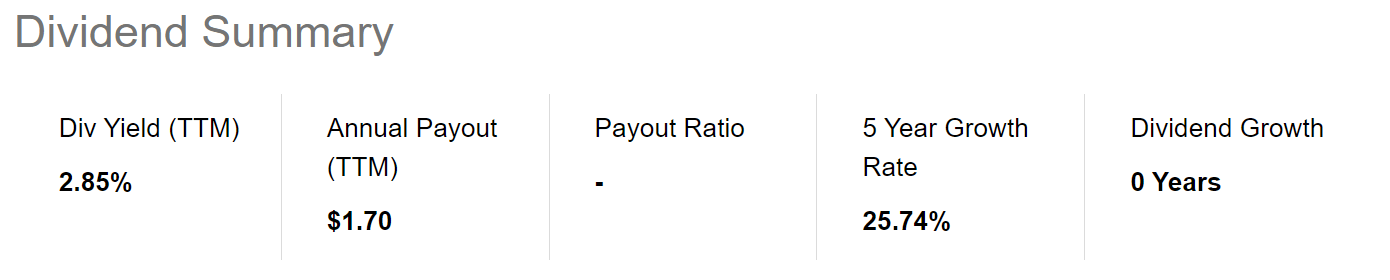
Cyclical Exposures A Key Risk In A Recession Scenario
Although the SYLD ETF has outperformed the market in the past few years, I fear its high exposure to cyclical sectors such as Energy, Materials, Financials, Consumer Discretionary and Industrials, with a combined weight of 86.8% of the fund from Figure 1, makes it vulnerable in a recession scenario.
For example, according to research from Fidelity, the cyclical sectors mentioned above tend to underperform during recessions (Figure 7).
Figure 7 - Cyclical sectors underperform during recessions (Fidelity)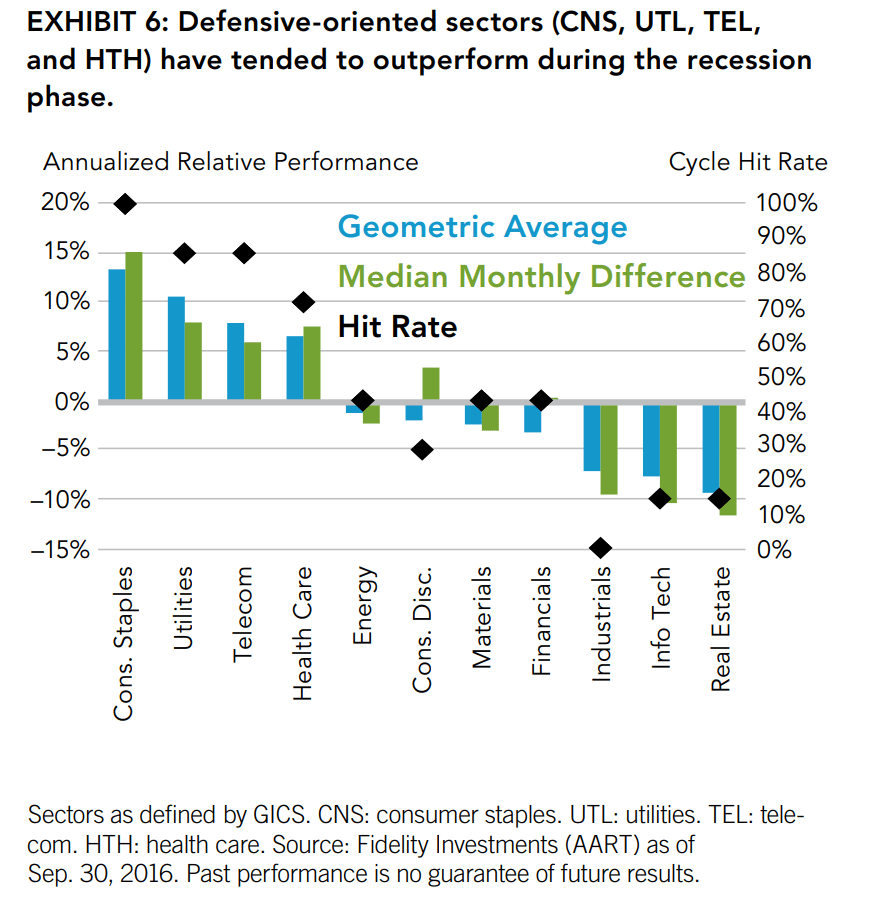
Given my view of a high probability of a U.S. recession in 2023, I recommend investors avoid funds with high cyclical exposure like the SYLD (Figure 8).
Figure 8 - High probability of a U.S. recession in 2023 (Conference Board)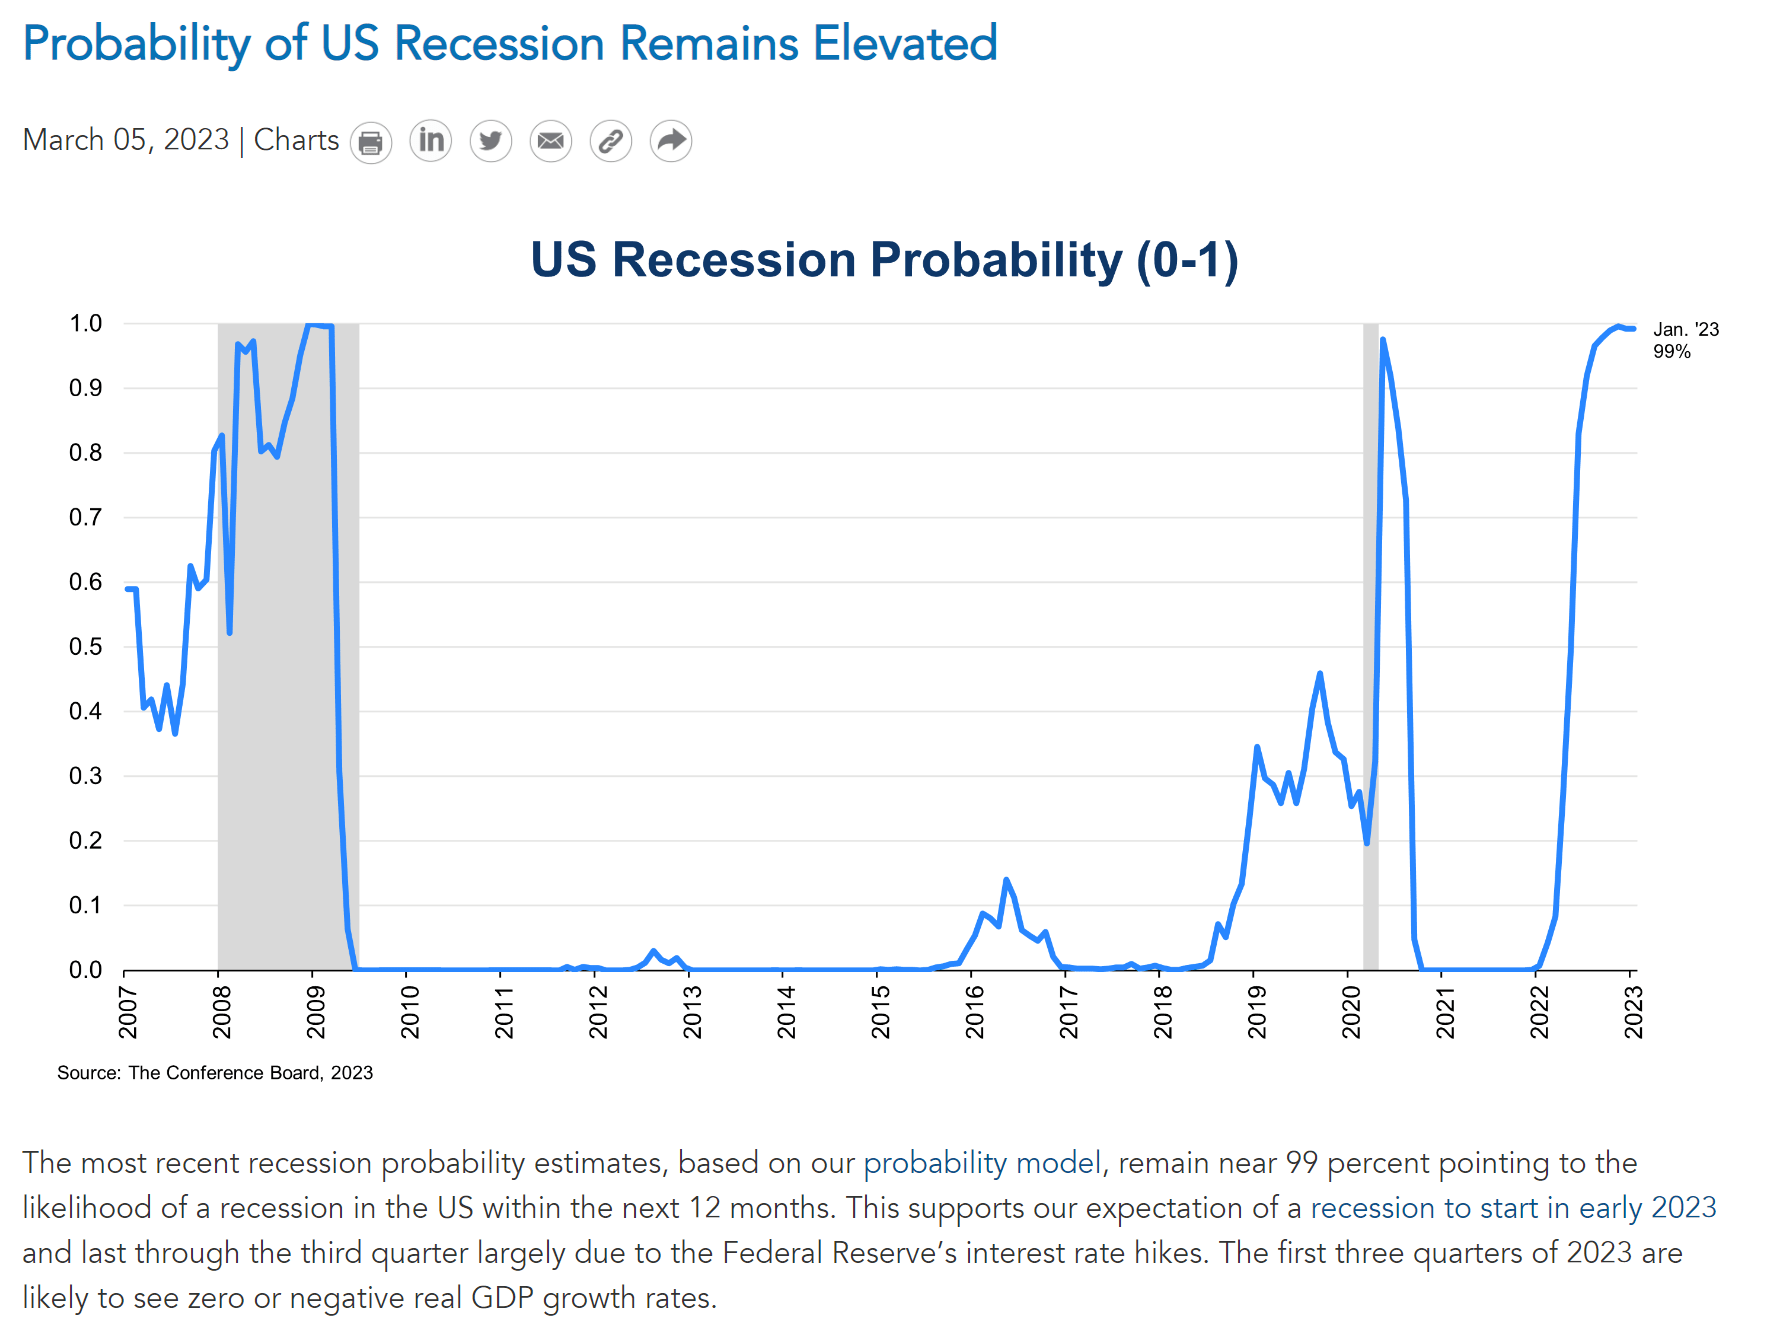
Technicals Suggest Caution
Although mathematically, the SYLD ETF has shown strong 3-Yr historical performance, the fund has actually not made much progress in the past 2 years, trading sideways in broad $52 to $65 range since early 2021 (Figure 9).
Figure 9 - SYLD has traded sideways since early 2021 (Author created with price chart from stockcharts.com)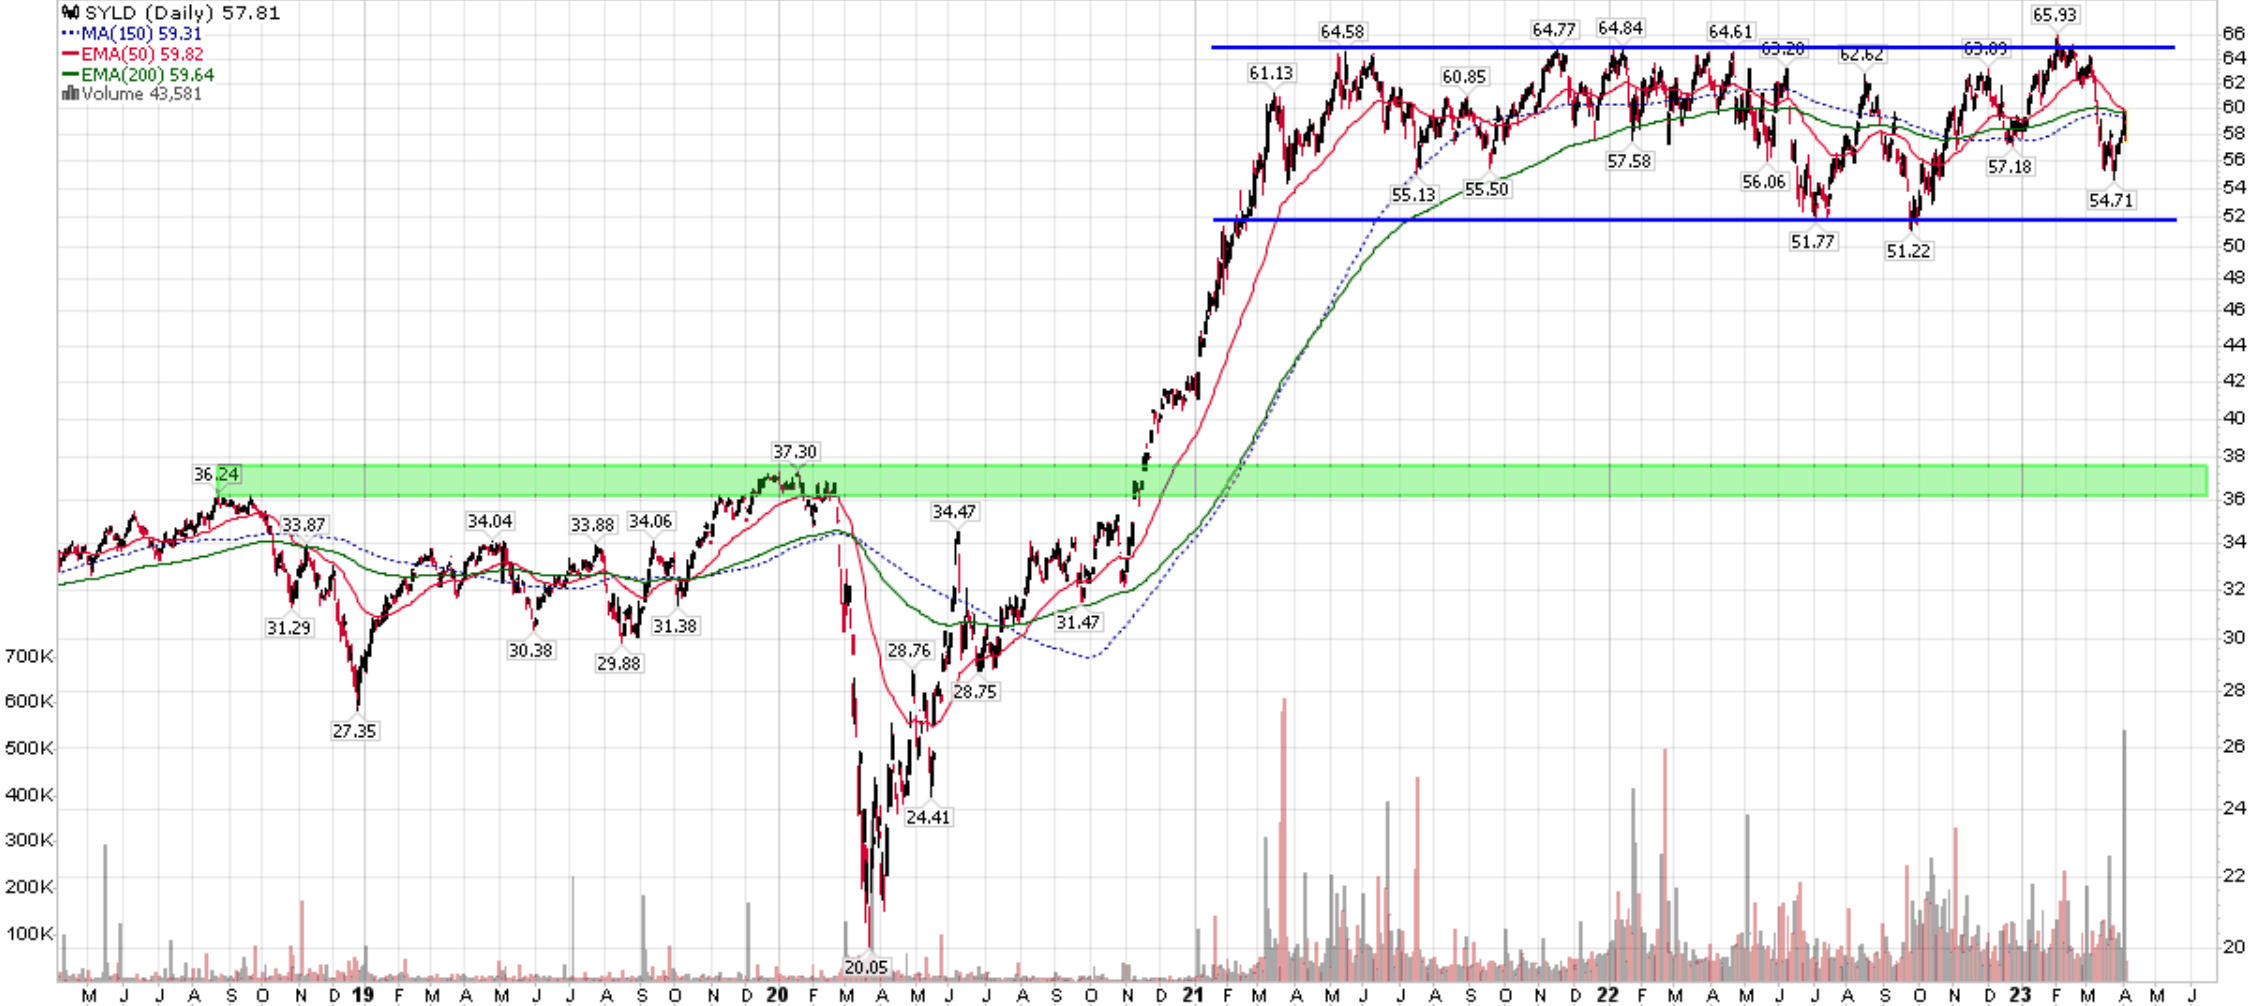
On the positive side, SYLD has held up well despite the general market downturn in 2022, declining only 5.9% vs. 18.1% for the SPY ETF. This was mostly due to the fund's high energy exposure, as the energy sector massively outperformed (Figure 10).
Figure 10 - Energy was an outperformer in 2022 (sectorspdr.com)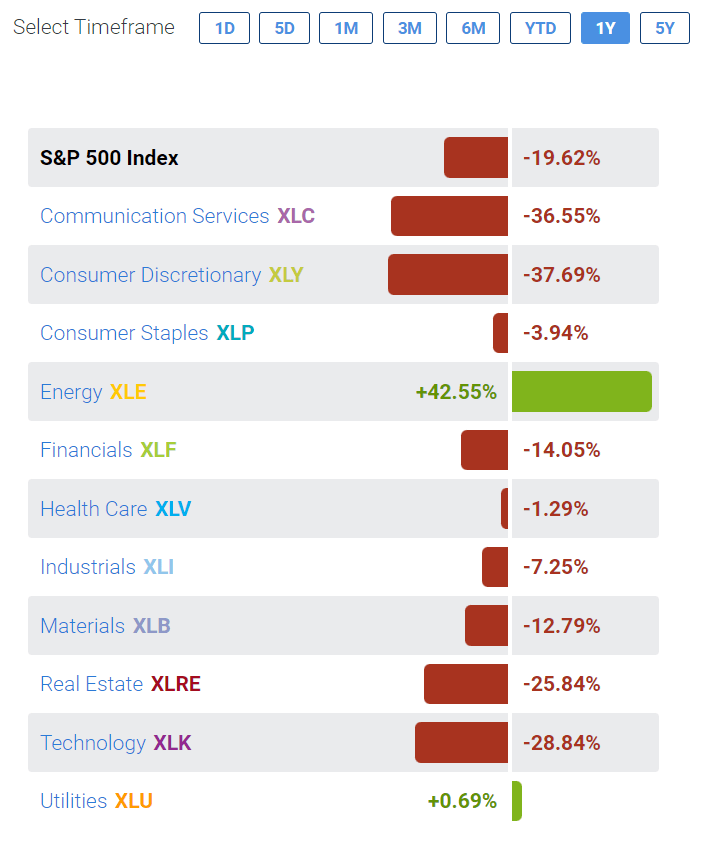
However, one can also argue that SYLD's technical picture is a 'pair of twos', neither bullish nor bearish.
Specifically, if the SYLD ETF falls below the $52 level, then it will complete a 2-year topping pattern and target downside to $36/37, the former breakout level. Alternatively, the SYLD ETF can breakout to the upside through $65, in which case it will be making new all-time highs with projection target to $78/80.
Conclusion
The Cambria Shareholder Yield ETF provides exposure to companies with high 'shareholder yields' and value characteristics. The fund's selection criteria appear to skew towards cyclical sectors such as Energy, Materials, Financials, Consumer Discretionary, and Industrials. The fund's cyclical bent allowed it to massively outperform in 2020 and early 2021. However, since then, the fund has not made much headway, generally trading in a sideways range.
Looking forward, I am worried that the SYLD's cyclical sector exposure will cause the fund to underperform in a recession scenario. I recommend investors avoid this fund for now.
This article was written by

Analyst’s Disclosure: I/we have no stock, option or similar derivative position in any of the companies mentioned, and no plans to initiate any such positions within the next 72 hours. I wrote this article myself, and it expresses my own opinions. I am not receiving compensation for it (other than from Seeking Alpha). I have no business relationship with any company whose stock is mentioned in this article.
Seeking Alpha's Disclosure: Past performance is no guarantee of future results. No recommendation or advice is being given as to whether any investment is suitable for a particular investor. Any views or opinions expressed above may not reflect those of Seeking Alpha as a whole. Seeking Alpha is not a licensed securities dealer, broker or US investment adviser or investment bank. Our analysts are third party authors that include both professional investors and individual investors who may not be licensed or certified by any institute or regulatory body.