Improving Hedged Equity With A Short-Dated Ladder

Summary
- Costless collars have become increasingly popular in recent years due to their ability to provide investors with a balanced approach to managing risk in a stock portfolio.
- One of the potential downsides of costless collars is that they are subject to path dependency risk.
- With the recent proliferation of costless collar, hedged equity, and defined outcome strategies, investors have no shortage of ways to access this type of exposure.
primeimages
Introduction
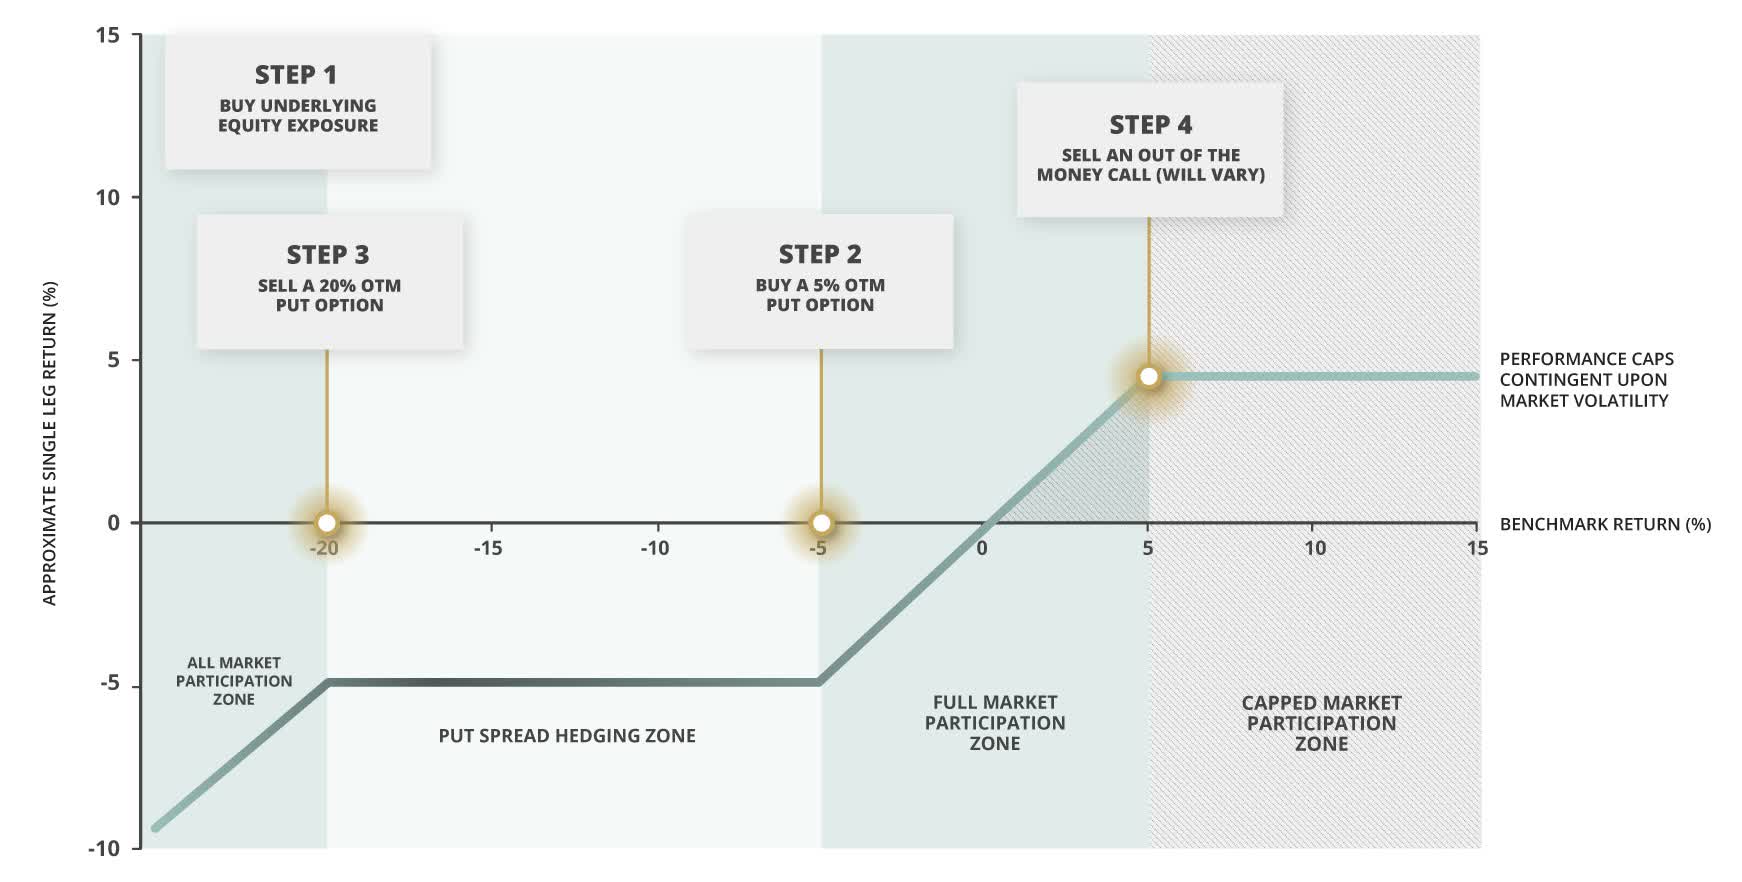
A hedged equity strategy, which sometimes referred to as a costless collar or defined outcome strategy, is a risk management profile that combines holding a long position in a stock or index with buying a put spread defined by a specific set of strikes (e.g. 5% OTM long put, 20% OTM short put). This provides downside protection for the long stock position if the stock falls within the put spread’s option strikes. The strategy finances the cost of the put spread by writing an out of the money call option with a variable strike depending on market conditions, creating a "costless" approach to balancing risk (Figure 1).
Costless collars have become increasingly popular in recent years due to their ability to provide investors with a balanced approach to managing risk in a stock portfolio. But this strategy can experience vastly different outcomes depending on the expiry of the options. In this blog, we examine the path dependency risks associated with long-term costless collar strategies and review a way to reduce these risks by laddering a series of shorter-dated collars.
Figure 1: Building a Costless Collar
Choosing Your Own Path
One of the potential downsides of costless collars is that they are subject to path dependency risk. Path dependency refers to the fact that the value of the options is dependent on the path that the underlying investment takes, often resulting in widely varied outcomes for similar strategies due to investment timing risk. This type of path dependency risk can materialize in the form of delta path dependency risk (i.e., the sensitivity to downside or upside participation) or monetization path dependency, which can result in hitting the put floor or call ceiling strikes of the collar.
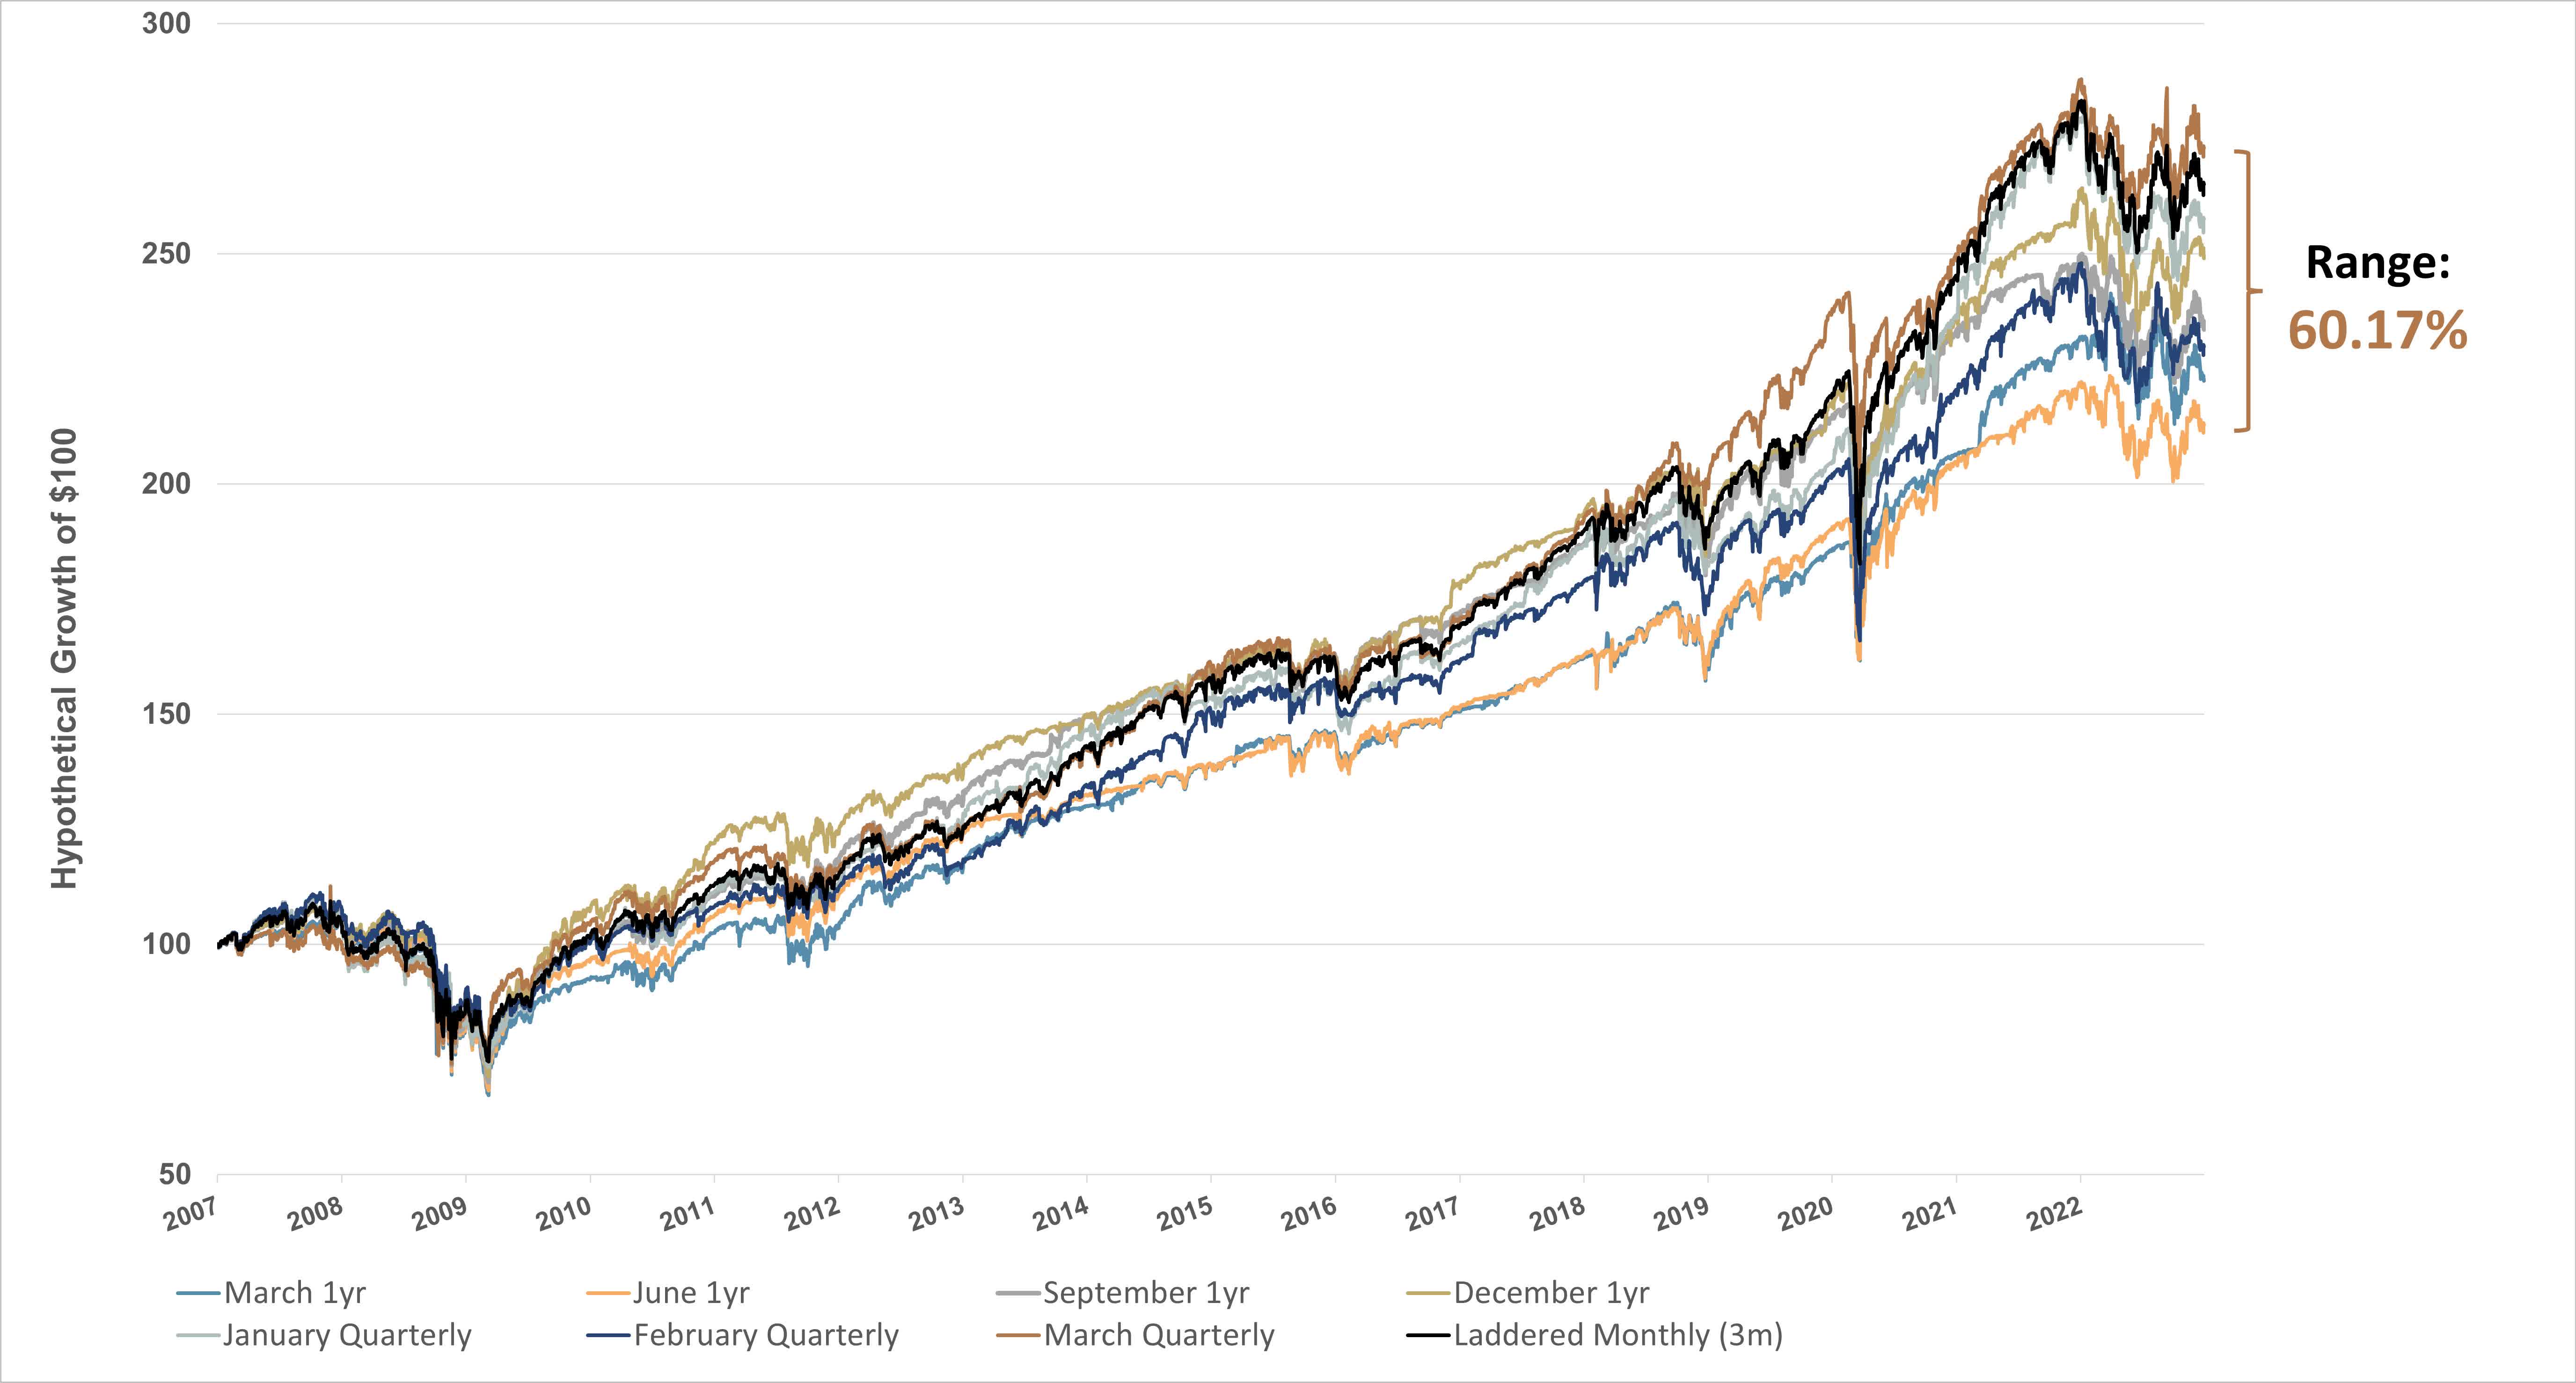
To examine these risks, we constructed four costless collar strategies on the S&P 500 Index™* (SPX) with annual resets of March, June, September, and December. Next, we added three additional strategies that increased the frequency of the collar resets to quarterly (January, February, and March starting months) to test if this would help narrow the spread between the leading and lagging costless collar strategies. In fact, the dispersion widened among the quarterly configurations despite producing, on average, better long-term cumulative returns.
Finally, we increased the frequency yet again, adding a strategy that laddered monthly collar exposures across the forward three months in an attempt to create additional path robustness. To illustrate this configuration, we began with a split exposure to January, February, and March costless collars. Upon the expiry of the January collar, we then initiated a new April position, and so on and so forth. The laddered strategy outperformed all but one (March Quarterly) of the prior annual and quarterly strategies, and posted a cumulative total return of over 165% during the assessed period, well above its peer average. Figure 2 shows the results of our study.
Figure 2: Annual vs. Quarterly vs. Laddered (3m forward, monthly)12/31/2006 – 12/31/2022
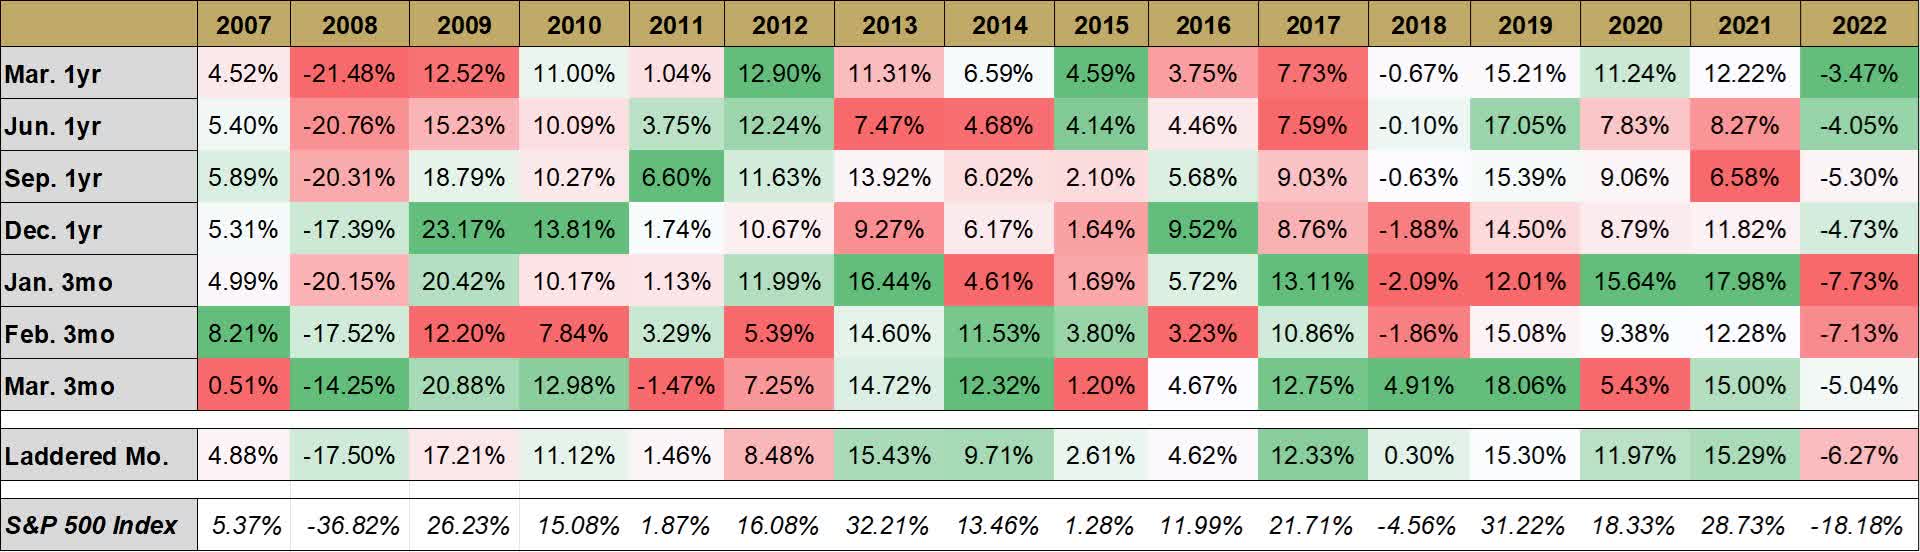
We expected the monthly strategy to be in the middle of the pack due to smoothing out random path effects, but indeed we see it performing near the top of the pack. So why the outperformance? In Figure 3, we show the calendar year returns for all hedged equity configurations, noting that the laddered monthly configuration was never the best or worst performing strategy in any single year.
Figure 3: Calendar Year Returns for Hedged Equity Configurations12/31/2006 – 12/31/2022
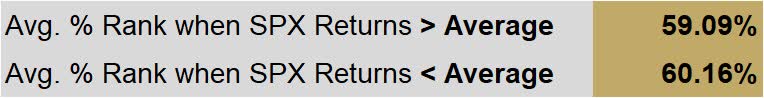
Further, the higher frequency strategy ranked in the 59th performance percentile (top half) during periods when SPX outperformed its historical quarterly return average. It also produced a similarly impressive percentile ranking of 60.16% during below average return periods, as shown in Figure 4. We attribute this success to the increased rebalance frequency of the collars, allowing for a higher probability of resetting both upside and downside strikes to capture modest yet statistically significant relative wins that compound over time.
Figure 4: Performance Percentile Rankings for Laddered Monthly Configuration12/31/2006 – 12/31/2022
Conclusion
With the recent proliferation of costless collar, hedged equity, and defined outcome strategies, investors have no shortage of ways to access this type of exposure. Choosing the wrong configuration can have serious long-term consequences. Despite downside protection often being the focus of a costless collar strategy, the ability to mitigate path risk in both upside call strikes and downside put strikes appears to be the key to producing long-term relative success.We have shown that investors should strongly consider the path risks associated with longer-term option strikes and use shorter-term resets with laddered collar positions to mitigate selection risk and the opportunity cost associated with it.
*Disclaimer: Standard & Poor’s 500 Composite IndexSM and S&P 500® are service/trademarks owned by The McGraw-Hill Companies, Inc.
Simplify Asset Management Inc. is a Registered Investment Adviser. Advisory services are only offered to clients or prospective clients where Simplify Asset Management Inc. and its representatives are properly licensed or exempt from licensure. SEC registration does not constitute an endorsement of the firm by the Commission, nor does it indicate that the advisor has attained a particular level of skill or ability. Be sure to first consult with a qualified financial adviser and/or tax professional before implementing any strategy. This website and information are not intended to provide investment, tax, or legal advice.
This website is solely for informational purposes and does not intend to make an offer or solicitation for the sale or purchase of any specific securities, investments, or investment strategies. These materials are made available on an “as is” basis, without representation or warranty. The information contained in these materials has been obtained from sources that Simplify Asset Management Inc. believes to be reliable, but accuracy and completeness are not guaranteed. This information is only current as of the date indicated, and may be superseded by subsequent market events or for other reasons. Neither the author nor Simplify Asset Management Inc. undertakes to advise you of any changes in the views expressed herein.
Past performance is no guarantee of future returns. Investing involves risk and possible loss of principal capital.
Unless otherwise noted, any performance returns presented in these materials reflect hypothetical performance. Hypothetical strategies and indices presented are unmanaged, do not reflect any fees, expenses, transaction costs, commissions or taxes, and one cannot invest directly in any of these. The results presented should not be viewed as indicative of the adviser’ skill and do not reflect the performance results that were achieved by any particular client. During this period, the adviser was not providing advice using this model and clients’ results may have been materially different. Hypothetical model results have many inherent limitations, some of which, but not all, are described herein. One of the limitations of hypothetical performance results is that they are generally prepared with the benefit of hindsight. In addition, hypothetical trading does not involve financial risk, and no hypothetical trading record can completely account for the impact of financial risk in actual trading.
Editor's Note: The summary bullets for this article were chosen by Seeking Alpha editors.
This article was written by
