Monster Beverage: A Brief Look At Profitability And Efficiency

Summary
- While the firm's net profit margin is above average, it has been declining gradually over the past two years.
- MNST's asset turnover has been also declining since mid-2020, mainly driven by the increasing inventory and accounts receivable levels.
- The low debt levels in the capital structure may enable the firm to have more financial flexibility, which is definitely a plus in the current challenging macroeconomic environment.
- The firm appears to be trading at a premium compared to the consumer staples sector, to the firm's direct peers and competitors and also compared to its own 5Y historic averages.
- For these reasons, we rate MNST stock as a "hold" now.
Jack Taylor
Monster Beverage Corporation, (NASDAQ:MNST) through its subsidiaries, engages in development, marketing, sale, and distribution of energy drink beverages and concentrates in the United States and internationally.
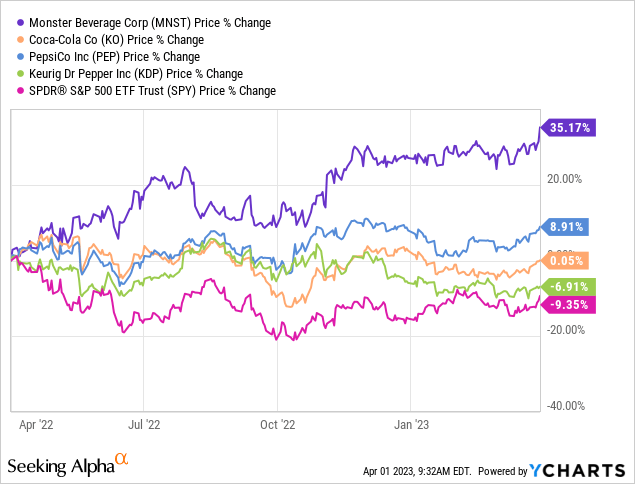
Over the past twelve months, despite the challenging macroeconomic environment, MNST has significantly outperformed its peers and the broader market as well. In this time period, the stock price has increased by as much as 35%, in contrast to the more than 9% decline of the broader market.
In today's article, we are going to take a look at three measures, which could give us an insight into the firm's profitability and efficiency. We will be looking at this parameters and try to use them to explain the reason for the outperformance in the past year, as well as to gauge whether this outperformance is likely to last or not. Last, but not least, we will take a look at the valuation of the stock, based on a set of traditional price multiples.
Net profit margin
We will start our analysis with the net profit margin, which is a widely used ratio to gauge the profitability of a firm.
The following chart shows Monster's net profit margin over the past 5 years.
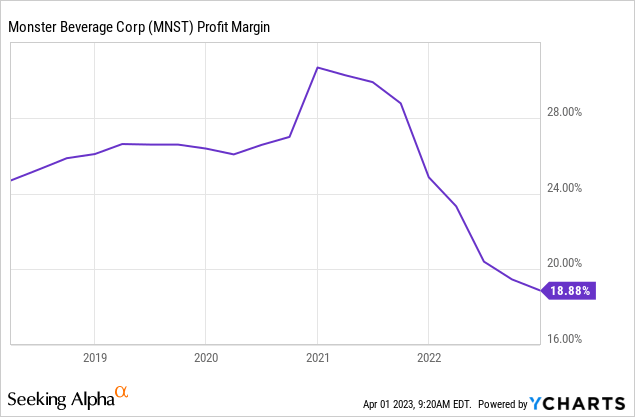
While initially we see a slight improvement of the profitability, from 2021 onwards, the ratio has been gradually declining. On one hand, it may look concerning, but in order to fully understand how alarming this might actually be, we have to compare the ratio to those of the company's peers and competitors.
Comparison (Seeking Alpha)
While the net profit margin is lower than Coca-Cola's (KO), it compares favourably with PepsiCo's (PEP) and Keurig Dr Pepper's (KDP) figures.
We also have not note that the median net profit margin in the consumer staples sector is only about 3.8%, significantly below MNST's figure.
The gradual decline in the profitability is also not something surprising in the current macroeconomic environment. Elevated inflation levels, high energy prices, high transportation costs, geopolitical tensions in several parts of the world have all been having an impact not only on MNST's profitability, but on the profitability of many firms. Looking forward, we expect these headwinds to ease and eventually positively impact MNST's financial performance in the future. We expect this improvement to be gradual, and starting not earlier than the second half of this year.
All in all, if an investor is looking for a highly profitable company in the consumer staples space, Monster is definitely a firm to consider, despite the recent deterioration of the profit margin.
Asset turnover
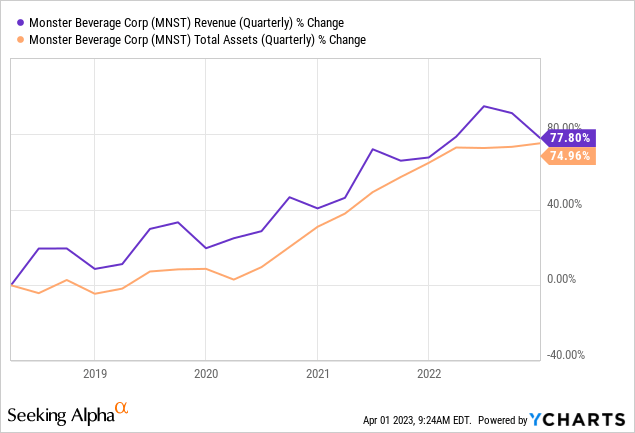
Asset turnover is a ratio, or a measure, indicating the efficiency of a company. It shows, how efficiently a company is able to use its asset to generate sales. Normally, we prefer companies that have stable or improving asset turnover ratio. The following chart shows MNST's asset turnover.

The faster increase of the total assets compared to revenue from 2020 onwards can explain this decline.
At this point, we have to understand, what factors have been contributing to the faster increase of the total assets. Both inventory and account receivables in the past 2 years have been increasing faster than revenue.
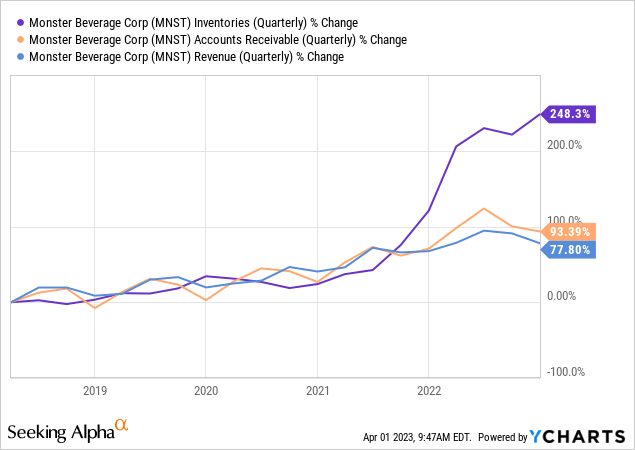
From our perspective, we find this a bit concerning. We would like to see inventory levels decreasing, and growth in accounts receivable slowing. If receivables are growing at a faster pace than revenue, it may be an indication that the firm is selling more on credit, and potentially, pulling demand forward from future periods.
For these reasons, from an efficiency point of view, we are not too excited about investing in MNST's stock.
Equity multiplier
This measure indicates, how much of the firm's total assets are supported by equity. A ratio close to one indicates that there is little debt in the capital structure.
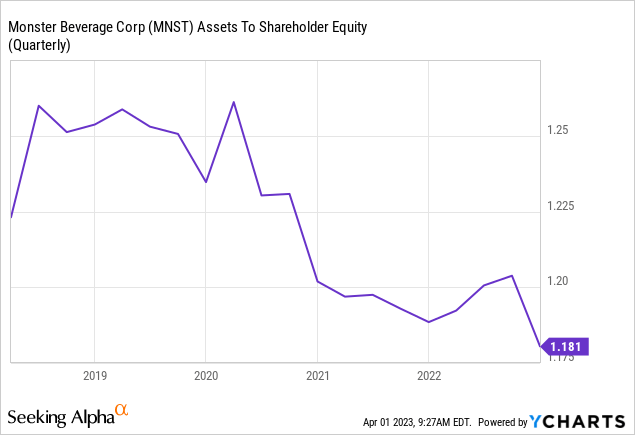
In fact, when we compare MNST's debt levels to its peers and competitors, we can see the MNST's figures are significantly lower. In a challenging macroeconomic environment, with rising interest rates, low debt levels could be very helpful, as it could provide financial flexibility to the firm. which other firm's with high debt levels may not have.
Comparison (Seeking Alpha)
Also encouraging that the firm's current liabilities are also well covered. Normally, current- and quick ratios above 1 are a good indication that the firm has enough liquidity to meet its short term financial obligations. MNST's liquidity ratios are far above those of its competitors and have been increasing over the past 5 years.
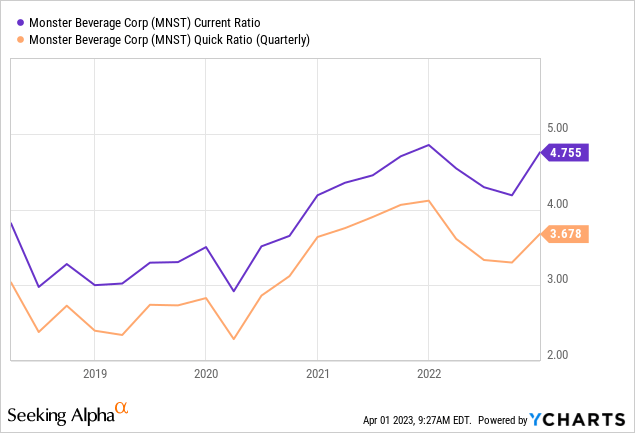
For these reasons, we believe that from a liquidity perspective MNST could be a safe choice for investors.
Valuation
The question that we need to answer now is: How much should we pay for MNST's stock?
The following table compares a set of traditional price multiples across several firms in the consumer staples sector. Based on these multiples MNST appears to be the most expensive.
Comparison (Seeking Alpha)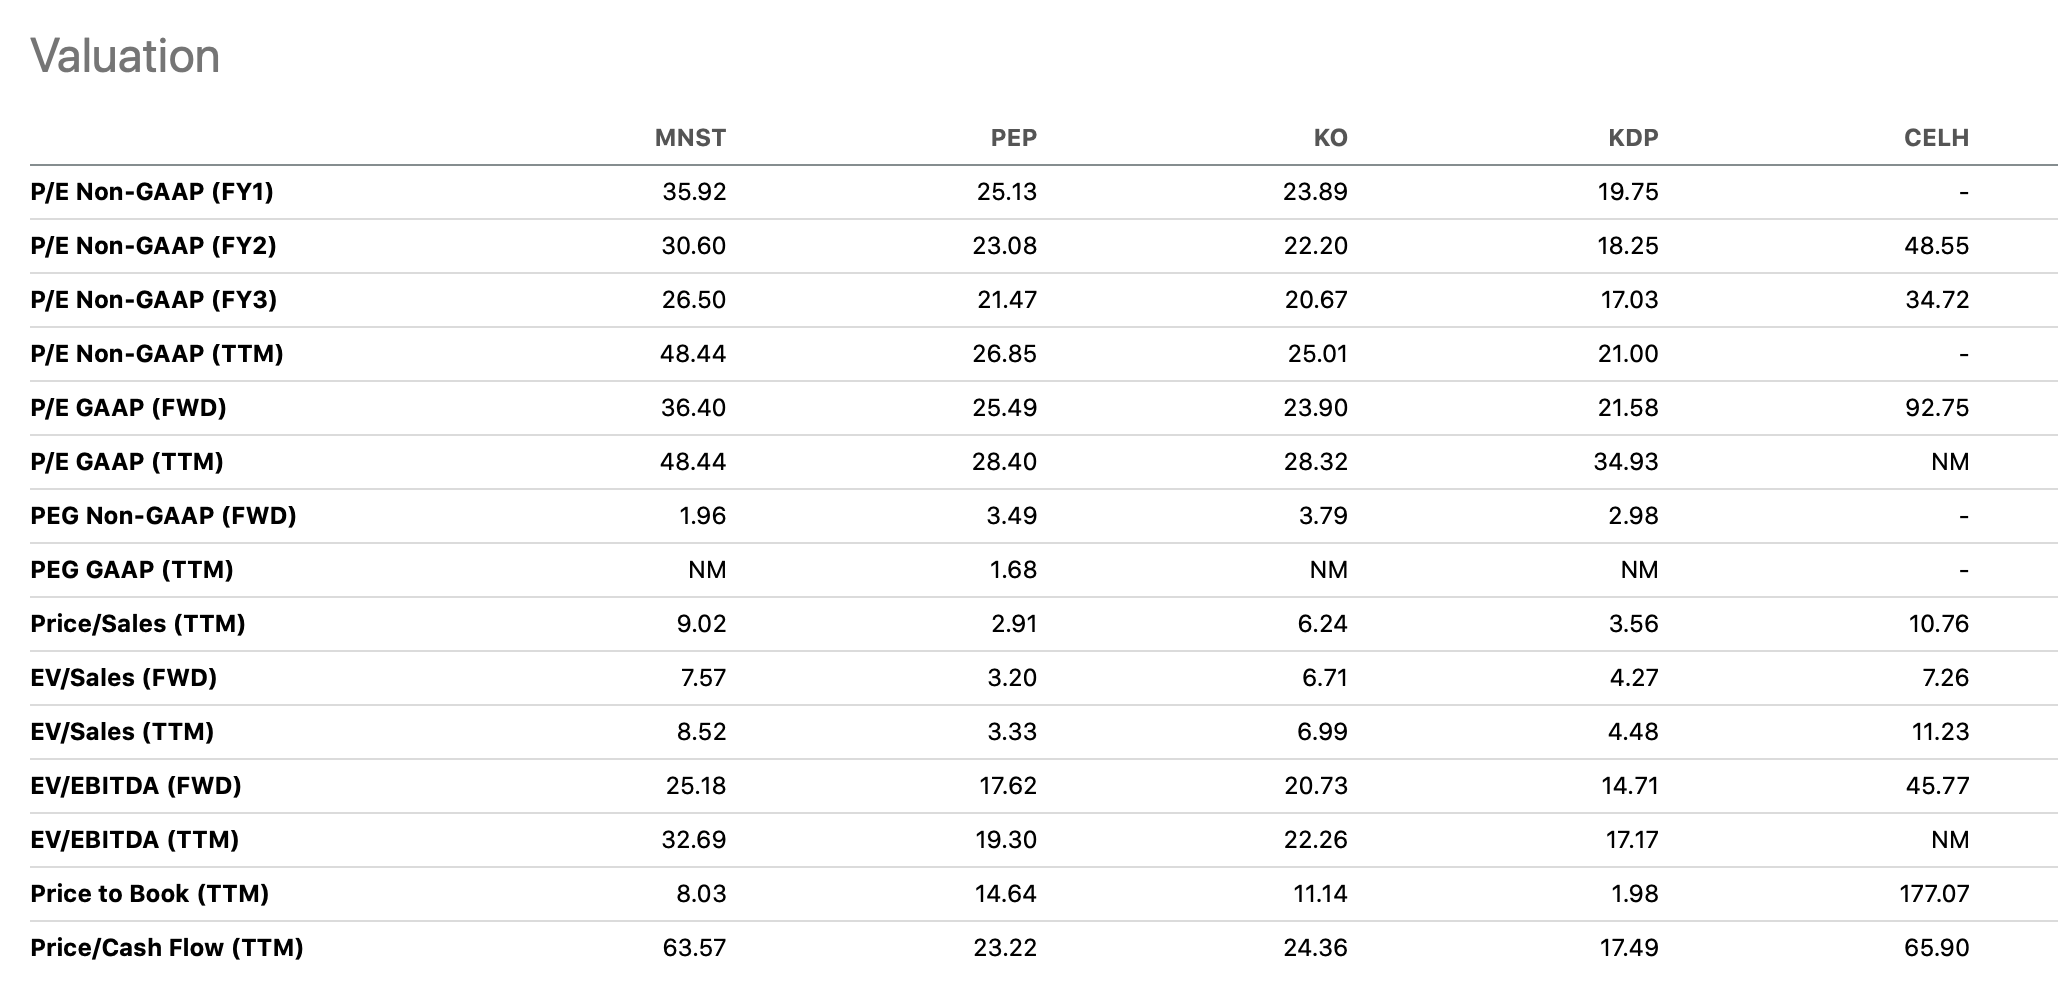
Is this premium justified? The high profitability, despite the recent decline, and the low leverage are definitely good signs. On the other hand, the rapidly increasing inventory levels, couples with the increase in accounts receivable are not so appealing. While Monster has been also trading at a premium in the past, currently most of the price multiples are also above the firm's own 5Y historic averages.
Valuation metrics (Seeking Alpha)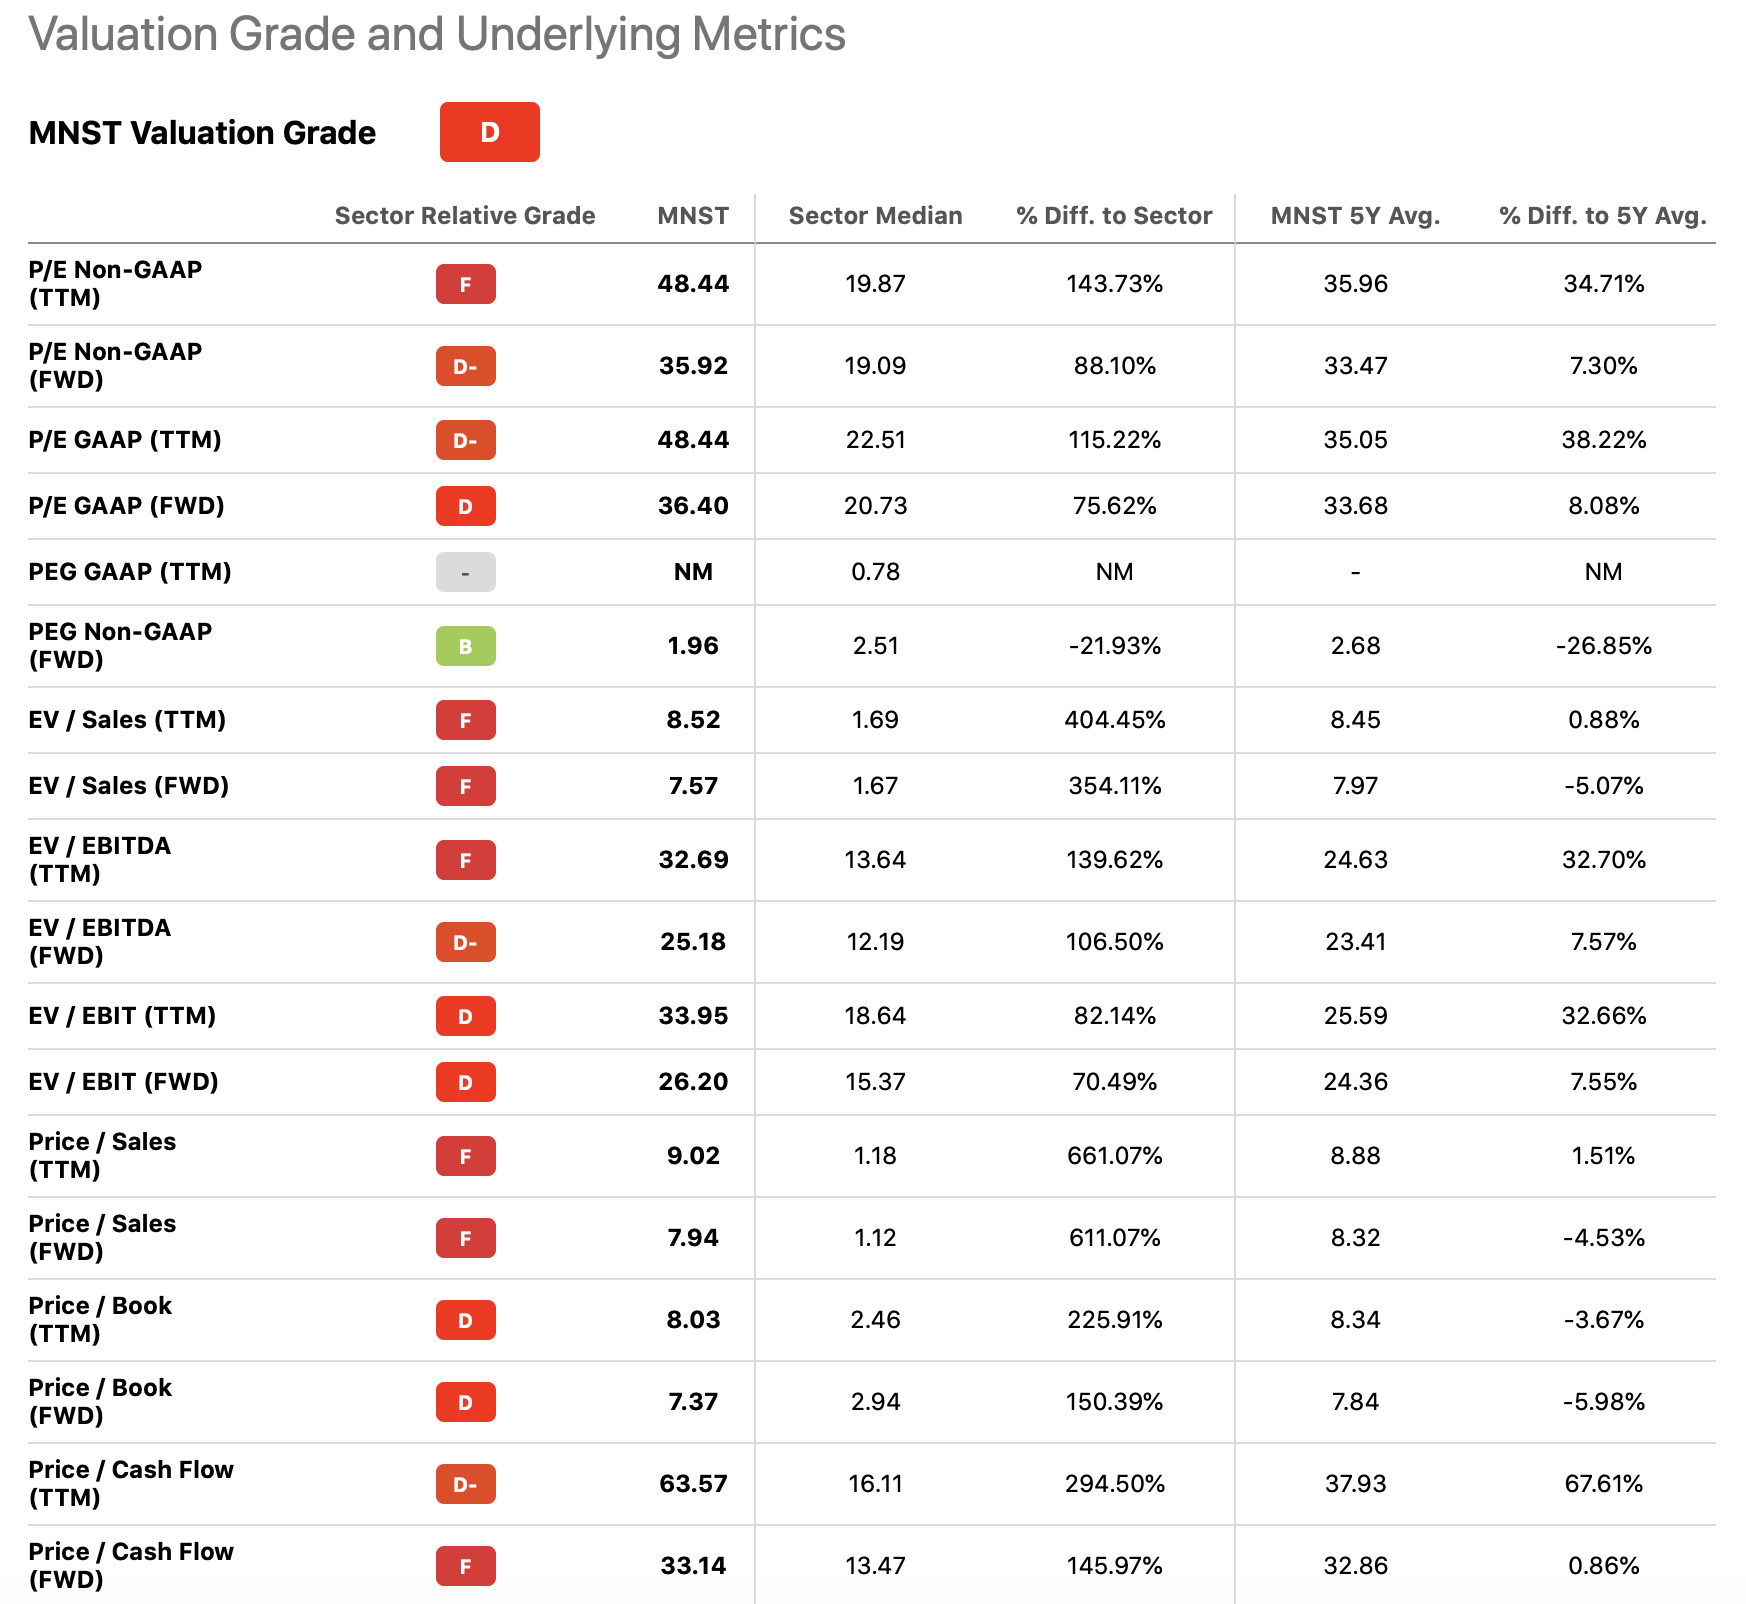
For all these reasons, including the challenging macroeconomic environment, the apparent overvaluation based on the price multiples, the declining efficiency, the above-average profitability, and the low debt in the capital structure, we currently value MNST's stock as a "hold".
To update our view to a buy, we would like to first see a trend change in the profitability and a trend change in the asset turnover. An improving macroeconomic environment could be the catalyst for such changes.
This article was written by

Disclosure: I/we have no stock, option or similar derivative position in any of the companies mentioned, and no plans to initiate any such positions within the next 72 hours. I wrote this article myself, and it expresses my own opinions. I am not receiving compensation for it (other than from Seeking Alpha). I have no business relationship with any company whose stock is mentioned in this article.
Additional disclosure: Past performance is not an indicator of future performance. This post is illustrative and educational and is not a specific offer of products or services or financial advice. Information in this article is not an offer to buy or sell, or a solicitation of any offer to buy or sell the securities mentioned herein. Information presented is believed to be factual and up-to-date, but we do not guarantee its accuracy and it should not be regarded as a complete analysis of the subjects discussed. Expressions of opinion reflect the judgment of the authors as of the date of publication and are subject to change. This article has been co-authored by Mark Lakos.