CGDV: Underperformed Since Previous Note, Valuation Risks In Place, Rating Maintained

Summary
- CGDV is a relatively novel actively managed fund targeting attractively priced stocks capable of returning cash to shareholders via dividends (or having a potential to do so).
- The article addresses the portfolio changes since January and the factor exposure of the current version, with attention paid to the value, quality characteristics, and the sector mix.
- I again struggle to find a strong reason to assign it a Buy rating as its valuation characteristics leave a lot to be desired, at least for my taste.
FilippoBacci
Capital Group Dividend Value ETF (NYSEARCA:CGDV) is a relatively novel actively managed fund targeting attractively priced stocks capable of returning cash to shareholders via dividends (or having a potential to do so).
According to its website, the exact objectives are as follows:
The fund's investment objectives are to produce income exceeding the average yield on U.S. stocks generally and to provide an opportunity for growth of principal consistent with sound common stock investing.
In the prospectus, it is said that CGDV "normally... invests at least 80% of its assets in dividend-paying common stocks of larger, more established companies domiciled in the United States with market capitalizations greater than $4.0 billion," though up to a tenth may be allocated to "equity securities of larger companies domiciled outside the United States," which, in my view, obviously adds an FX risk to the strategy. A nice example of a non-U.S. stock to mention here is London-quoted British American Tobacco p.l.c. (BTI) (LSE ticker BATS). Another is Linde plc (LIN), a UK-based industrial gas market leader; nuance here is that it no longer has a Frankfurt listing after the reorganization, so CGDV holds NYSE-quoted shares.
The previous time I covered CGDV was in January, when I struggled to find a meaningful reason for a Buy rating mostly as its value exposure did not appeal to me despite quality being nothing short of robust. Since that note, CGDV has failed to outperform the S&P 500.
Seeking Alpha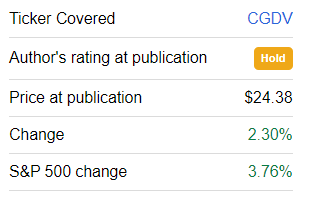
Today, I would like to take a closer look at the changes the portfolio has undergone since then to check whether the balance of factors is supportive of a bullish view now.
Addressing factor exposure
For that purpose, I would like to stick to the algorithm I mostly use in my regular assessment of exchange-traded funds, focusing on their value and quality characteristics. For the value part, this is done primarily by looking at the Seeking Alpha Quant Valuation grade, though at times I also love to delve a bit deeper and check weighted-average metrics (mostly computed by myself, with exceptions sometimes) like the earnings yield and its debt-adjusted analog, sales-to-price ratio, free cash flow multiple, and the list goes on, taken in isolation, with the set of metrics tailored with a particular fund's sector exposure in mind. For the quality part, the Profitability grade is used, while other parameters like the ROE/ROA spread might be considered for a better understanding of the balance sheet risk exposure, etc.
Let me start with value. A few of my dear readers might note here that I am a bit too zealous when it comes to value exposure, especially considering bulls are once again attempting a rematch. I should concur here, but there is a reason for that. With interest rate increases most likely to continue and a recession being the primary risk, I believe it is best to navigate this bear market with a strong margin of safety to prepare for all possible scenarios, the abysmal ones included. That is why I check whether an ETF has a balanced mix of adequately priced, self-sufficient companies.
So did CGDV become cheaper? First and foremost, though being actively managed, the fund makes only minor changes to the portfolio over time, with a turnover of just 3%. Comparing the most recent holdings with the January portfolio, I noticed that CGDV has added just five stocks (about 3% combined weight) and removed precisely the same amount since then. The additions I spotted are as follows:
- Intel (INTC), 0.7% weight,
- Stanley Black & Decker (SWK), 0.6%,
- Stryker (SYK), 0.6%,
- Boeing (BA), 0.6%,
- Amazon.com (AMZN), 0.5%.
An important note is that even though BA and AMZN do not return cash to shareholders via dividends, their presence in the portfolio is consistent with the fund's strategy which shows the green light to companies that "have the potential" to do so.
The following names were removed:
With the additions having just 3% weight in the current iteration, this tiny adjustment has obviously not resulted in a profound shift in valuation. I have created the following table for better context on that matter, with a few quality indicators also added.
| Metric (weighted-average, except for relatively under- and overvalued) | January | March |
| Market Capitalization | $241 million | $283.7 million |
| Earnings Yield | 5.66% | 5.68% |
| Price/Sales | 3.46x | 3.59x |
| Fwd EPS | 32.3% | 7.33% |
| Fwd Revenue | 8.26% | 5.68% |
| Return on Equity | 24.87% | 24.31% |
| Return on Assets | 8.82% | 8.81% |
| Fwd Dividend Yield | 2.4% | 2.43% |
| Relatively Overvalued (D+ Quant Valuation grade and lower) | 56% | 54.3% |
| Relatively Undervalued (B- Quant grade and higher) | 18% | 15.3% |
| Top Quality (B- and higher) | 89.9% | 89% |
| Low Quality (D+ and lower) | 0.8% | 1.5% |
Computed using data downloaded from Seeking Alpha and the fund
Let me discuss these data in greater depth:
- The weighted-average market cap did climb higher, though mostly as a consequence of AMZN added.
- Meanwhile, the earnings yield was almost static, P/S rose marginally.
- Perhaps, the most notable development is the phenomenal compression of the weighted-average forward EPS growth rate from about 32.4% to only 7.3%, which looks barely supportive of a 17.5x Price/Earnings. In my previous article, I clarified that this growth rate was principally driven by a few outliers like Baker Hughes (BKR), with their rates bolstered by one-off effects. So, as they declined, so did the weighted-average figure.
- The forward revenue growth rate became even bleaker, declining to ~5.7%.
- The WA forward dividend yield is at 2.4%, which is consistent with the fund pursuing a market-leading yield. For context, the S&P 500's DY is 1.69% as illustrated by the data on the SPDR Portfolio S&P 500 ETF (SPLG) website. A minor remark here is that this level was achieved due to a few tobacco industry high-yielders like Altria (MO), Philip Morris (PM), and BTI, which mitigated the impact of eight zero-yield stocks (~9.2% weight) like BA, TopBuild (BLD), etc., on the weighted-average result.
- Overall, the proportion of over- and undervalued companies in this equity mix still does not appeal to me.
It is also of note that with the changes being mostly small, there are no meaningful shifts in sector exposure either. Industrials (20.8%), IT (14.9%), and healthcare (14.3%) retained their leading positions.
Final thoughts
It should be noted that in terms of returns, this novel vehicle incepted in February 2022 has already demonstrated a capability to perform relatively strongly during the bear market as illustrated by the CAGR delivered during the March 2022 - March 2023 period, compared to the iShares Core S&P 500 ETF (IVV), Global X S&P 500 Quality Dividend ETF (QDIV), Schwab U.S. Dividend Equity ETF (SCHD), and SPDR Portfolio S&P 500 High Dividend ETF (SPYD).
| Portfolio | IVV | CGDV | QDIV | SCHD | SPYD |
| Initial Balance | $10,000 | $10,000 | $10,000 | $10,000 | $10,000 |
| Final Balance | $9,560 | $10,099 | $9,843 | $9,909 | $9,436 |
| CAGR | -4.07% | 0.92% | -1.45% | -0.84% | -5.21% |
| Stdev | 23.21% | 22.12% | 22.17% | 19.56% | 22.85% |
| Best Year | 7.44% | 6.11% | 1.00% | 1.45% | -2.76% |
| Worst Year | -11.02% | -4.83% | -2.55% | -2.33% | -2.96% |
| Max. Drawdown | -20.28% | -20.50% | -16.50% | -14.18% | -18.73% |
| Sharpe Ratio | -0.19 | 0.02 | -0.09 | -0.09 | -0.25 |
| Sortino Ratio | -0.26 | 0.03 | -0.12 | -0.14 | -0.34 |
| Market Correlation | 1 | 0.94 | 0.91 | 0.87 | 0.85 |
Created by the author using data from Portfolio Visualizer
The verdict? Despite the mostly attractive performance over that short period, and the fact that I still like CGDV's quality exposure, I again struggle to find a strong reason to assign it a Buy rating as its valuation characteristics leave a lot to be desired, at least for my taste.
This article was written by

Analyst’s Disclosure: I/we have no stock, option or similar derivative position in any of the companies mentioned, and no plans to initiate any such positions within the next 72 hours. I wrote this article myself, and it expresses my own opinions. I am not receiving compensation for it (other than from Seeking Alpha). I have no business relationship with any company whose stock is mentioned in this article.
Seeking Alpha's Disclosure: Past performance is no guarantee of future results. No recommendation or advice is being given as to whether any investment is suitable for a particular investor. Any views or opinions expressed above may not reflect those of Seeking Alpha as a whole. Seeking Alpha is not a licensed securities dealer, broker or US investment adviser or investment bank. Our analysts are third party authors that include both professional investors and individual investors who may not be licensed or certified by any institute or regulatory body.