Medical Properties Trust: Bears Won Decisively, Buyers Need To Emerge From Hiding

Summary
- Investors in Medical Properties Trust were stunned by a massive downdraft since early March as bearish investors intensified their attack.
- The banking crisis likely provided the fuel for these investors to pile on their bets. Also, dip buyers probably fled in droves as they expected the banking crisis to worsen.
- We discuss why the bears have won the recent battle against the dip buyers since October. However, a new defense line has been drawn for buyers to return.
- MPW's valuation has likely priced in a dividend cut as investors assess the risks to the REIT's NFFO per share guidance.
- High-conviction investors should find the new defense line attractive to add exposure, which could compel further short-covering, lifting buying sentiments.
- I do much more than just articles at Ultimate Growth Investing: Members get access to model portfolios, regular updates, a chat room, and more. Learn More »
MichaelBlackburn
Medical Properties Trust, Inc. or MPT (NYSE:MPW) investors were given a rude awakening as the bearish thesis intensified in early March, coinciding with the fallout over the collapse of Silicon Valley Bank or SVB (OTC:SIVBQ) and Signature Bank (OTC:SBNY).
We observed buyers returning to stem further downside in October and December 2022. However, there were some concerns after a bull trap or false upside breakout in late January. The subsequent selloff coincided with additional concerns over Prospect Medical Holdings in February.
However, buyers returned in late February, committed to bolstering the defense line dip buyers had established in October and December. However, the failure of SVB opened up another steep decline in early March and overran these dip buyers quickly.
MPW short interest as a % of shares outstanding (koyfin)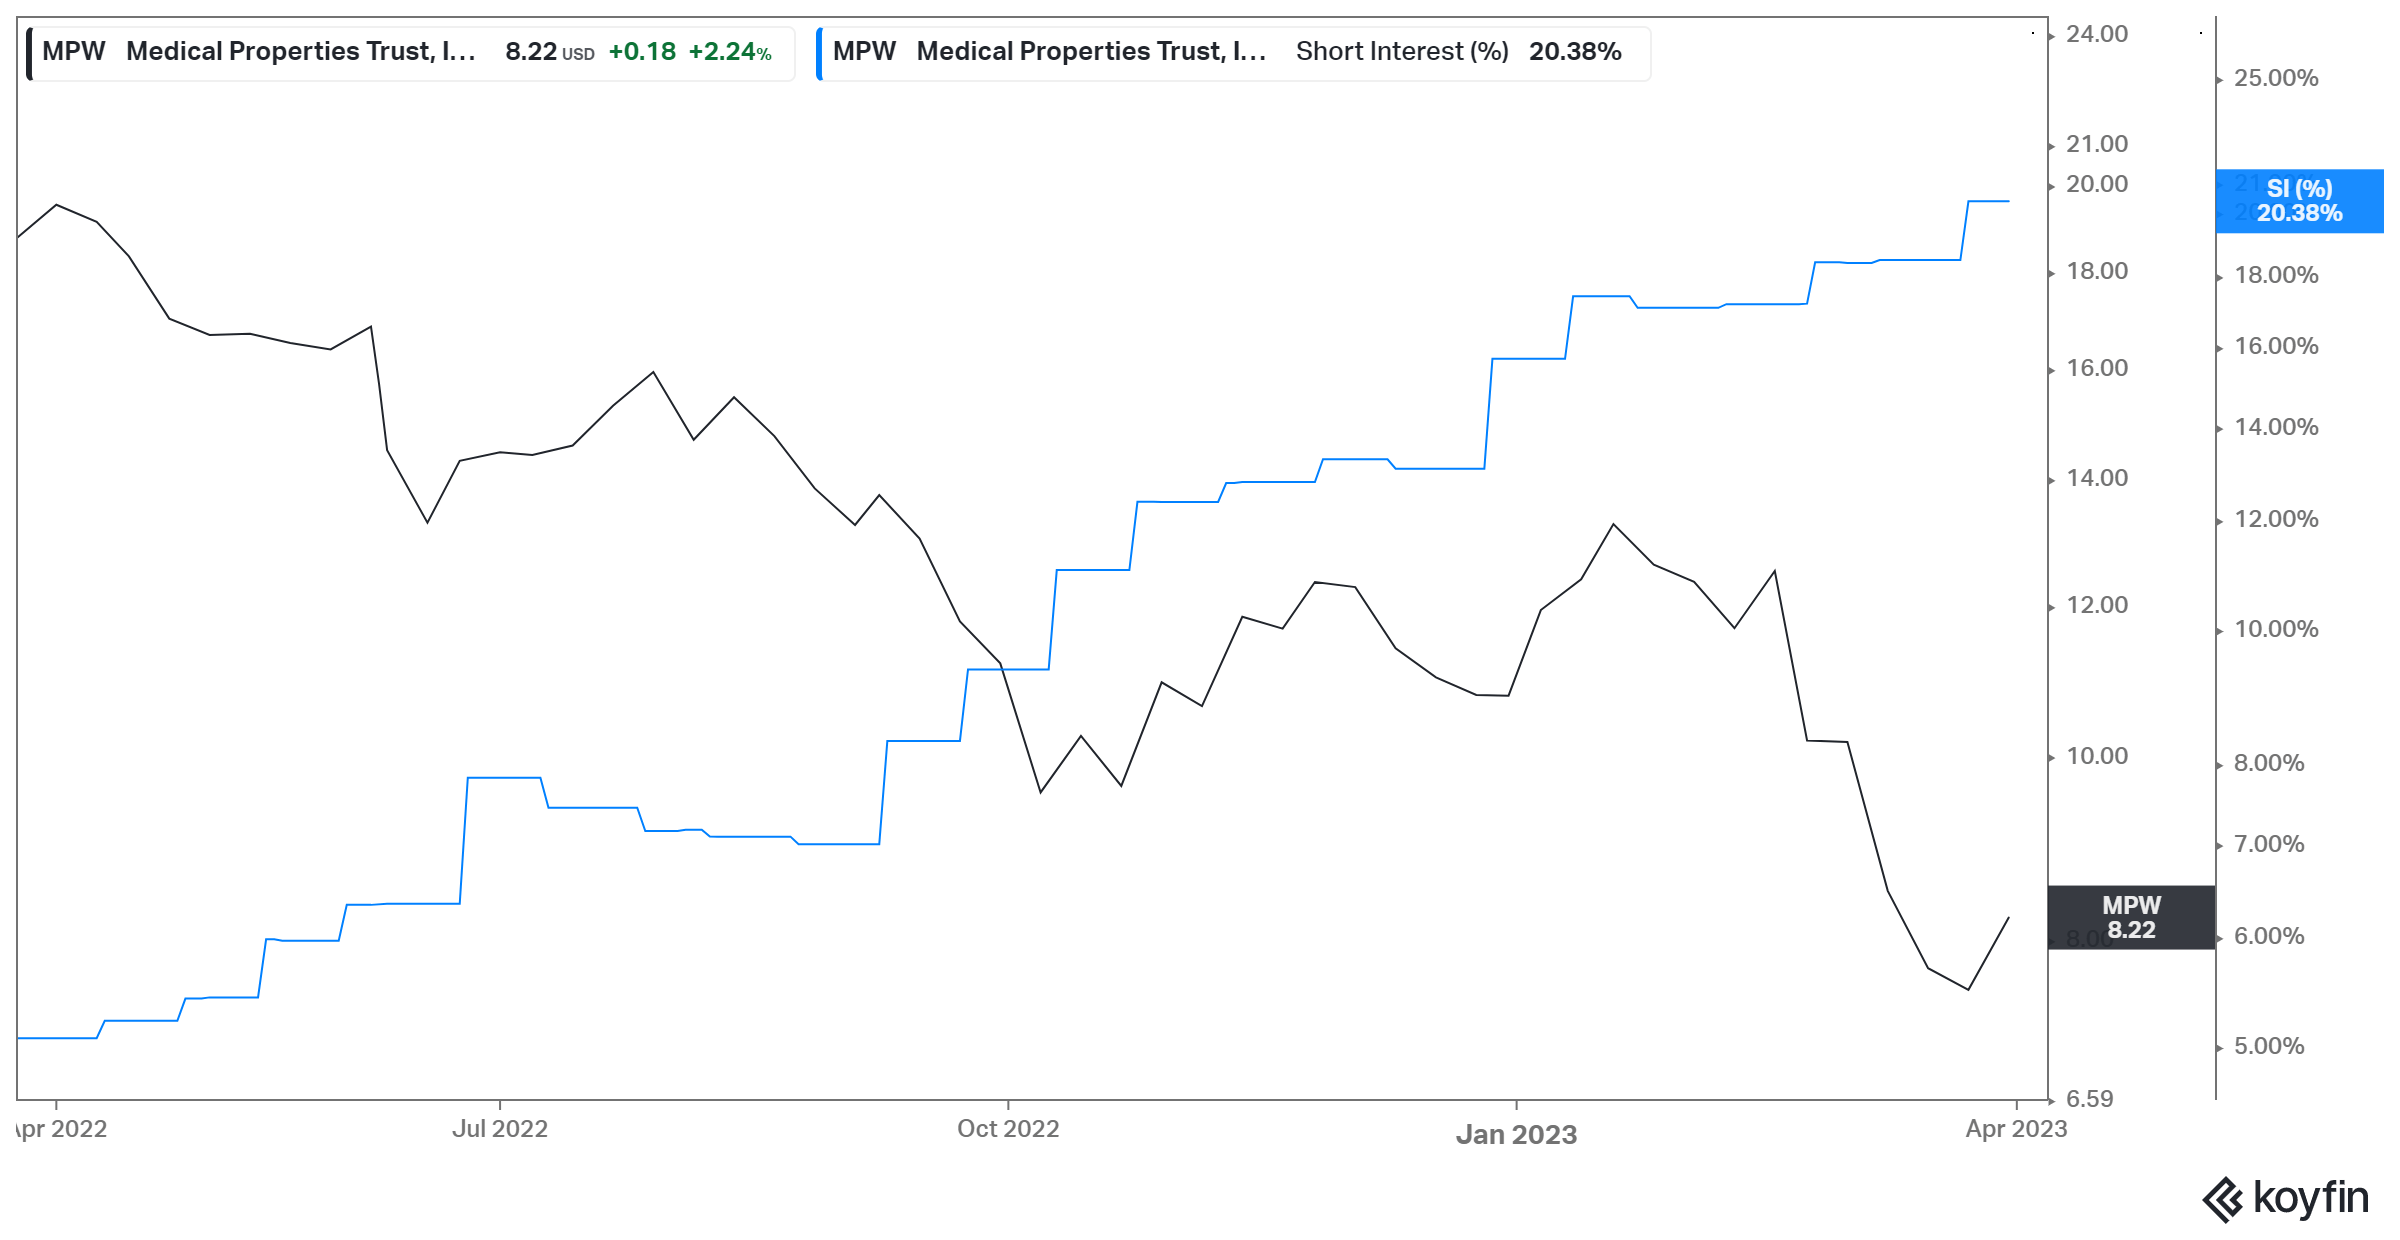
So, what went wrong in early March that intensified the short bets against MPW staging a recovery? We gleaned that MPW's short sellers continued to pile on their bets over the past year.
Even though MPW buyers attempted to form a bottom in October 2022, these short sellers weren't convinced. As such, MPW's short interest as a percentage of float surged from 9.4% in October 2022 to nearly 21% as of mid-March 2023.
The bears have gotten it spot on, with MPW down nearly 50% (in price-performance terms) from its January bull trap to its recent March lows. They increased their bets even though dip buyers returned in October. The banking crisis that erupted in early March likely caused these dip buyers to flee, intensified by the reloading of short bets, as seen in the increase in MPW's short interest as a percentage of float.
Hence, we believe the critical question investors need to assess what could have compelled these buyers to panic. Also, why didn't new buyers return to defend the line as they did in October?
MPT's long-term debt (Data source: S&P Cap IQ)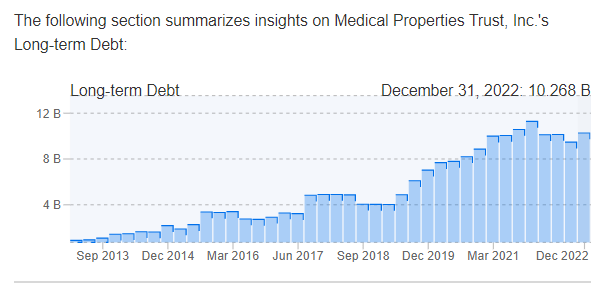
Some investors/analysts could point to MPT's massive debt load. MPT reported long-term debt of nearly $10.3B as of the end of 2022, with a weighted average rate of 3.61%.
While the leading healthcare REIT's debt load was in line with previous years, the refinancing risks based on a higher interest rate regime could have discouraged more buyers from returning.
MPT's debt summary (Company's filings)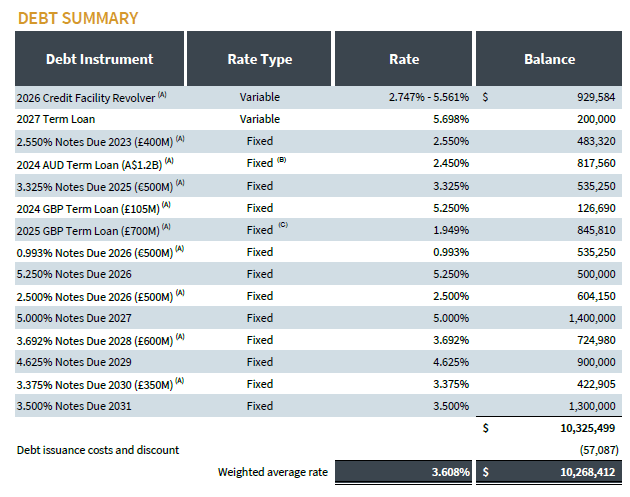
The company has fixed-rate debt of $2.81B due over the next two years as of FQ4'22. Notably, the company will likely need to refinance at much higher rates.
However, we assessed that analysts have likely accounted for these headwinds. Accordingly, MPT is expected to post AFFO per share of $1.28 in FY23, down nearly 10% from last year's $1.42. The estimates are predicated on an FY23 NFFO per share projection of $1.59, slightly higher than the company's midpoint guidance of $1.57.
Therefore, we believe it's not likely that market operators had not anticipated MPT could report a lower AFFO per share in 2023. But, it seems that investors could have downgraded their outlook further, expecting MPT to be more adversely affected by a worse refinancing outlook.
Why? Lending requirements are expected to tighten further as banks deal with the fallout from the recent banking crisis. As such, yield spreads have surged since early March, likely reflecting these headwinds.
As such, bearish investors are likely betting that MPT could be forced to undertake higher interest rate expense and/or sell more assets to lower their refinancing risks. Moreover, given its relatively high payout ratio, these actions could affect its ability to sustain its dividend per share or DPS.
Accordingly, MPT's AFFO payout ratio reached 86% as of the end of 2022, up markedly from 2021's 79%. Moreover, analysts' estimates reflect markedly lower DPS projections through 2025. Accordingly, MPT is expected to post a DPS of $1.05 for FY23, down 30% YoY. It's also expected to fall further through 2025, reaching $0.92.
Hence, investors need to be prepared for three years of dividend cuts. But has the market not reflected it?
Accordingly, MPT last traded at an FY25 dividend yield of 11%, well above the two standard deviation zone over its 10Y average of 6.6%. Hence, we believe market operators have likely reflected a significant dividend cut in their valuation.
Therefore, the selldown over the past three weeks likely suggests that the market expects further headwinds on MPT's ability to sustain its NFFO guidance, given the recent banking crisis.
However, by the time you read this article, we believe the new defense line has likely been established, as the market is forward-looking.
Let's see.
MPW price chart (weekly) (TradingView)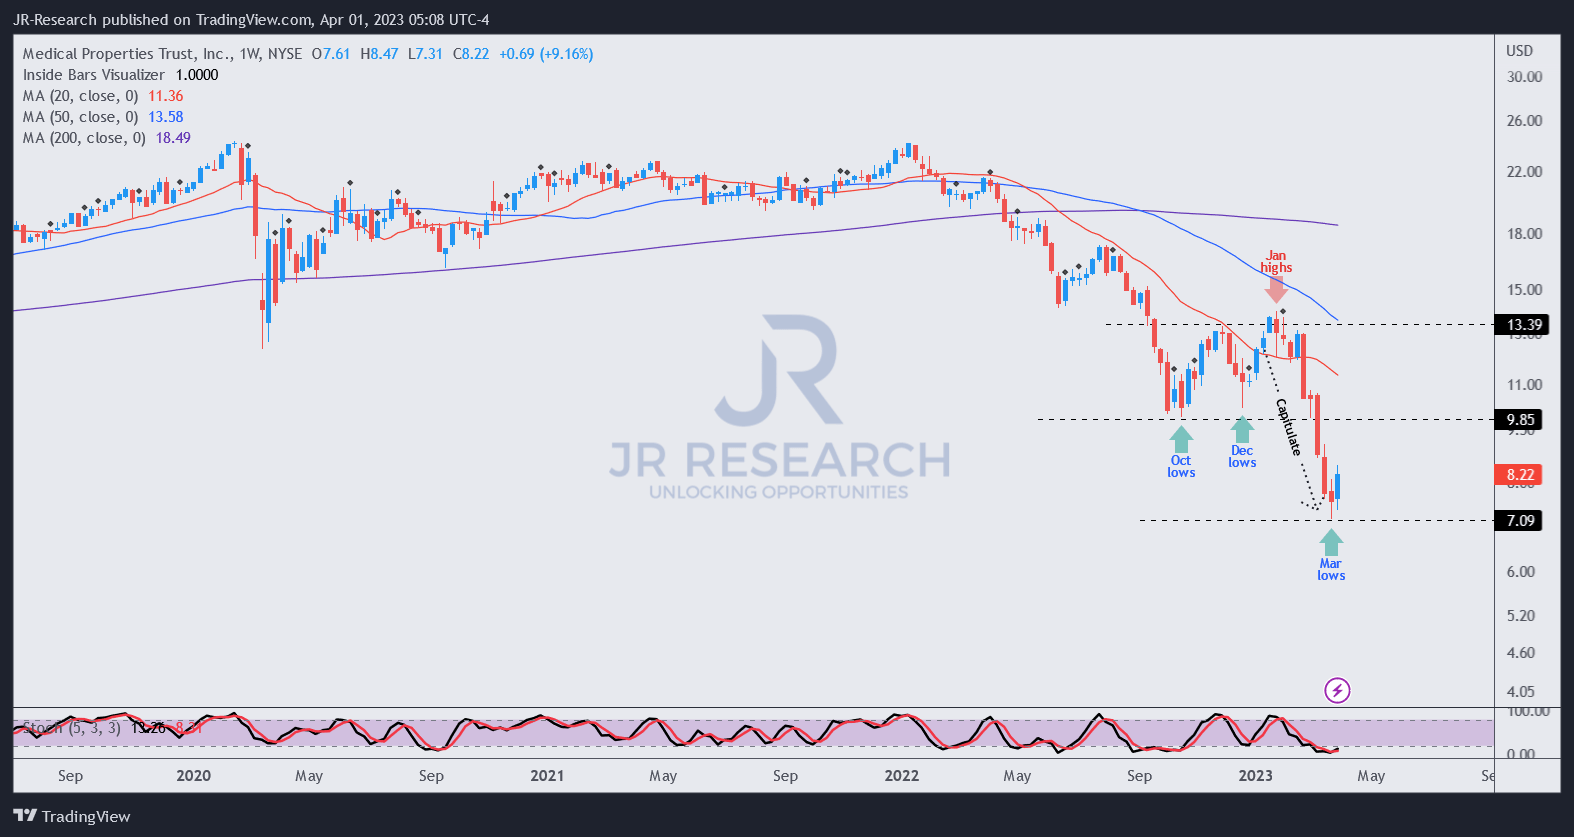
We noted a bottoming process over the past two weeks, with a bullish reversal last week. As such, some short covering has likely occurred, lifting the positive buying sentiments that coincided with the sale of MPT's Australian assets to pay down debt.
BofA (BAC) noted in a mid-March commentary highlighting potential refinancing risks over its Australian term loan. As such, the sale has likely resolved near-term negative sentiments over the company's ability to sustain higher interest expenses if refinanced. Notwithstanding, the reduction in its rental base will need to be addressed subsequently.
However, there isn't a validated bear trap or false downside breakdown yet. Therefore, investors looking to "front-run" the market must be wary of the risks of adding exposure now.
MPW price chart (monthly) (TradingView)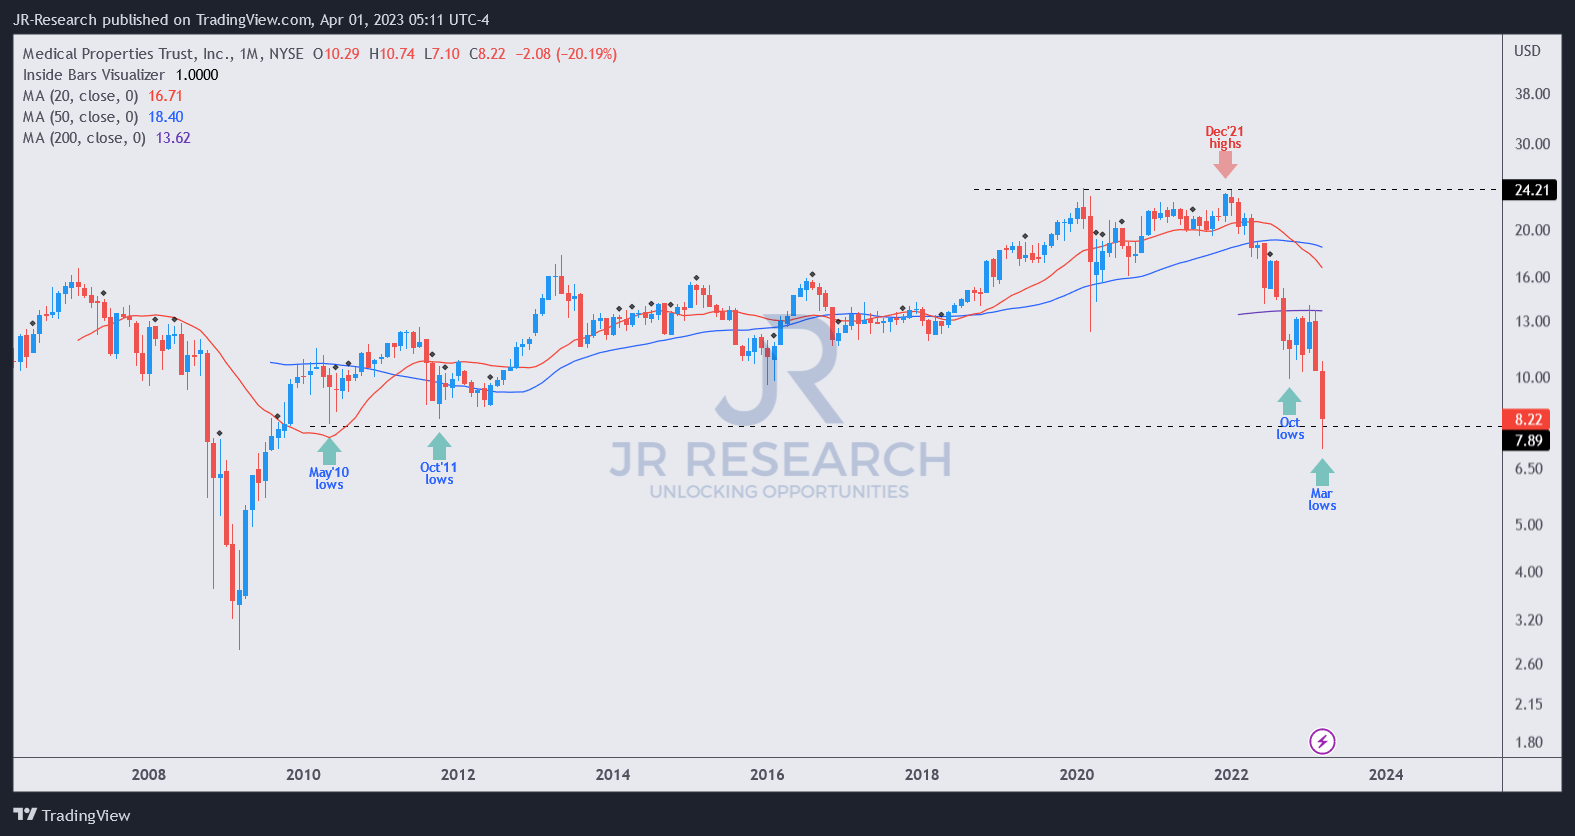
Despite that, we parsed that there is still cause for optimism.
March's selloff took out buyers at critical support levels that undergirded the bottoming process in May 2010 and October 2011. Hence, the current level of $7.9 is a crucial zone for buyers to defend. Bearish investors are likely looking to inflict more pain and exploit the gap toward its 2009 lows.
However, if MPW buyers could return decisively after the recent valuation markdown, it still augurs well for a mean-reversion opportunity. Moreover, the banking crisis abated since mid-March, in line with lower-than-expected inflation readings.
Investors looking for a more constructive price action reversal signal must assess the bottoming process in April. This is a long-term chart (every candlestick indicates one month's worth of price action).
Notwithstanding, investors with high conviction on MPT's recovery can consider adding some exposure here and increasing it further if the bear trap is subsequently validated.
However, a decisive breakdown of the current levels by the bears could intensify its downside risks as they look to exploit the gap toward its 2009 lows. Hence, we urge investors to apply appropriate risk management strategies to preserve their capital accordingly.
Rating: Buy (Reiterated).
Important note: Investors are reminded to do their own due diligence and not rely on the information provided as financial advice. The rating is also not intended to time a specific entry/exit at the point of writing unless otherwise specified.
We Want To Hear From You
Have you spotted a critical gap in our thesis? Saw something important that we didn't? Agree or disagree? Comment and let us know why, and help everyone to learn better!
Editor's Note: This article discusses one or more securities that do not trade on a major U.S. exchange. Please be aware of the risks associated with these stocks.
A Unique Price Action-based Growth Investing Service
- We believe price action is a leading indicator.
- We called the TSLA top in late 2021.
- We then picked TSLA's bottom in December 2022.
- We updated members that the NASDAQ had long-term bearish price action signals in November 2021.
- We told members that the S&P 500 likely bottomed in October 2022.
- Members navigated the turning points of the market confidently in our service.
- Members tuned out the noise in the financial media and focused on what really matters: Price Action.
Sign up now for a Risk-Free 14-Day free trial!

This article was written by

JR research was featured as one of Seeking Alpha's leading contributors in 2022. See: https://seekingalpha.com/article/4578688-seeking-alpha-contributor-community-2022-by-the-numbers
Unlock the key insights to growth investing with JR Research - led by founder and lead writer JR. Our dedicated team is focused on providing you with the clarity you need to make confident investment decisions.
Transform your investment strategy with our popular Investing Groups service.
Ultimate Growth Investing specializes in a price action-based approach to uncovering the opportunities in growth and technology stocks, backed by actionable fundamental analysis.
We believe price action is a leading indicator.
Price action analysis is a powerful and versatile toolkit for the informed investor because it can be used to analyze any publicly traded security. As such, it offers investors with invaluable insights into understanding market behavior and sentiments.
Plus, stay ahead of the game with our general stock analysis across a wide range of sectors and industries.
Improve your returns and stay ahead of the curve with our short- to medium-term stock analysis.
We not only identify long-term potential but also seize opportunities to profit from short-term market swings, using a combination of long and short set-ups.
Join us and start seeing experiencing the quality of our service today.
I was previously an Executive Director with a global financial services corporation. I led company-wide award-winning wealth management teams that were consistently ranked among the best in the company.
I graduated with an Economics Degree from National University of Singapore [NUS]. NUS is Asia's #1 university according to Quacquarelli Symonds [QS] annual higher education ranking. It also held the #11 position in QS World University Rankings 2022.
I'm also a Commissioned Officer (Reservist) with the Singapore Armed Forces. I was the Battalion Second-in-command of an Armored Regiment. I currently hold the rank of Major. I graduated as the Distinguished Honor Graduate from the Armor Officers' Advanced Course as I finished first in my cohort of Armor officers. I was also conferred the Best in Knowledge award.
My LinkedIn: www.linkedin.com/in/seekjo
Disclosure: I/we have a beneficial long position in the shares of BAC either through stock ownership, options, or other derivatives. I wrote this article myself, and it expresses my own opinions. I am not receiving compensation for it (other than from Seeking Alpha). I have no business relationship with any company whose stock is mentioned in this article.