
 Yahoo Finance
 20 Places in America That Are Getting Poorer
The U.S. economy has been a topic of major concern within recent years. As some states seem to thrive, others aren't faring as well. And with the threat of a potential recession looming, a number of cities are at risk of increased poverty.
See: 8 Places in California Where Home Prices Have Plummeted
With a Recession Looming: Make These 3 Retirement Moves To Stay On Track
In taking a closer look at which American cities are losing economic ground over time, GOBankingRates analyzed the 100 most populous cities using data from the U.S. Census Bureau's 2021 and 2011 American Community Surveys. This study highlights how per capita income, median household income, poverty rates and population have changed from 2011 to 2021, scoring each category to determine which city has seen the biggest declines (and increases, in the case of poverty rates) overall.
So which cities have had it hardest? Here's a closer look at which places in America are getting poorer.

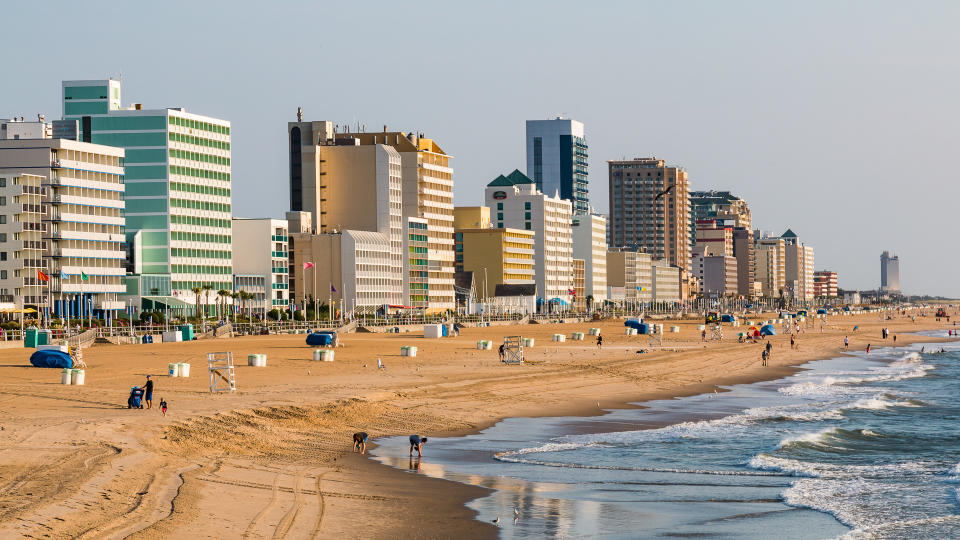
20. Virginia Beach, Virginia
Change in per capita income: $3,780
Change in median household income: $2,476
Change in population: 20,679
Change in poverty rate: -9.30%
Live Richer Podcast: Overcome Your Fear of Asking For the Raise You Deserve
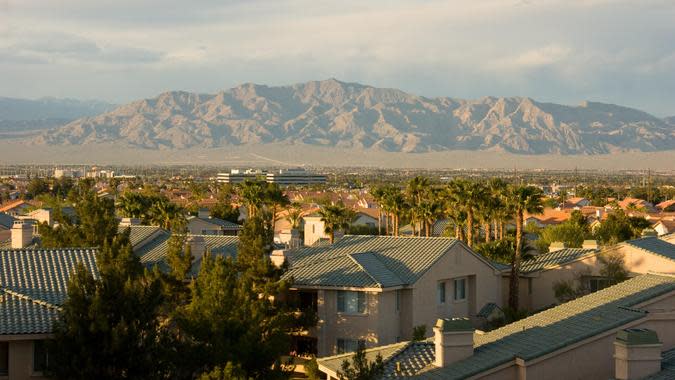
19. North Las Vegas, Nevada
Change in per capita income: -$150
Change in median household income: -$4,383
Change in population: 49,180
Change in poverty rate: -31.02%

18. Jacksonville, Florida
Change in per capita income: $1,700
Change in median household income: -$948
Change in population: 120,088
Change in poverty rate: -18.58%
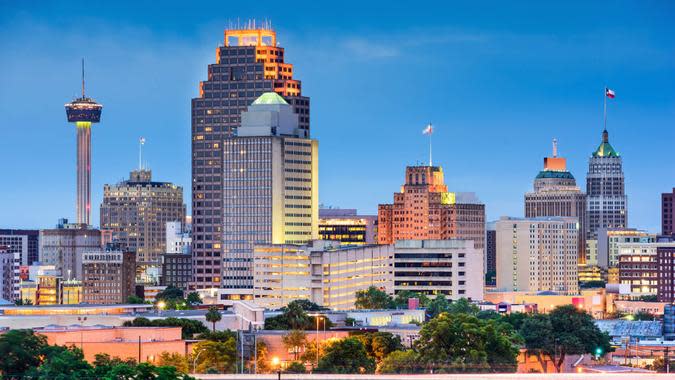
17. San Antonio, Texas
Change in per capita income: $1,697
Change in median household income: $2,169
Change in population: 121,385
Change in poverty rate: -11.56%
See the List: GOBankingRates' Best Banks of 2023
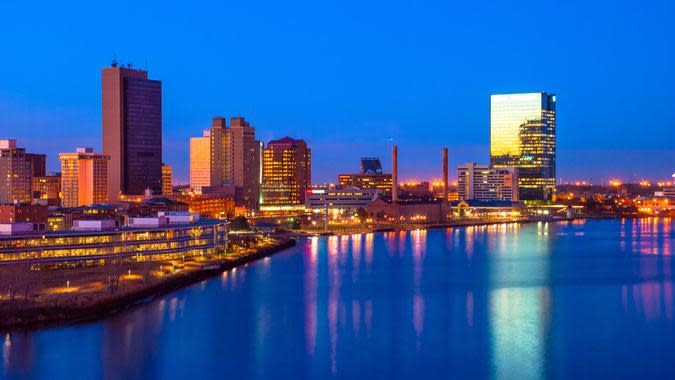
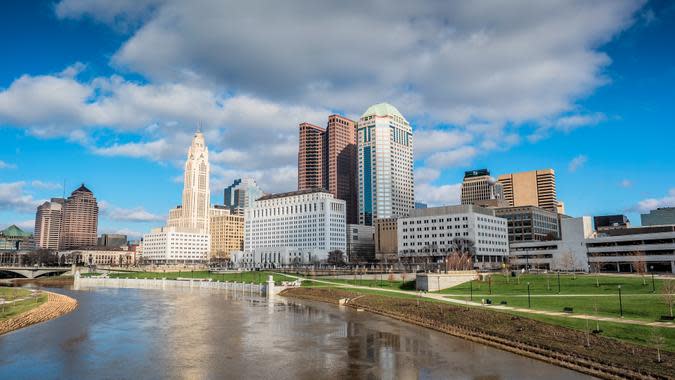
16. Toledo, Ohio
Change in per capita income: $1,155
Change in median household income: $541
Change in population: -18,174
Change in poverty rate: -18.60%
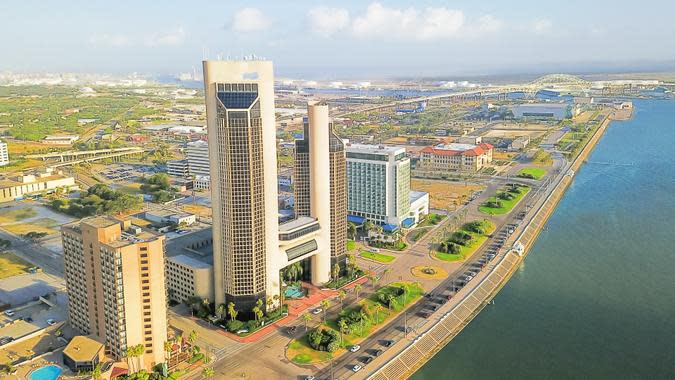
15. Corpus Christi, Texas
Change in per capita income: $1,091
Change in median household income: $5,506
Change in population: 16,055
Change in poverty rate: -10.99%
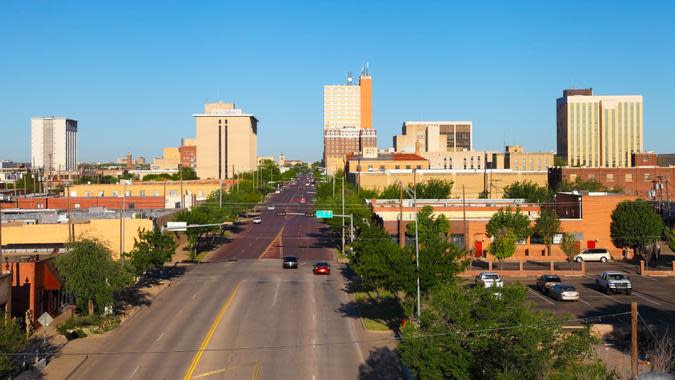
14. Lubbock, Texas
Change in per capita income: $2,270
Change in median household income: $2,392
Change in population: 29,654
Change in poverty rate: -6.73%
I'm a Self-Made Millionaire: These Are the 6 Investments Everyone Should Make During an Economic Downturn

13. Las Vegas, Nevada
Change in per capita income: $1,159
Change in median household income: -$3,852
Change in population: 50,373
Change in poverty rate: -23.20%

12. Memphis, Tennessee
Change in per capita income: $2,503
Change in median household income: -$642
Change in population: -17,984
Change in poverty rate: -11.03%

11. Wichita, Kansas
Change in per capita income: $1,299
Change in median household income: $1,456
Change in population: 16,668
Change in poverty rate: -15.08%
Find Out: What Happens to Your Money If Your Bank Fails?
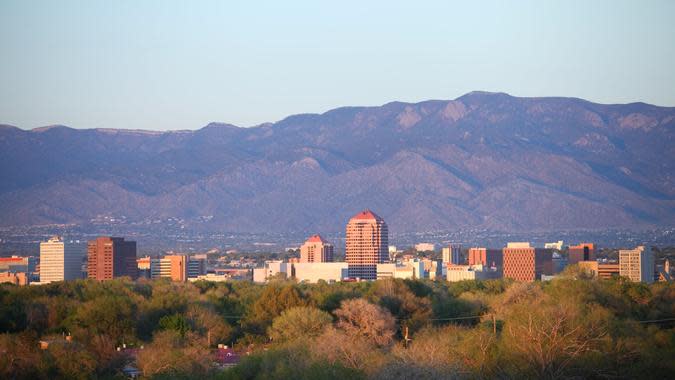
10. Albuquerque, New Mexico
Change in per capita income: $1,674
Change in median household income: -$608
Change in population: 23,336
Change in poverty rate: -16.49%
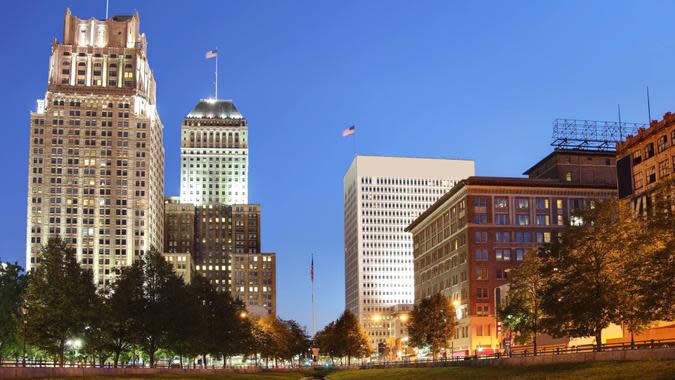
9. Newark, New Jersey
Change in per capita income: $989
Change in median household income: -$1,631
Change in population: 30,735
Change in poverty rate: -18.35%
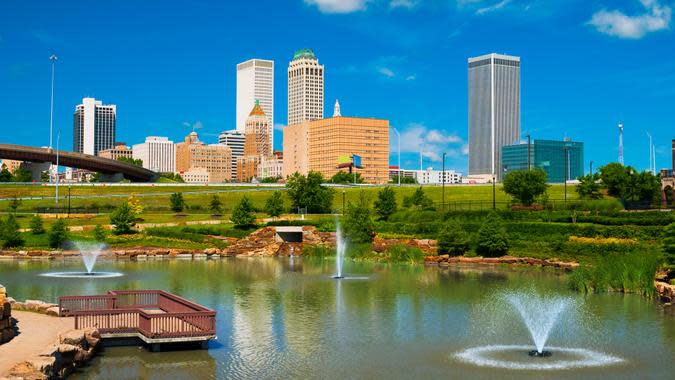
8. Tulsa, Oklahoma
Change in per capita income: $1,321
Change in median household income: $3,968
Change in population: 19,948
Change in poverty rate: -9.55%
Discover: Here's the Average IRS Tax Refund Amount by State
7. Chesapeake, Virginia
Change in per capita income: $2,860
Change in median household income: $1,167
Change in population: 26,335
Change in poverty rate: -6.98%
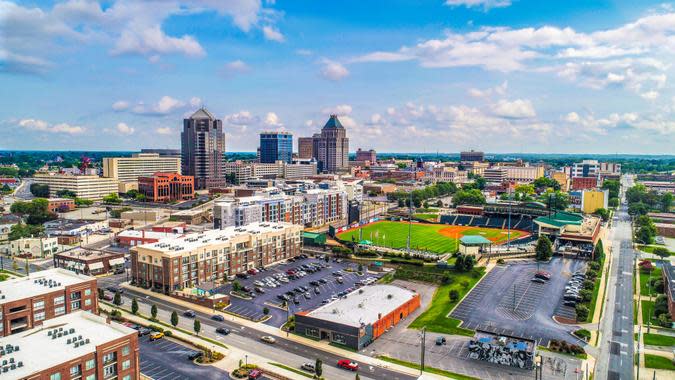
6. Greensboro, North Carolina
Change in per capita income: $728
Change in median household income: $1,145
Change in population: 28,388
Change in poverty rate: -11.22%
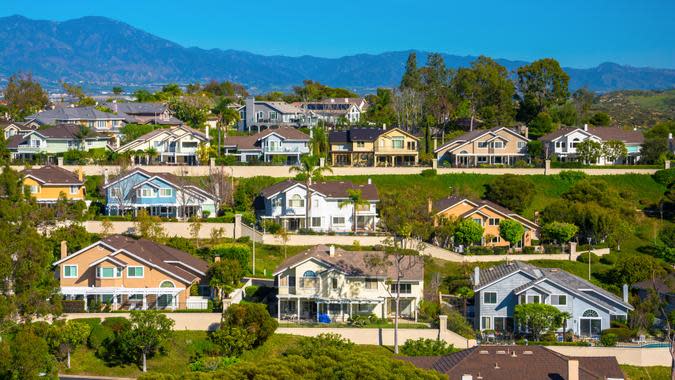
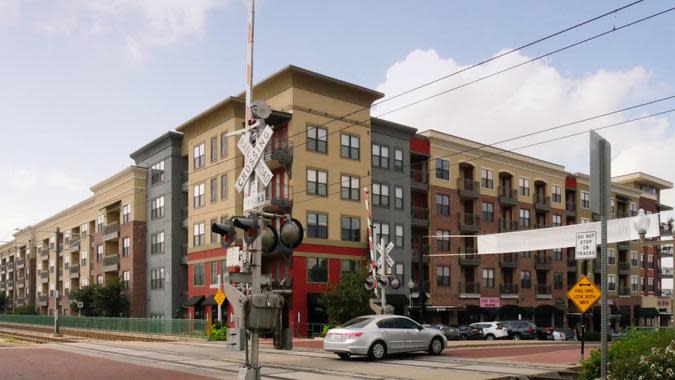
5. Irvine, California
Change in per capita income: $1,976
Change in median household income: $2,568
Change in population: 92,811
Change in poverty rate: 2.50%
Social Security: Women Get $354 Per Month Less Than Men -- Here's Why
4. Plano, Texas
Change in per capita income: $2,321
Change in median household income: -$57
Change in population: 21,984
Change in poverty rate: -4.29%
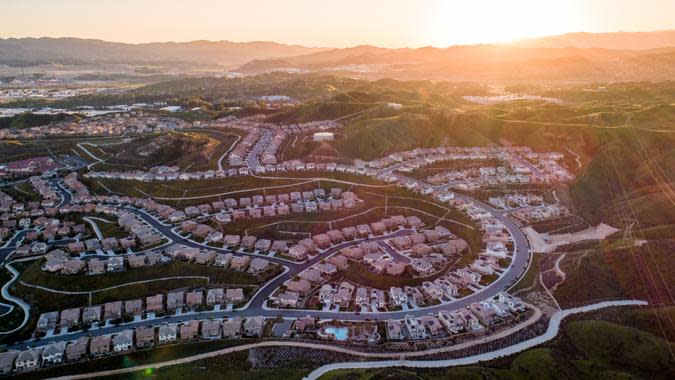
3. Santa Clarita, California
Change in per capita income: $2,326
Change in median household income: $5,564
Change in population: 53,189
Change in poverty rate: 9.21%
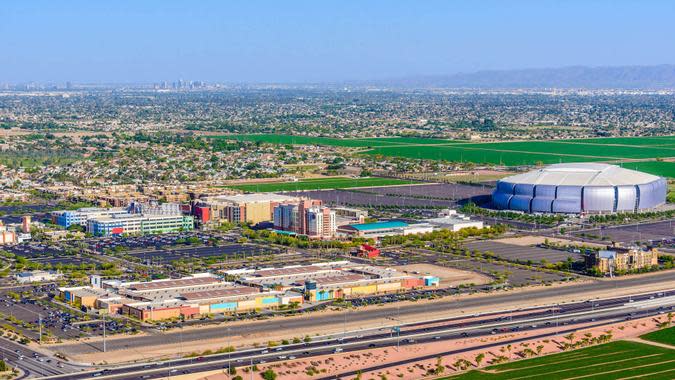
2. Glendale, Arizona
Change in per capita income: -$131
Change in median household income: -$1,575
Change in population: 16,074
Change in poverty rate: -9.90%
Is Your State Tax-Friendly? Only 5 Were Given an A-Grade (and 4 Failed)
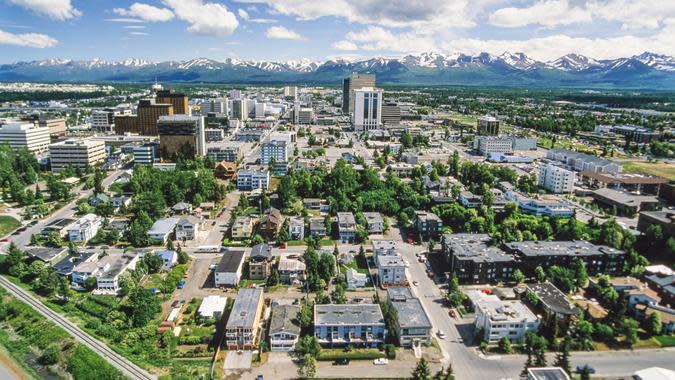
1. Achorage, Alaska
Change in per capita income: $298
Change in median household income: -$1,988
Change in population: 5,155
Change in poverty rate: 19.74%
More From GOBankingRates
Laura Beck contributed to the reporting for this article.
Methodology: GOBankingRates determined which U.S. cities are now poorer than they were by analyzing the 100 most populous cities: (1) per capita income in 2011, adjusted for inflation; (2) per capita income in 2021; (3) difference between the 2011 and 2021 per capita incomes; (4) median household income in 2011, adjusted for inflation; (5) median household income in 2021; (6) difference between the 2011 and 2021 household incomes; (7) population in 2011 vs. 2021; and (8) poverty rate in 2011 vs. 2021. All data was sourced from the U.S. Census Bureau's 2021 and 2011 American Community Surveys. All inflation calculations were performed using the Bureau of Labor Statistics' CPI inflation calculator. All data was collected on and up to date as of March 7, 2023.
This article originally appeared on GOBankingRates.com: 20 Places in America That Are Getting Poorer