Major Market Indicators (MMI) Report March/April 2023

Summary
- Markets have survived another hit to the body. It was delivered by outlier hyper-aggressive regional banks with no anticipation of imminent capital disintermediation nor clue of fixed income risk management.
- Impending CPI and PCE data should start showing signs of decreasing inflation.
- All indicators have turned negative.
- Looking for a helping hand in the market? Members of Best of the Uncovereds get exclusive ideas and guidance to navigate any climate. Learn More »
CreativaImages
Singular Research
March/April 2023 MMI Report
Waiting for the Fat Lady.
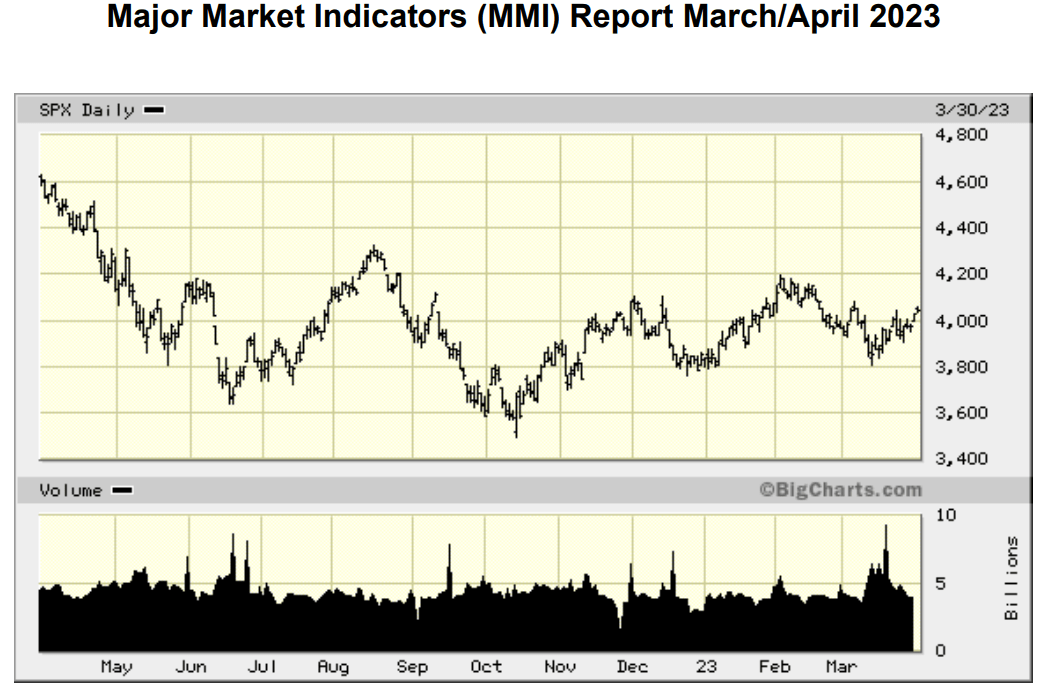
Markets have survived another hit to the body. Delivered by outlier hyper-aggressive regional banks with no anticipation of imminent capital disintermediation nor clue of fixed income risk management. The bear is looking long in the tooth at the short end of their bite. The S&P 500 (SP500) has just completed another successful test of the July lows at the 3600-3750 level. Although overbought by a flight to safety, near-term Treasury bill yields and our forward rate indicator have plummeted nearly 100 basis points in the last two weeks. Combined with negative M2 growth, this concurrence is shouting out for a cessation of increases in rates by the Fed and a sooner-than-expected possible cut.
Impending CPI and PCE data should start showing signs of decreasing inflation, perhaps at a more rapid rate than expected, due to a heavy weighting of shelter costs that have been in decline over the last four to five months but not calculated in the Fed's lagging caucus of this input.
Singular Research BigCharts.com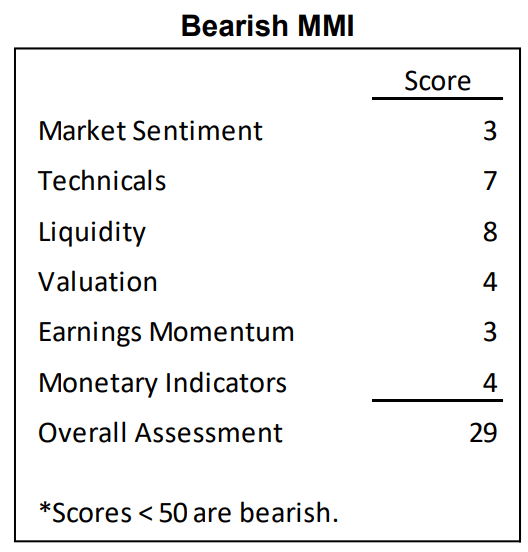
Market Sentiment: Negative
This indicator is contrarian that scores positive when the consensus is very negative. Four out of twelve indicators are negative. The VIX is at 22.61, and the NASDAQ VXN is at 26.56, both are slightly elevated readings. The put-to-call ratio for the S&P 100 is 1.25, while the CBOE equity put-to-call ratio is at 0.73, which are both bullish. Bonds’ confidence ratio is neutral at 1.15. The AAII bull/bear ratio is 0.43, which is bullish. The TRIN is at 0.99, which is neutral, and the NASDAQ short interest ratio is 4.21 days to cover, which is bullish.
Technical Indicators: Negative
Three out of nine indicators are negative, which is bearish. The weekly NYSE high-to-low ratio is at 0.11 - 0.126 to 1, NYSE advancing issuers over decliners are 1.46 to 1 (neutral), and the NYSE advance-to-decline volume ratio is 1.85 to 1 (positive). The 10-day moving average up-to-down issues ratio on the NYSE is 0.80, as is the Nasdaq ratio at 0.84 to 1.
Moving to the indices, the S&P 500 is 0.40% over its 200-day moving average, DJIA (0.57)%, NASDAQ 7.28%, the NYSE composite is (1.92)%, the equal-weighted S&P 500 index is (2.41)%, IWC micro-cap is (9.26)%, and the equal-weighted S&P SmallCap 600 (5.02)%.
Liquidity Indicators: Negative
Margin debt has improved now up to 33% of equity and is (30)% month-over-month, which is a positive. Money market funds have assets are above $5.1 trillion, +$151 billion, which is a positive as they have outsized nearly 20% of the total market cap of domestic equity markets. Over $25 billion flowed out of ETFs and mutual funds in March, which is negative. Buybacks were $19.2 billion, led by a $14.8 billion buyback at AMAT, followed by VRSK and ED at $2.5 and $1 billion, respectively. M&A was slim to none in March. Stock offerings were $8.7 billion, led by energy, biotech, and technology issues. Invoking quantitative tightening, the Fed has announced an ongoing program of buying and selling securities in the amount of $50 to $90 billion monthly, which is a negative. All in, an aggregate of $(15) billion exited out of the equity market in March.
Valuation: Negative
One out of four indicators was positive. Market cap to GDP is 1.45x, which is neutral. Market cap to replacement value is 1.5 to 1, also neutral. Earnings yield is 5.49, and corporate investment grade to BBB is 5.48, which is positive albeit by the slightest margin possible. Current fair value on the S&P 500 is 3,740, about 5 to 6% from current levels, which are near 4000. This valuation is derived using a 17 multiple on $220 EPS estimate for 2023. Our excess liquidity indicator is negative at (0.11) due to M2 declining 2.3% year-over-year.
EPS Momentum: Negative
One out of five indicators was positive. For the S&P 500 in Q4:22, 72% of companies beat estimates which is positive. For Q1:23 EPS revisions, 38% were revised up, but 44.7% were revised down, which is negative.
For EPS revisions one-year ahead, 38.7% revised up and 51.5% revised down, which is negative. For Q1:23, the estimated earnings decline for the S&P 500 is (6.1)%. The earnings revision decline is negative (0.3)% for Q1 as 83 companies have issued negative guidance and 25 positive. For Q1:23, TTM P/E is 17.1, which is below the 5-year average of 18.5 and slightly below the 10-year average of 17.3. The bottom-up EPS estimate for Q1 is (5.8)% which is negative.
Estimated revenue growth for Q1:23 is 1.9% which is below the 5-year average growth rate of 7.8% and the 10-year average of 4.6%. Net profit margin is 11.3% for Q1. Estimated 2023 full-year net profit margin equals last quarter's net margin of 11.3% but below the 5-year average of 11.4%.
For Q2:23, analysts are projecting an earnings decline of (3.8)%. For Q3, Q4, and full-year 2023 EPS growth, analysts are predicting growth of 2.9%, 9.7%, and 1.9%, respectively. For the full year of 2023, analysts are predicting revenue growth of 2.1%.
Monetary Indicators: Negative
Only one of four monetary indicators is positive. Money supply M2 (2.3)% growth year-over year, and money velocity was up 4.95%. Summed up versus GDP growth, our excess liquidity indicator is negative (0.11)%. Term yield spread is equal to the one-year T-bill divided by the 10-year T-bond and is negative 0.93, derived from 1.28% for a one-year T-bill and a 10-year T-bond at 3.37%.
The forward rate one-year T-bill squared divided by the 3-month T-bill equals 4.06%, down from 5% and recently below the 5% Fed Funds rate. This result is positive and indicates 100 basis points of downward adjustment to meet parity.
U.S. 10-year bond versus corporate high yield gives us a 10-year spread of 87 basis points below the 400-basis points threshold to be bullish, which is negative.
In March, as of press time, performance has been driven by a large divergence in asset class performance and sector performance led by the NASDAQ at +12.97% year to date while the broader Wilshire 5000 was +3.11%, S&P 500 +3.42%, and NYSE -2.80%. Thus, we are seeing narrow big-cap tech leadership re-emerging in the market.
Robert Maltbie, CFA President,
Singular Research 818-222-6915
Best of the Uncovereds offers new initiation reports on roughly two dozen companies per year, with a focus on under-followed small and mid caps with significant potential. We provide a quarterly earnings update reports on all companies covered, as well as flash reports on significant news announcements by companies. We go further for members, providing recorded interviews with management teams of covered companies when available and a monthly quantitative based "Market Indicators and Strategy Report."
This article was written by

Disclosure: I/we have no stock, option or similar derivative position in any of the companies mentioned, and no plans to initiate any such positions within the next 72 hours. I wrote this article myself, and it expresses my own opinions. I am not receiving compensation for it. I have no business relationship with any company whose stock is mentioned in this article.