ERH: Underperforms A Simple XLU/JNK Portfolio

Summary
- ERH provides exposure to utilities and high-yield bonds.
- The ERH fund pays an attractive 8.7% distribution yield but has only delivered 5.2% average annual returns over 5 years.
- Investors may be able to achieve higher returns and lower risk than the ERH fund from a simple XLU/JNK portfolio.
deepblue4you
The Allspring Utilities and High Income Fund (NYSE:ERH) pays an attractive 8.7% trailing distribution, but has only earned average annual returns of 5.2% over 5 years. However, investors may be able to achieve better total returns by investing in a simple portfolio of liquid ETFs.
Fund Overview
The Allspring Utilities and High Income Fund is a closed-end fund that combines a utilities-focused investment strategy with a high yield bond investment strategy. Under normal market conditions, the ERH fund will invest 70% of its total assets in common, preferred, and convertible preferred stocks of utility companies while 30% of its assets will be allocated to a portfolio of high yield bonds.
The EFR fund may use leverage to enhance returns. As of December 31, 2022, the fund had $30 million in debt versus $112 million in net assets for 21% effective leverage.
The ERH fund charged 1.25% net expense ratio in fiscal 2022.
Portfolio Holdings
Figure 1 shows the ERH fund's sector allocation for both equities and fixed income. As designed, the fund mostly invests in utility equities, while its fixed income portfolio is broadly diversified.
Figure 1 - ERH sector allocation (ERH factsheet)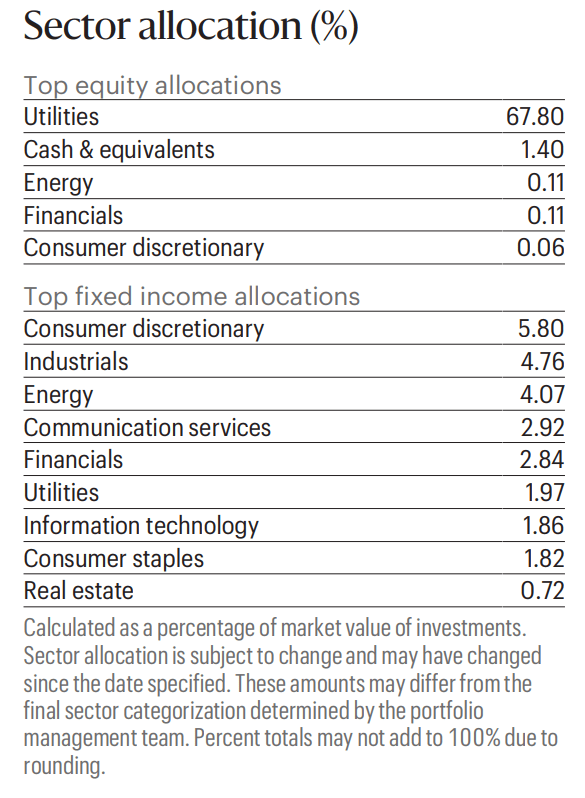
Figure 2 shows the credit quality allocation of the ERH fund's fixed income portfolio. Most of the portfolio is concentrated in high-yield securities rated BB (49.5%) and B (38.4%).
Figure 2 - ERH credit quality allocation (ERH factsheet)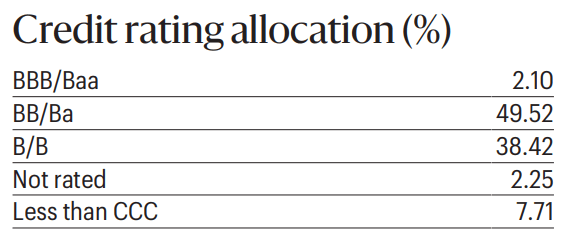
Figure 3 shows the top 10 holdings of the ERH fund, which comprise 44.5% of the portfolio.
Figure 3 - ERH top 10 holdings (ERH factsheet)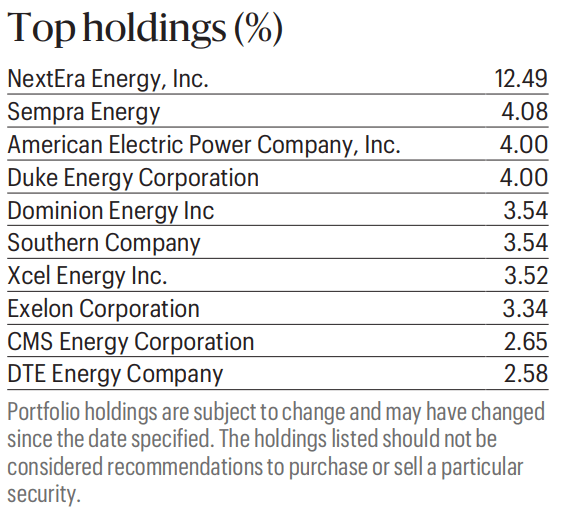
Returns
ERH has delivered modest historical returns, with 3/5/10/15Yr average annual returns of 3.7%/5.2%/6.4%/4.6% respectively to February 28, 2023 (Figure 4). ERH's annual returns have ranged from -5.1% to 16.3%, with 7 winning years out of the past 10. Despite both equity markets and bond markets taking a tumble in 2022, ERH was relatively unscathed with only a -4.8% drawdown.
Figure 4 - ERH historical returns (morningstar.com)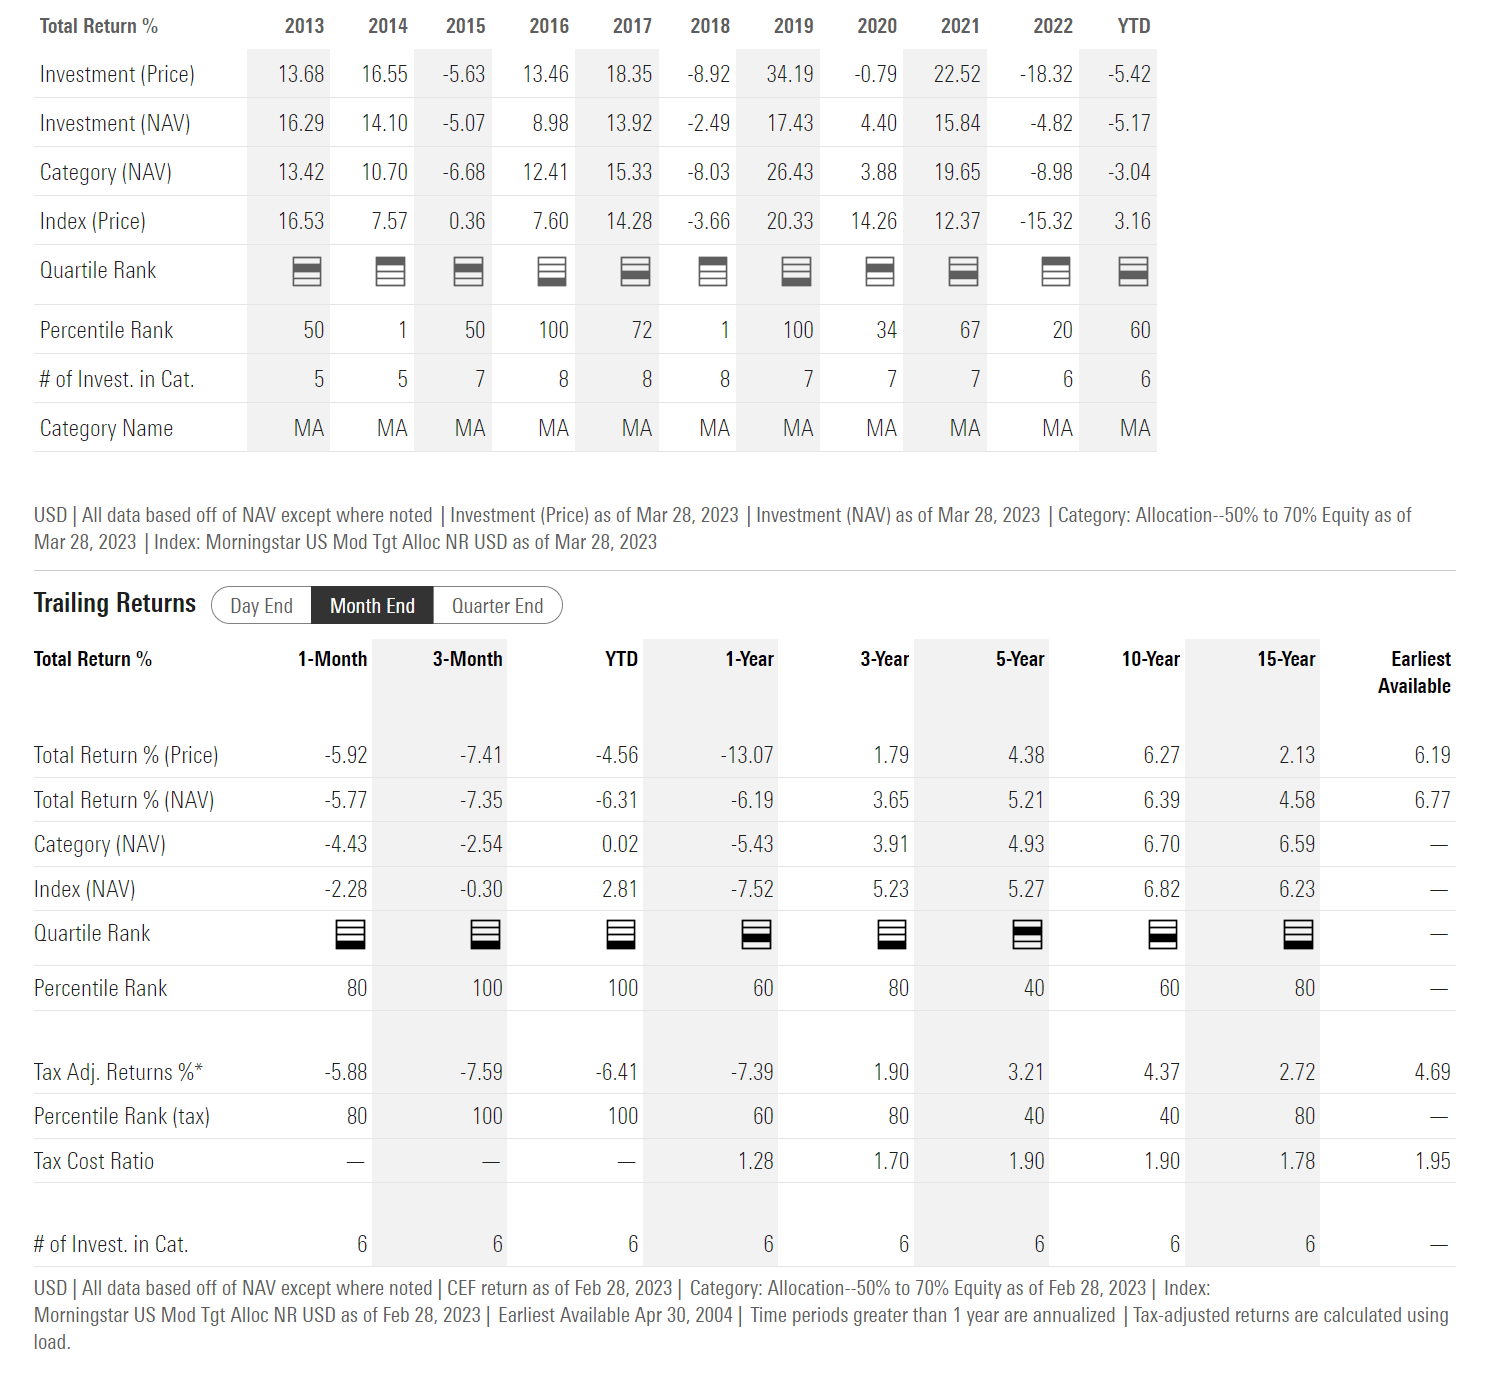
Distribution & Yield
ERH pays a high monthly distribution with a trailing 12 month distribution of $0.90 / share or 8.7% trailing yield. On NAV, ERH is yielding 8.0%.
Investors should note that ERH's distribution has historically included a significant amount of return of capital ("ROC") with ROC comprising 49% of fiscal 2022's distribution (Figure 5).
Figure 5 - ERH historical financial summary (ERH annual report)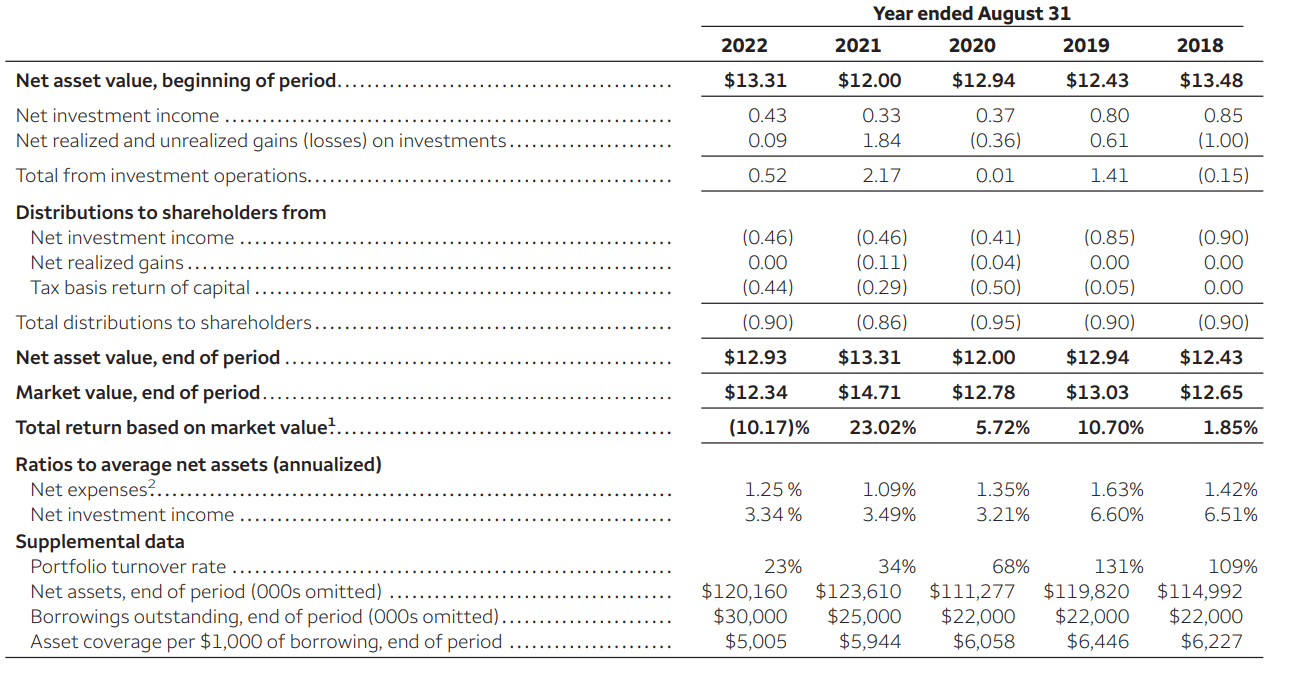
Funds that do not earn their distributions are commonly called 'return of principal' funds and may rely on liquidating NAV to fund its distribution. This leads to a steady decrease in the fund's NAV over time, like the Eaton Vance Short Duration Diversified Income Fund (EVG) which has a long-term shrinking NAV and distribution rate (Figure 6).
Figure 6 - EVG is a classical 'return of principal' fund (morningstar.com)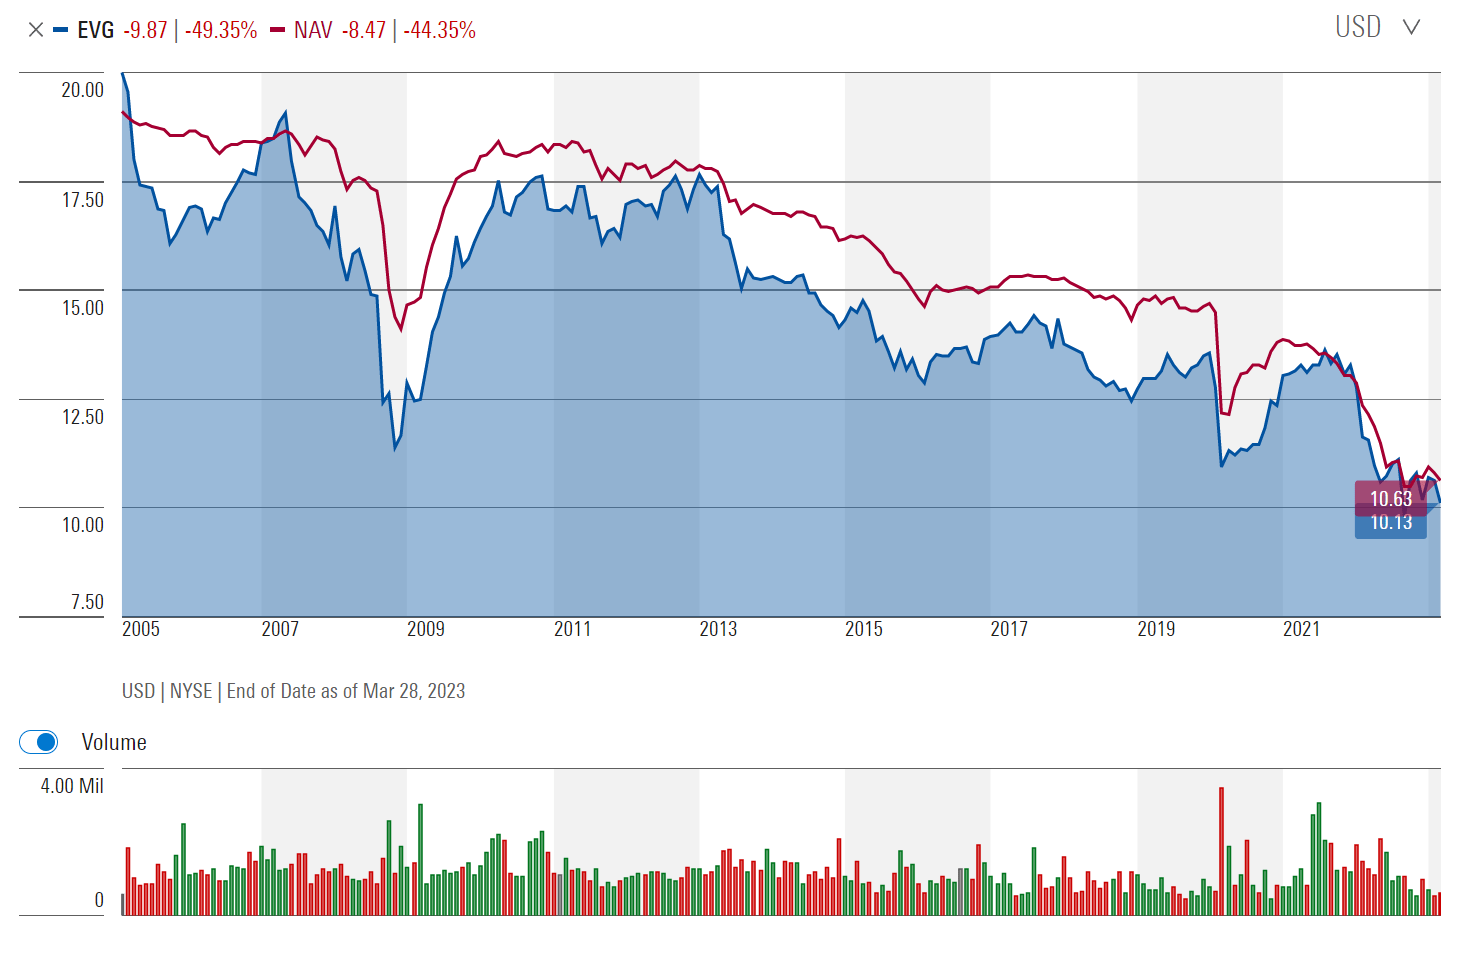
However, this is not the case with the ERH fund, as its NAV has been in a wide sideways range in the past decade (Figure 7).
Figure 7 - ERH does not have a long-term shrinking NAV (morningstar.com)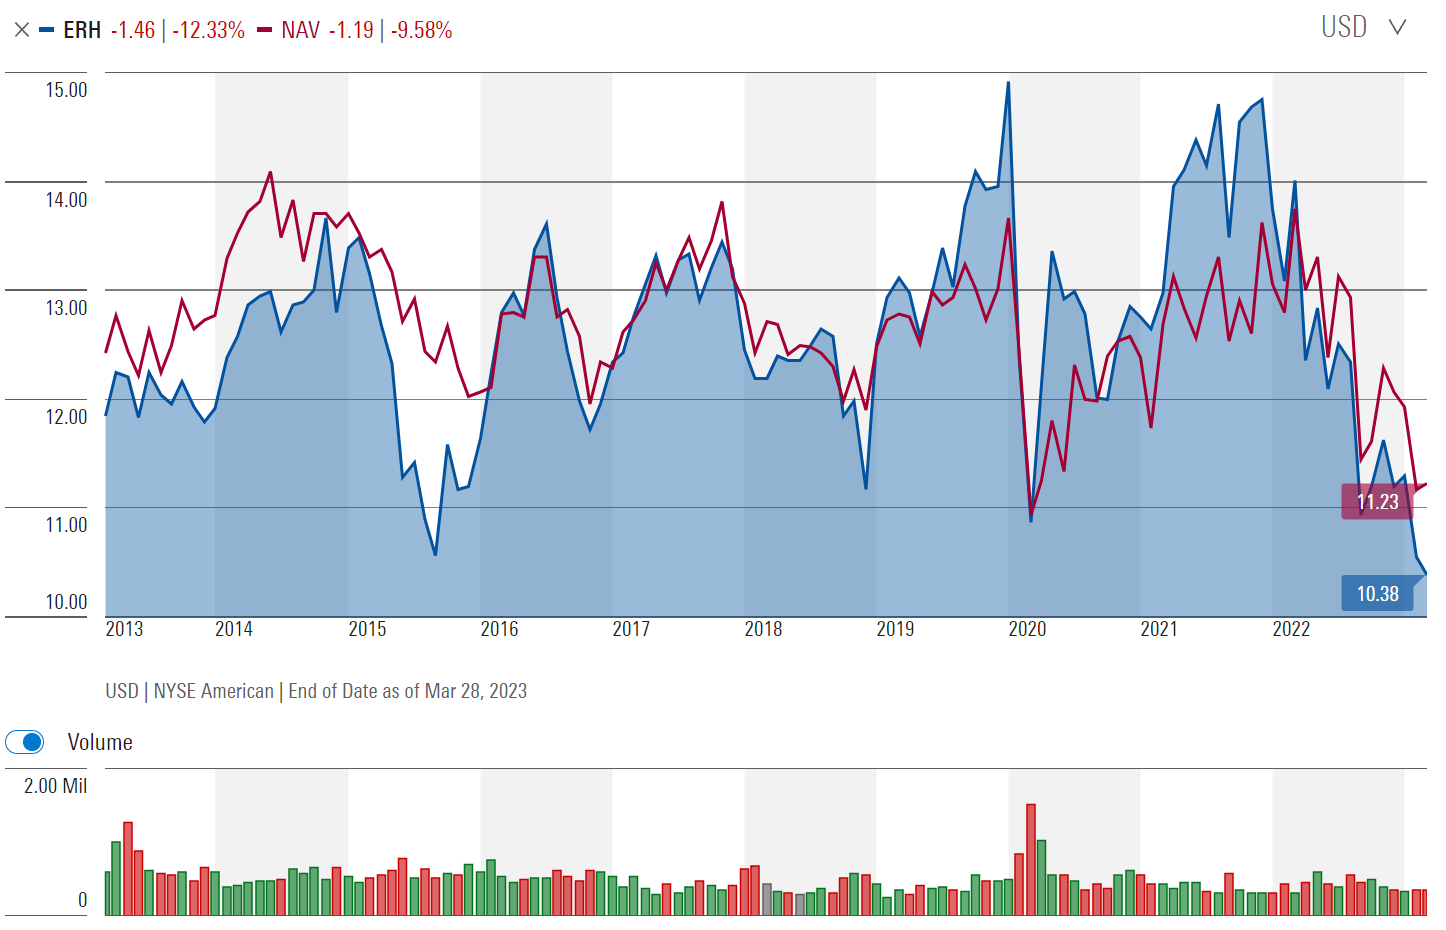
However, ERH's poor performance since late 2021 is worth monitoring, as the fund is paying an 8.0% of NAV distribution while only earning 3 and 5Yr average annual returns of 3.7% and 5.2% respectively.
ERH Vs. ETF Portfolio
Another way we can analyse the ERH fund is to see whether the fund adds any alpha relative to a simple model portfolio constructed from ETFs. For example, in figure 8 below, I have constructed a simple ETF portfolio with a 70% weight in the Utilities Select Sector SPDR ETF (XLU) and a 30% weight in the SPDR Bloomberg Barclays High Yield Bond ETF (JNK).
Figure 8 - Comparing ERH against a 70/30 portfolio of XLU/JNK (Author created with Portfolio Visualizer)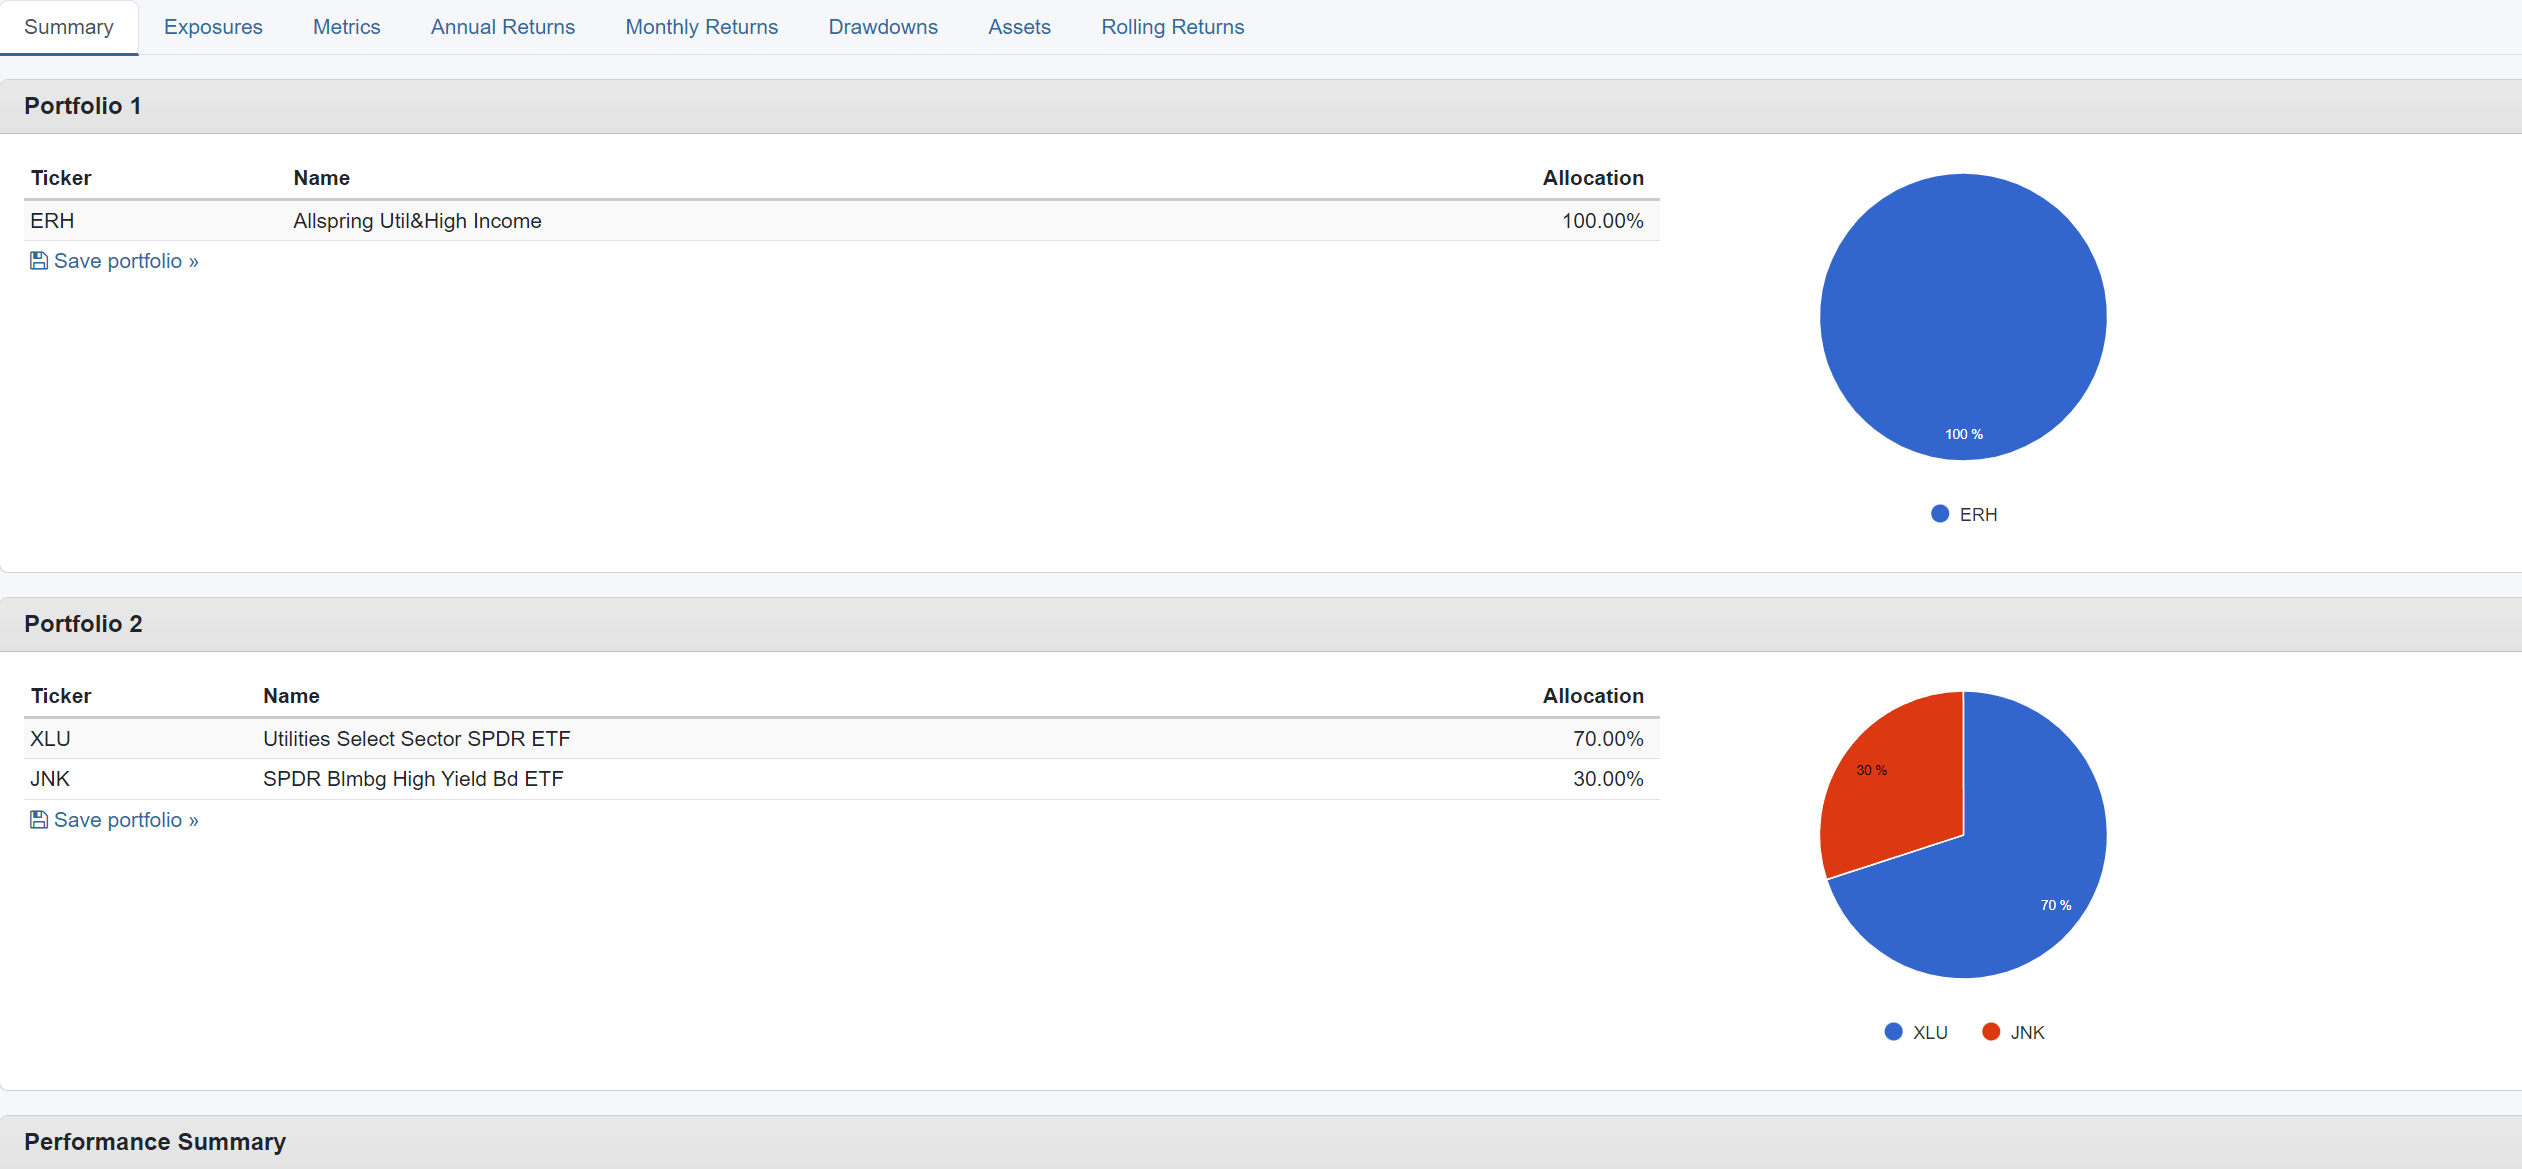
Using the analysis period January 2008 (JNK inception date) to February 2023, we see that the simple ETF portfolio has delivered 6.0% CAGR returns compared to 1.6% CAGR returns for the ERH fund. The ETF portfolio also had lower volatility of 12.6% vs. 21.0% for ERH, leading to much higher Sharpe Ratios (a measure of risk adjusted returns) for the ETF portfolio of 0.47 vs. 0.15 for ERH (Figure 9).
Figure 9 - XLU/JNK vastly outperforms ERH since inception (Author created with Portfolio Visualizer)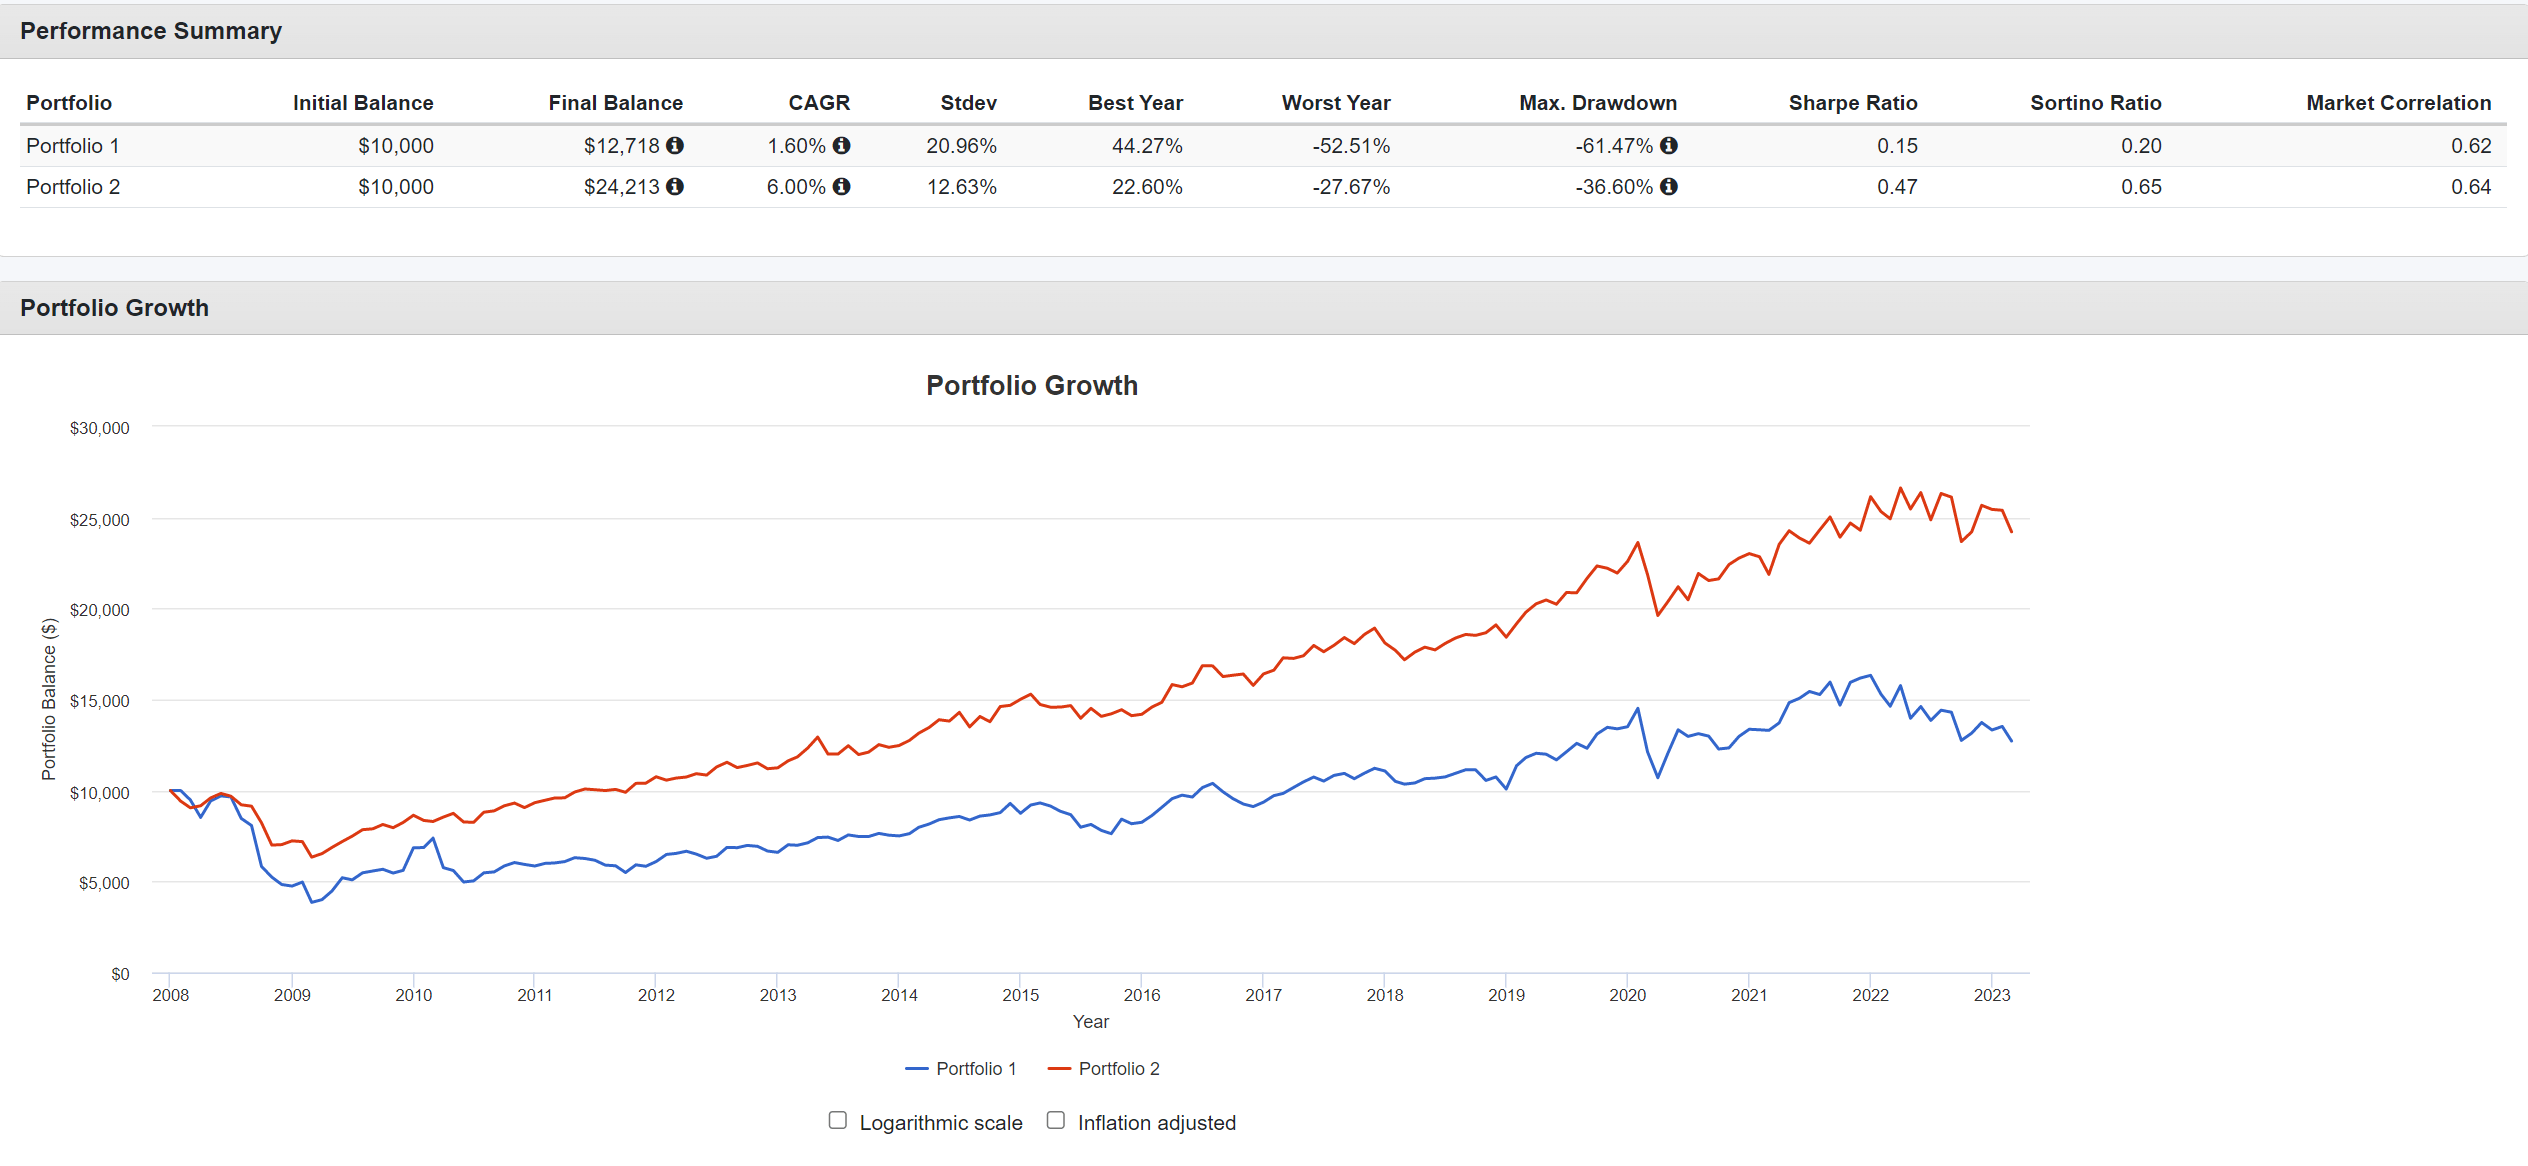
However, ERH's poor performance can be mostly explained by an abysmal 2008 when ERH lost 52.5%.
If we restrict our analysis to the past decade, from March 2013 to Feb 2023, then ERH's underperformance to the ETF portfolio is less severe, at 6.2% vs. 7.4% CAGR returns. However, ERH still has higher volatility of 16.1% vs. 12.0% for the ETF portfolio, leading to a Sharpe ratio of only 0.40 vs. 0.59 for the ETF portfolio (Figure 10).
Figure 10 - ERH underperforms XLU/JNK in the past decade (Author created with Portfolio Visualizer)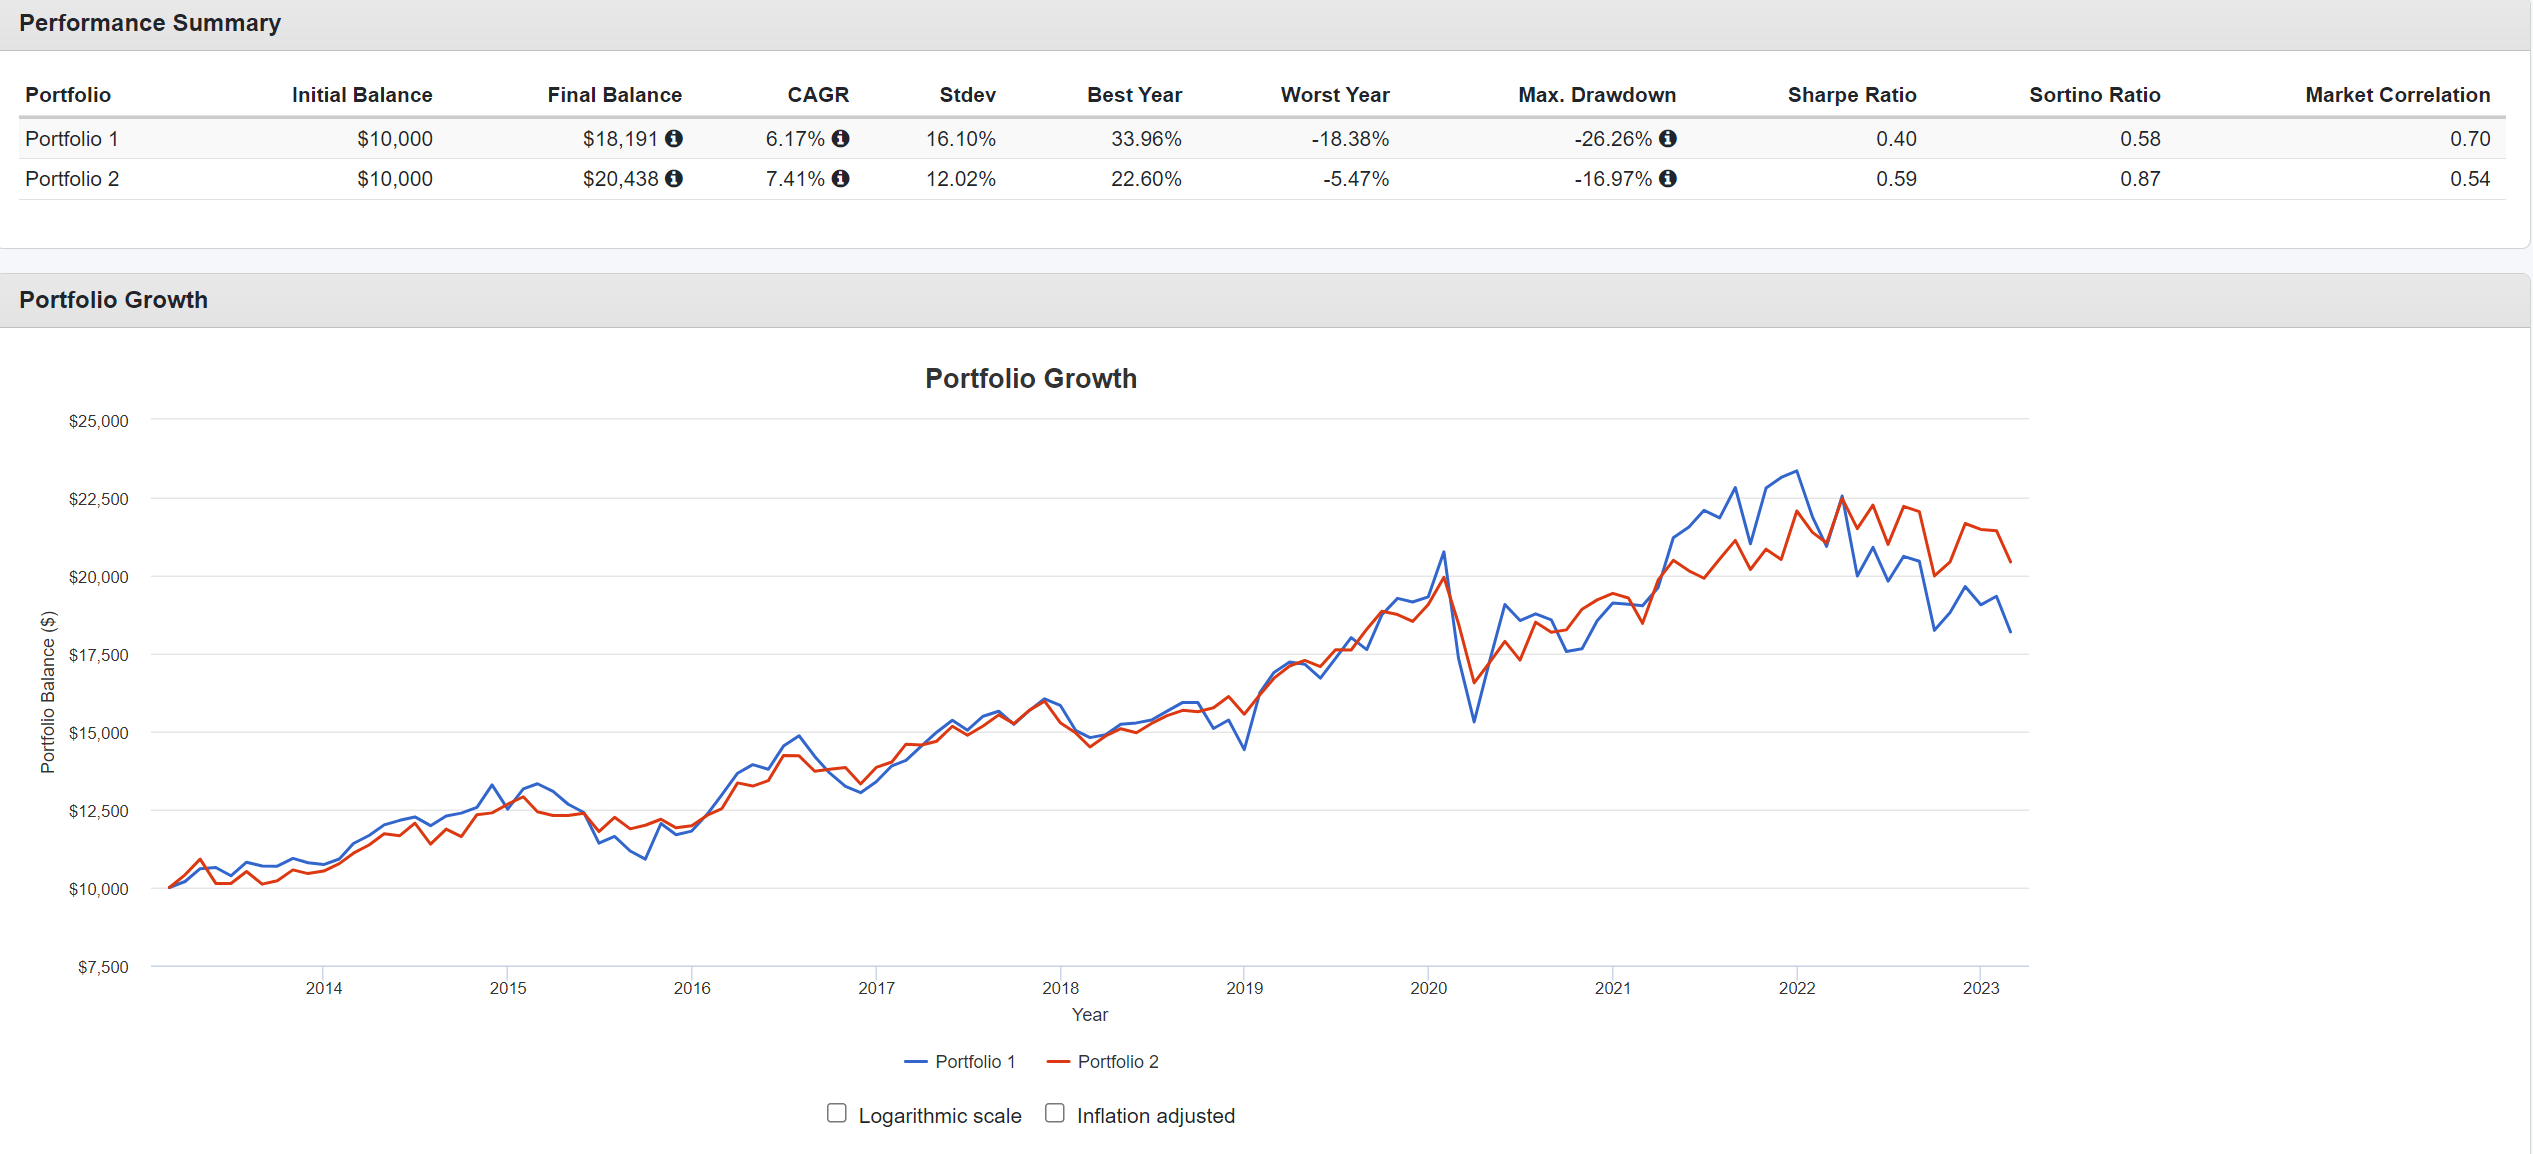
Conclusion
The Allspring Utilities and High Income Fund pays an attractive 8.7% trailing distribution, but has only delivered 5.2% and 6.4% average annual returns on a 5 and 10Yr time horizon. This raises a concern that the ERH fund does not fully 'earn' its distribution, as it is paying a distribution rate beyond what it earns.
Furthermore, from my analysis above, investors may be able to generate higher total returns by constructing a simple XLU/JNK portfolio and rebalancing it annually.
This article was written by

Disclosure: I/we have no stock, option or similar derivative position in any of the companies mentioned, and no plans to initiate any such positions within the next 72 hours. I wrote this article myself, and it expresses my own opinions. I am not receiving compensation for it (other than from Seeking Alpha). I have no business relationship with any company whose stock is mentioned in this article.