JEPQ: Not Great For Income But Still Good

Summary
- JEPQ is an actively-managed defensive equity fund benchmarked against the NASDAQ 100 with an options-generated monthly dividend stream.
- Although it achieves its stated goals, JEPQ underperforms the benchmark too much to justify itself as a high-yield income investment.
- However, JEPQ can help optimize the risk-return of an investor's existing growth equity portfolio, which is why I rate JEPQ as a "Buy".
Michael M. Santiago
Introduction
The COVID pandemic was life-changing for many of us. While it doomed my translation career, it blessed me with my second child and gave me the time to rethink my career goals. After making my first contribution to Seeking Alpha (my article about the Global X NASDAQ 100 Covered Call ETF (QYLD) you can find here) in May 2020, I made the decision to continue my education and pursue a new career in Finance. Now that I have completed that transition, I am happy to be back writing for the platform that started it all for me.
Mohamed Hassan
I was not the only one hard at work during the pandemic. May 2020 was also when J.P. Morgan Asset Management released the JPMorgan Equity Premium Income ETF (JEPI), an accessible ETF version of their JPMorgan Equity Premium Income Fund (JEPIX) that did away with the mutual fund's $1,000 minimum investment requirement. JEPI was a wild success attracting $12.9 billion in 2022 and beating the record for the biggest annual active inflow previously set by Cathie Wood's ARK Innovation ETF (ARKK) in 2020. Needless to say, with such a breakout performance by JEPI, it was only a matter of time before JP Morgan applied the successful strategy to something else.
JEPQ Overview
The JPMorgan Nasdaq Equity Premium Income ETF (NASDAQ:JEPQ) is the latest in JP Morgan's line of "Premium Income" offerings. As of February 28, 2023; it has an impressive 13.50% dividend yield with monthly distributions. However, the exact amount of each dividend can differ significantly as much of this income is derived from options premiums. Since JEPQ's inception in May 2022, monthly dividend amounts have ranged from $0.34 to $0.68, with an average dividend of $0.47.
JEPQ, like its siblings JEPI and JEPIX, is designed to provide current income to investors while maintaining the possibility of capital appreciation. The fund's managers pursue this goal by investing in an actively managed portfolio of:
- Equities primarily composed of NASDAQ 100-Index (NDX) companies
- Equity-linked Notes (ELNs) that track the performance of NDX by selling one-month, out-of-the-money call options
At least 80% of JEPQ's portfolio is invested in equity securities, including common stocks, ELNs, and other equity securities. Additionally, only up to 20% of the overall portfolio may be invested in ELNs. As of March 24, 2023; 16% of JEPQ's portfolio was invested in ELNs, and 1.5% was invested in non-equity securities including cash, money market funds, and the Prologis, Inc. REIT (PLD).
Other considerations include:
- All distributions paid by JEPQ are taxable as ordinary income unless held in a tax-advantaged investment plan. Consult with your financial advisor for details regarding your specific tax situation
- ELNs are sophisticated, illiquid, and often unsecured debt instruments. Although the probability that an ELN issuer will go under is extremely low (especially one that JP Morgan partners with), those uncomfortable with the recent bank turmoil may want to wait before investing in a fund that utilizes ELNs in lieu of traditional derivative instruments
Exploring the Portfolio
It is important to remember that while JEPQ is benchmarked against the NASDAQ 100 Index, the fund is not intended to provide the same return as the NDX in the way an index fund like the Invesco QQQ ETF (QQQ) does. Instead, the Fund seeks to provide a lower volatility level than the NASDAQ 100 for the amount of return it generates. Portfolio Manager Hamilton Reiner recently told Bloomberg about the team's preference for "steady eddies" when picking stocks for JEPI, and the same strategy is being used for JEPQ. When comparing sector exposure between JEPQ and the NASDAQ 100, we can see that the team has positioned the portfolio more defensively than the index most notably being significantly underweight technology equities and overweight communications.
Portfolio Sector Exposure of JEPQ and NASDAQ 100 Index
| Sector | JEPQ | NASDAQ 100 |
| Technology | 40.3% | 58.9% |
| Communications | 12.9% | 4.7% |
| Consumer Discretionary | 12.2% | 18.9% |
| Consumer Staples | 5.0% | 4.1% |
| Healthcare | 5.6% | 6.4% |
| Utilities | 1.3% | 1.2% |
JEPQ's top 10 holdings also differ significantly from the index. Four of its top 10 holdings, comprising 14% of the total portfolio, are ELNs used to generate income. While its top equity holdings almost match QQQ's ranked as a percentage of the overall portfolio, this can give a false impression that JEPQ follows the index closely. In fact, much of JEPQ's technology exposure is concentrated in these megacap positions, and the lower allocations versus the index are to accommodate income-generating investments.
Equity Position as % of Portfolio
| Symbol | JEPQ | QQQ |
| Microsoft (MSFT) | 10.49% | 12.51% |
| Apple (AAPL) | 9.35% | 12.29% |
| Alphabet (GOOG) | 6.35% | 7.55% |
| Amazon (AMZN) | 5.18% | 6.13% |
| NVIDIA (NVDA) | 4.15% | 5.19% |
Past Performance
At less than a year old, JEPQ is a very young fund. Therefore, it is difficult to determine whether any patterns identified will have long-term staying power. That being said, has the Fund achieved its three primary goals thus far? Namely, provide current income, maintain defensive equity exposure, and experience lower volatility than the NASDAQ 100.
Regular but unstable income
The first and most straightforward is whether JEPQ has provided current income. As previously mentioned, the Fund has paid an average monthly dividend of $0.47 in the first week of each month since June 2022. Put simply - yes, investors have received a high-yield stream of dividends. However, the stability of those dividends is subject to stock market volatility influencing prices in the options market, as is often the case with options-driven income strategies. Since the ELNs in the JEPQ portfolio function similarly to covered calls (an options writing strategy I explain in my QYLD analysis), they tend to collect higher premiums when volatility is higher and lower premiums when the market is more stable. Investors that require a minimum monthly dividend should not rely on JEPQ's dividends alone.
Lower Peaks, Higher Valleys
Second, does the pattern of JEPQ returns reflect a defensive interpretation of the NASDAQ 100? The answer here is also "yes." As seen in the chart below, the Fund generally follows the direction of the index with a positive correlation of 0.715, but it reaches lower peaks and generally higher valleys. While this pattern is stressed at the extremes, we can observe JEPQ's day-to-day movements are less pronounced with smoother long-term trendlines.
NDX vs JEPQ Total Return Growth of $10,000 Investment and Correlation

Consistently lower volatility
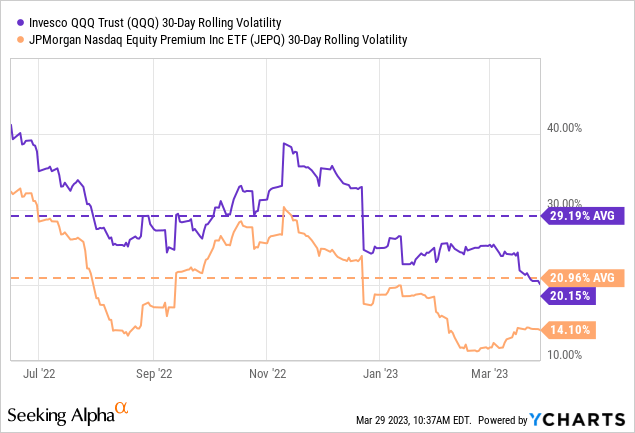
Third, does JEPQ experience less volatility than NDX? JEPQ successfully achieves this goal as well, with approximately 9% less average annualized volatility on a 30-day rolling basis. This gap tends to grow wider during periods of lower market volatility and shrink during periods of higher market volatility.
QQQ vs JEPQ Annualized 30-Day Rolling Volatility and Average Volatility
The Fund looks promising, having successfully achieved its stated goals thus far, but it is not time to reach for that buy button just yet. As we all know, there is no such thing as a free lunch.
JEPQ Risks
Options overlay creates negative convexity of returns
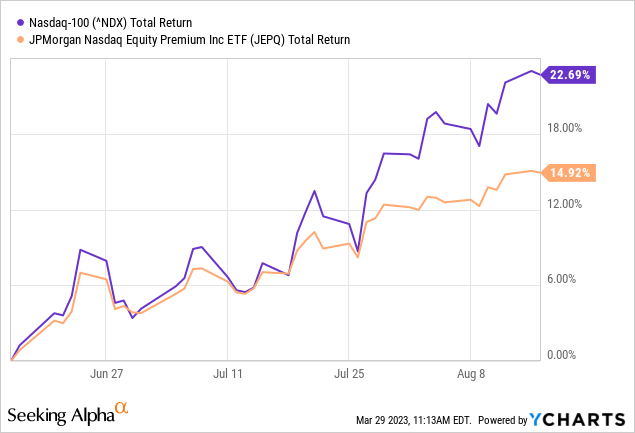
Part of the appeal of a covered call strategy is the stabilizing force that the income it generates provides for a portfolio. Unfortunately, the cost of the protection is giving up any capital appreciation from price growth that exceeds the strike price of the option. This becomes especially apparent in extended periods of growth as the underlying asset's price overtakes the sum of the collected premium and strike price. Extended growth periods generally also experience lower volatility, adversely affecting the amount of income selling call options can produce.
In the graph below, we can observe the latest example of this that occurred between June and August of last year. As price appreciation continued, the index began to pull away, resulting in a difference of 7% in total return during the three months. In this scenario, JEPQ captured 65.8% of the upside growth.
NDX vs JEPQ Trough to Peak Total Return % Growth Jun 2022 - Aug 2022
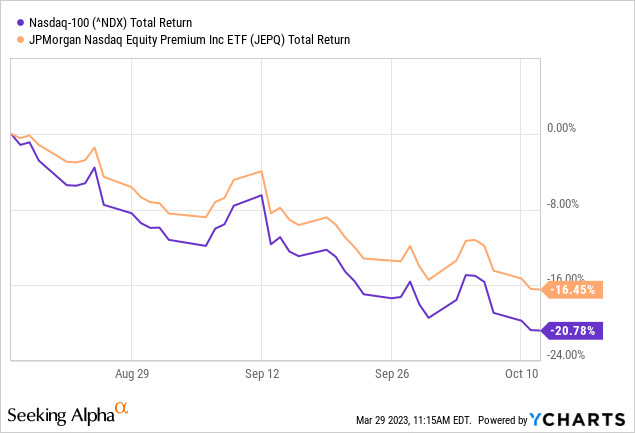
Covered call strategies also struggle during extended periods of price depreciation in much the same way. The stabilizing effect income provides becomes less significant as the value of the underlying asset approaches and exceeds the collected options premium. Even though downtrends in the market are associated with higher levels of volatility, the higher premiums collected for options cannot proportionally offset capital losses. As the value of the NDX decreased beyond the collected premium during August and October of last year, JEPQ began to move in line with the index with the same speed and magnitude. In this scenario, the difference in total return was 4% during the three months, and JEPQ captured 79.2% of the downside loss.
NDX vs JEPQ Peak to Trough Total Return % Growth Aug 2022 - Oct 2022
This uneven return profile is a shared characteristic among funds incorporating derivatives to generate income, and investors should be aware they pay the price for income and protection.
NDX is not the ideal environment for covered calls
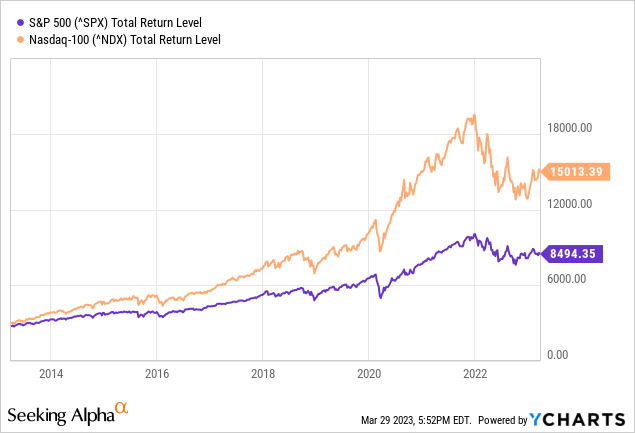
Options income strategies outperform the most when markets are choppy, erratically moving slowly in a long-term trend going in either direction. This allows funds to collect elevated premiums while being shielded from relatively minor market movements on any given month. This is why it is somewhat confusing to see a covered call strategy applied to the NASDAQ 100, an index simultaneously notorious for high-octane growth and dramatic falls. Compared to the S&P 500, such pronounced movements would seem disadvantageous. While I understand that the NASDAQ 100's higher volatility environment could create opportunities for more income during specific periods, sister fund JEPI and its portfolio of S&P 500 options appear better situated to execute its strategy successfully over the long term.
NASDAQ 100 vs S&P 500 10Y Performance (compare the magnitude of up and down movements)
Forward Analysis
JEPQ enriches but does not replace NDX exposure
Put simply, actively managed equity portfolios tend to underperform compared to the overall stock market. Eugene Fama and Kenneth French, the creators of the Fama-French three-factor model widely used in modern portfolio management, published a paper in The Journal of Finance in 2010 that studied the performance of actively and passively managed funds. They concluded that portfolio managers could often match market performance, if not slightly outperform the market, but net of management fees, many fall short. Additionally, the rare managers that could generate alpha could not maintain consistent outperformance over the long term. This is why the highest-performing actively managed fund in any given year can never hold onto the title the following year.
Ludde Lorentz
This does not mean active management is terrible. In fact, active management can shine when you need your investment to do something specific. However, investors should not expect JEPQ's equity portfolio to outperform the NASDAQ 100. JEPQ is not designed to replace your portfolio of tech stocks, but it can enrich it.
I do not recommend JEPQ as a standalone income investment. The JPMorgan Equity Premium Income ETF is better positioned to function as a source of high yield for an income-focused investor. That being said, I believe the best application of JEPQ in a portfolio is as an optimization of an investor's growth equity exposure, namely QQQ or a similar position, replacing 0-10% of the overall allocation based on their personal beliefs regarding the future performance of the stock market. This was the mean-variance sweet spot generating the highest returns for the average risk of a JEPQ+QQQ two-position portfolio based on the ten months of weekly returns data we have for JEPQ. Beginning June 2023, you can use Portfolio Visualizer to find the best JEPQ allocation in the context of your entire portfolio. The tool currently requires at least one year's worth of data to function.
Very bullish investors can forego JEPQ entirely. On the contrary, I am still somewhat pessimistic about the short-term prospects of the NASDAQ 100's tech-heavy index, but we should be close to the bottom. Therefore, I am rating JEPQ as a "Buy" and recommending a 3% allocation of JEPQ as a share of growth equity exposure.
Conclusion
I am a big fan of options-enhanced strategies. All of my articles on Seeking Alpha analyze funds that incorporate derivative instruments in some form. JEPQ was a difficult one for me to recommend, though, until I stopped thinking about it as an income play. I do not believe the NASDAQ 100 is the appropriate index for that. Nevertheless, JEPQ is at an attractive entry point for long-term investors seeking to optimize their existing growth equity portfolio. For income, look at JEPI instead.
Moving forward, I plan on revisiting QYLD as I have very different opinions on the Fund now. After that, I will do a head-to-head analysis to determine the better NASDAQ equity income fund. If you have any insights, questions, or suggestions for future coverage, please let me and the rest of the Seeking Alpha community know by leaving a comment. Thank you for reading, and follow me for more analysis in the coming months!
This article was written by

Disclosure: I/we have no stock, option or similar derivative position in any of the companies mentioned, and no plans to initiate any such positions within the next 72 hours. I wrote this article myself, and it expresses my own opinions. I am not receiving compensation for it (other than from Seeking Alpha). I have no business relationship with any company whose stock is mentioned in this article.