4 Recession-Ready REITs

Summary
- I just finished an updated article titled “The Answer is 9” and I referenced the fact that cap rates have risen faster than I’ve seen in my 30+ year career.
- I’m recommending a more cautious and tactical approach since certain REITs that have shortened duration of debt, increases their risk.
- Rates are much higher, so when the shorter-term debt is rolled over they may have difficulty refinancing the debt.
- Simply put, it boils down to survival of the fittest – the highest quality REITs can expect to have good access to capital during most all market cycles.
- Looking for a helping hand in the market? Members of iREIT on Alpha get exclusive ideas and guidance to navigate any climate. Learn More »

CreativaImages
I enjoyed reading Dane Bowler’s article this week highlighting the fact that “REIT underperformance over the past 10 years has been the result of multiple contraction while broader market multiples expanded.”
My fellow contributor explained that “REITs simply delivered a significantly smaller positive return with a price change of +90% since the start of 2013 compared to +175% for the S&P.”
Bowler explained that “REITs actually outperformed fundamentally over the rising rate cycle, with slightly higher earnings growth (FFO/share growth versus EPS growth of the S&P). Therefore, this is a price disparity that is NOT backed up by fundamentals and is thus likely to result in a reversion.”
I agree with 99.9% of Bowler’s arguments which are extremely logical and thought-provoking, as his key evidence to support the bullish piece was centered on the fact that “over the past 10 years, the S&P multiple has expanded by 22.8% while the REIT multiple has contracted by 20.1%.”
I just finished an updated article titled “The Answer is 9” and I referenced the fact that cap rates have risen faster than I’ve seen in my 30+ year commercial real estate career.
As shown below, CBRE conducted a survey at the end of 2022 which captured 3,600 cap rate estimates across more than 50 geographic markets to generate key insights from a wealth of data.

CBRE
As you can see (above) through the first six months of 2022 the average cap rate for these four sectors was around 6.5% and I suspect that figure is closer to 8% today (across all property sectors).
Especially when you consider other property sectors such as lodging and the fact that office REITs are now trading at a significant discount to NAV, that reflects investor concerns about falling property values and slower rent growth.
So, while I argue with most of Bowler’s thesis – that REIT’s are cheap – the rapid cap rate increases are putting a squeeze on many of the lower quality REITs that don’t have the ability to navigate this new paradigm.
At the end of the day, REIT investing is about spread investing, and the companies that will thrive and create real economic value for their shareholders are the ones that invest capital at rates of return that exceed their cost of capital.
In general, if the REIT can achieve lower volatility than its peers’, the cost of capital will be slightly lower. In addition, a REIT borrows money to finance acquisitions and the cost of debt is a critical part of the value creation process.
We’re already beginning to see lower quality REITs succumb to this new environment. As we forecasted, Gladstone Commercial (GOOD) was forced to cut its dividend due to an elevated cost of capital and elevated payout ratio.
Seeking Alpha
As debt maturities roll off, we believe that many of the lower quality REITs (like GOOD) will be caught swimming naked.
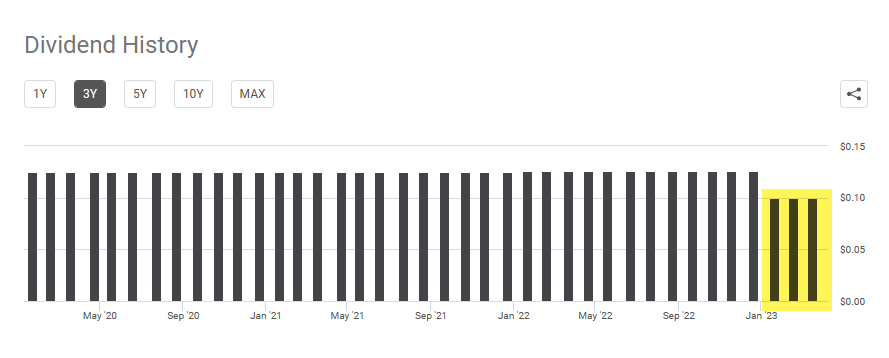
Another lower quality REIT we’re tracking is Easterly Government (DEA), as the company recently introduced 2023 FFO guidance indicating a 10.6% y/y decline, which leads to an AFFO payout ratio that exceeds 100%. We believe a dividend cut is judicious given limited growth prospects.
FAST Graphs
So, the point I’m making here is that cap rates could approach 9% by the end of 2023, and while valuations are cheap in REIT-dom, it’s important to pay very close attention to cost of capital which is critical for determining value creation and for evaluating strategic investment decisions.
Now, let’s take a look at 4 “recession-ready” REITs…
Realty Income (O)
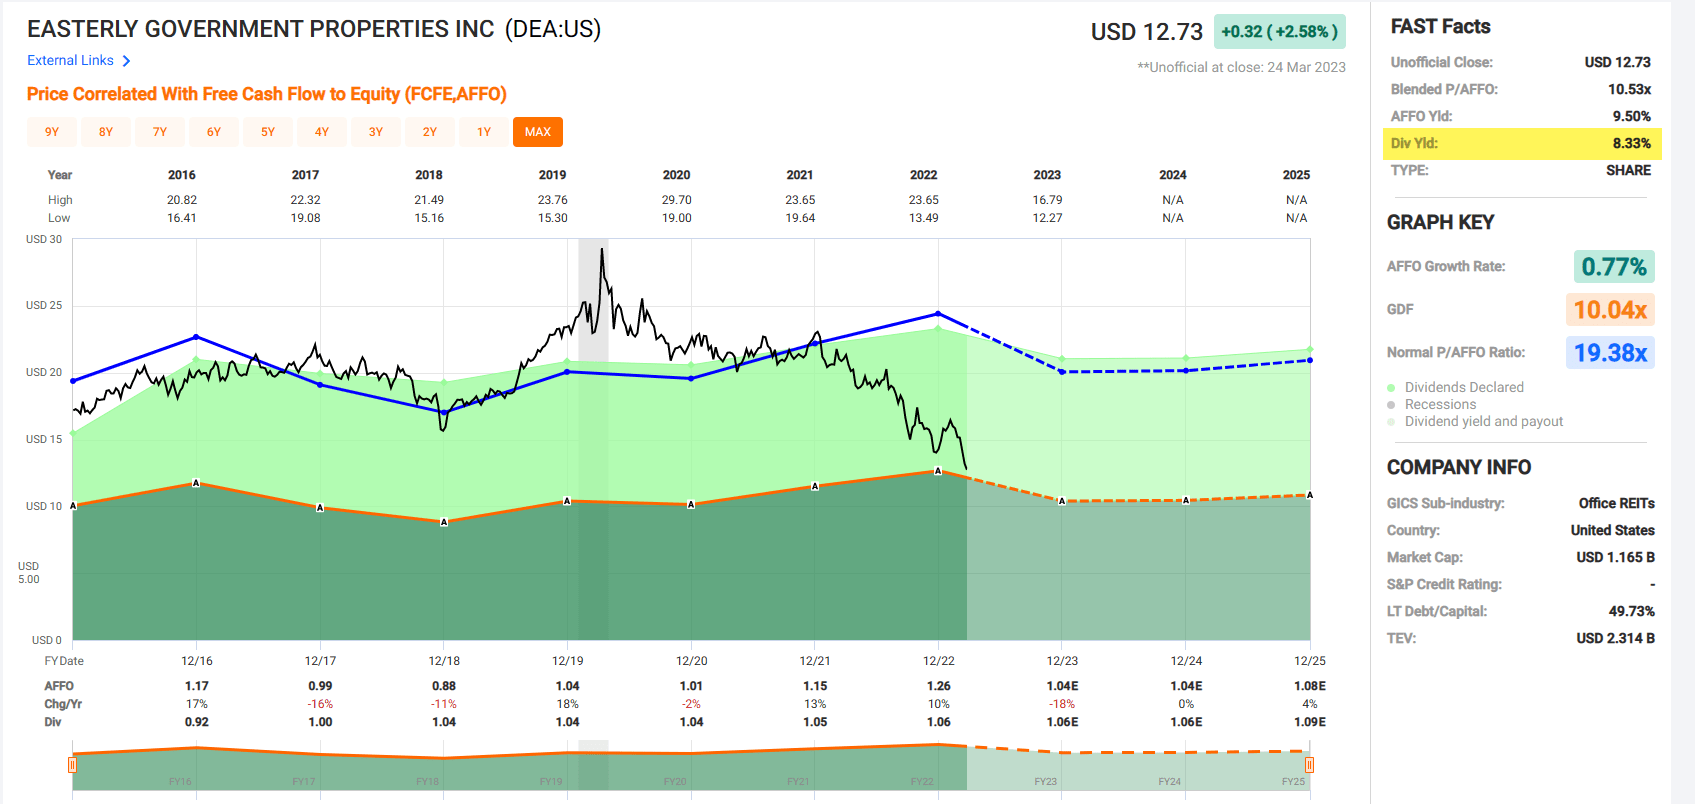
Realty Income is a net lease REIT with a track record of paying and increasing dividends for over 28 consecutive years in a row (632 monthly dividends declared).
This royal REIT has a fortress balance sheet (A- rated) with rock-solid credit metrics: 5.3x net debt to annualized Adj. EBITDAre, 5.2x fixed charge coverage ratio, 30% debt to total market cap.
O is one of the most predictive REITs on the planet, having generated positive earnings (AFFO per share) for 26 out of 27 years in a row. In addition, O has generated 5% growth (AFFO/sh) since 1995 (listing) regardless of size.
FAST Graphs
As seen above, analysts are forecasting modest growth in 2023 of 2%; however, 2024 and 2025 are more in-line with historical trends (4% and 5%). The company has guided conservative acquisitions in 2023 of $5 billion, however, we believe that number could be much higher.
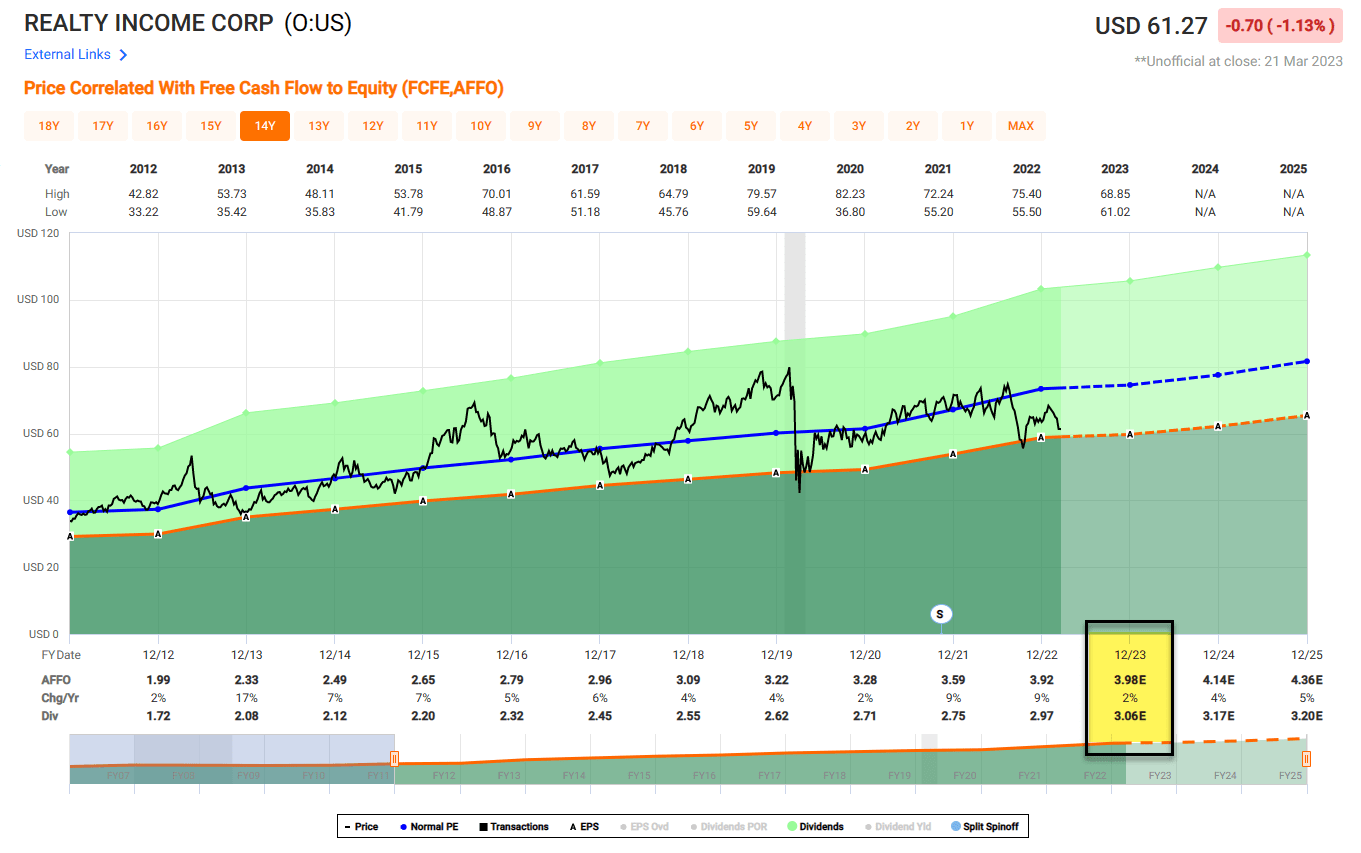
Nonetheless, even with modest growth this year, O shares are worth owning – trading at $61.27 with a P/AFFO multiple of 15.6x. The dividend yield is 5.0% and well-covered with a payout ratio of 75.69%. iREIT maintains a BUY with a total return estimate of 20% annually.
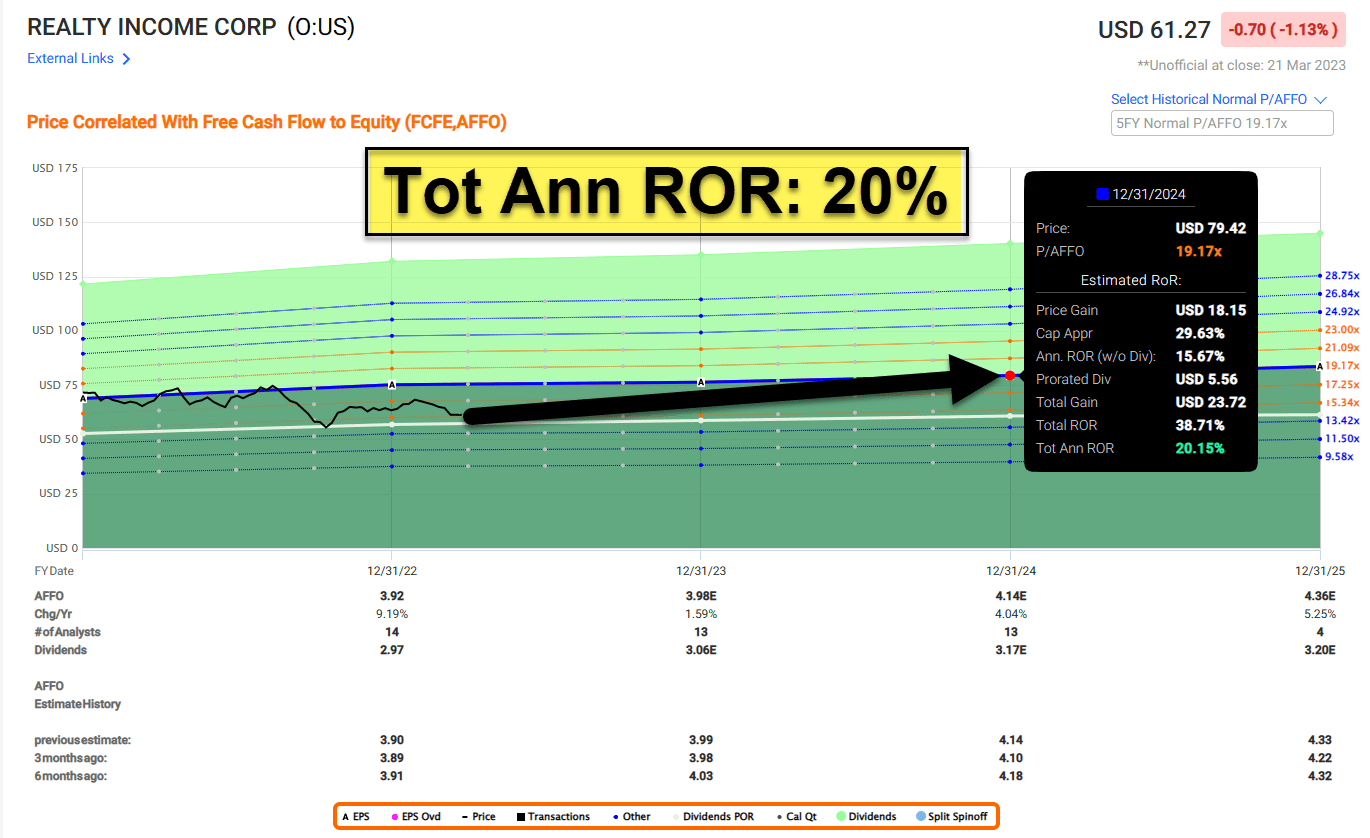
FAST Graphs
Essex Property Trust (ESS)
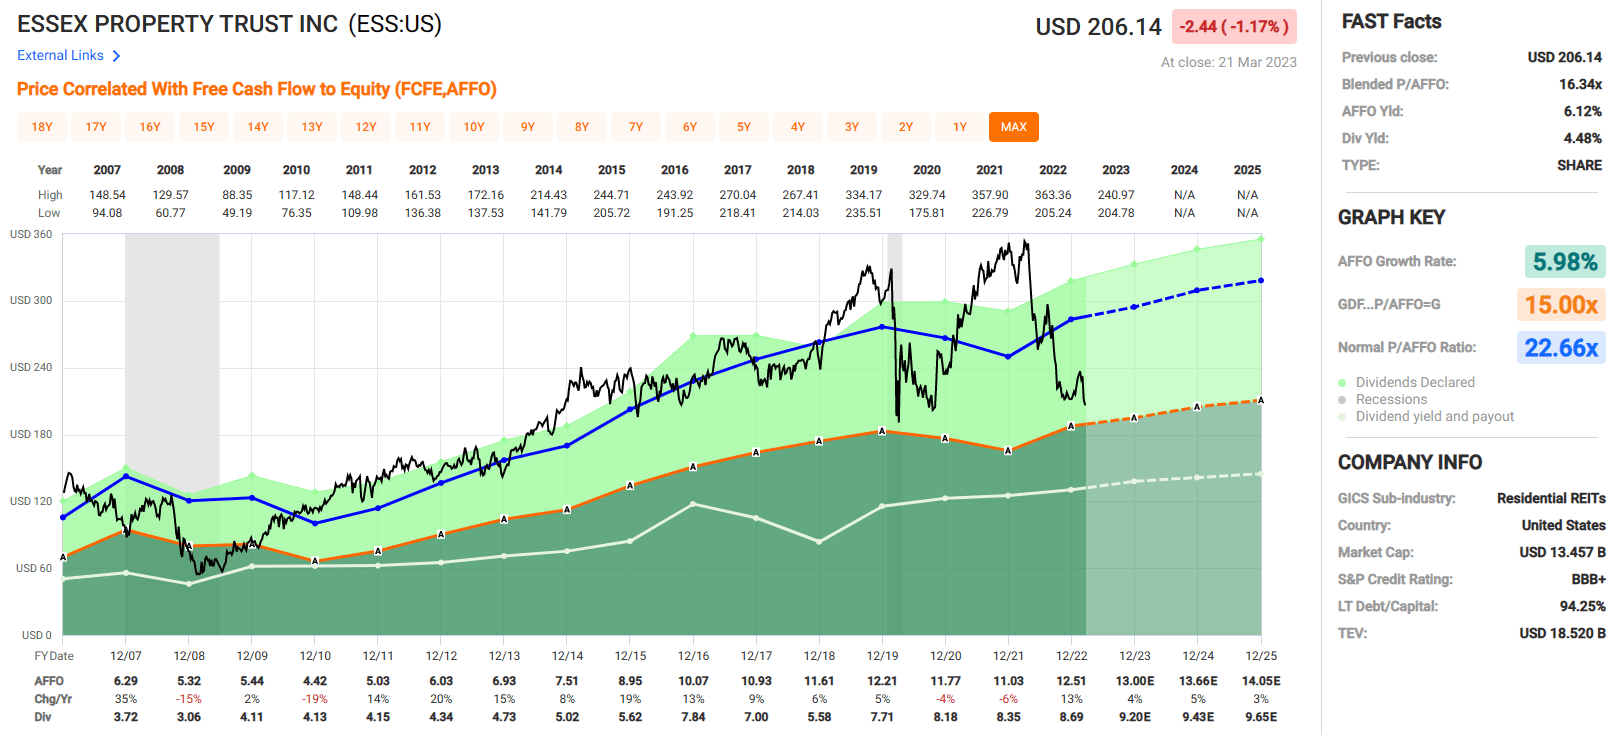
Essex Property is a multifamily REIT that is concentrated on the West Coast, including Southern California, San Francisco, and the Seattle metropolitan area. ESS is an S&P Dividend Aristocrat with a 29-year track record of increasing cash dividends.
This royal REIT has strong credit metrics with a 5.6x net debt to adjusted EBITDAre, a 5.8x fixed charge coverage ratio, a BBB+ credit rating by S&P, and $1.3 billion in total liquidity.
ESS has consistently increased its AFFO per share over the years. Out of the last 16 years ESS has only had a year-over-year decrease in AFFO 4 times and they have an AFFO growth rate of 5.98% since 2007.
FAST Graphs
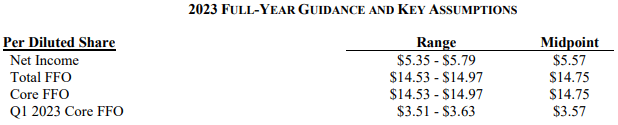
In their latest earnings release ESS initiated its 2023 guidance. Their guidance for total FFO comes in between $14.53 to $14.97 for a midpoint of $14.75 and their guidance is the same for core FFO. In 2022 their FFO came in at $14.51 per share. The 2023 midpoint of $14.75, would represent a 1.65% year-over-year increase in FFO.
ESS
While FFO growth in 2023 is expected to be modest, the projections for AFFO growth is more in-line with historical growth rates. Analysts expect AFFO growth of 4% in 2023 and 5% in 2024.
ESS has delivered strong growth rates over the long term for both FFO and AFFO. ESS is trading at levels not seen since the pandemic. It has a P/AFFO of 16.34x which is well below their normal P/AFFO of 22.66x.
Additionally, they pay a 4.48% dividend yield that is well-covered with an AFFO payout ratio of 69.46%. iREIT maintains a STRONG BUY with a total return estimate of 27% annually.

FAST Graphs
Federal Realty (FRT)
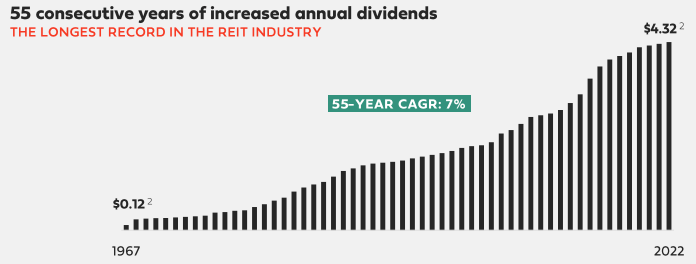
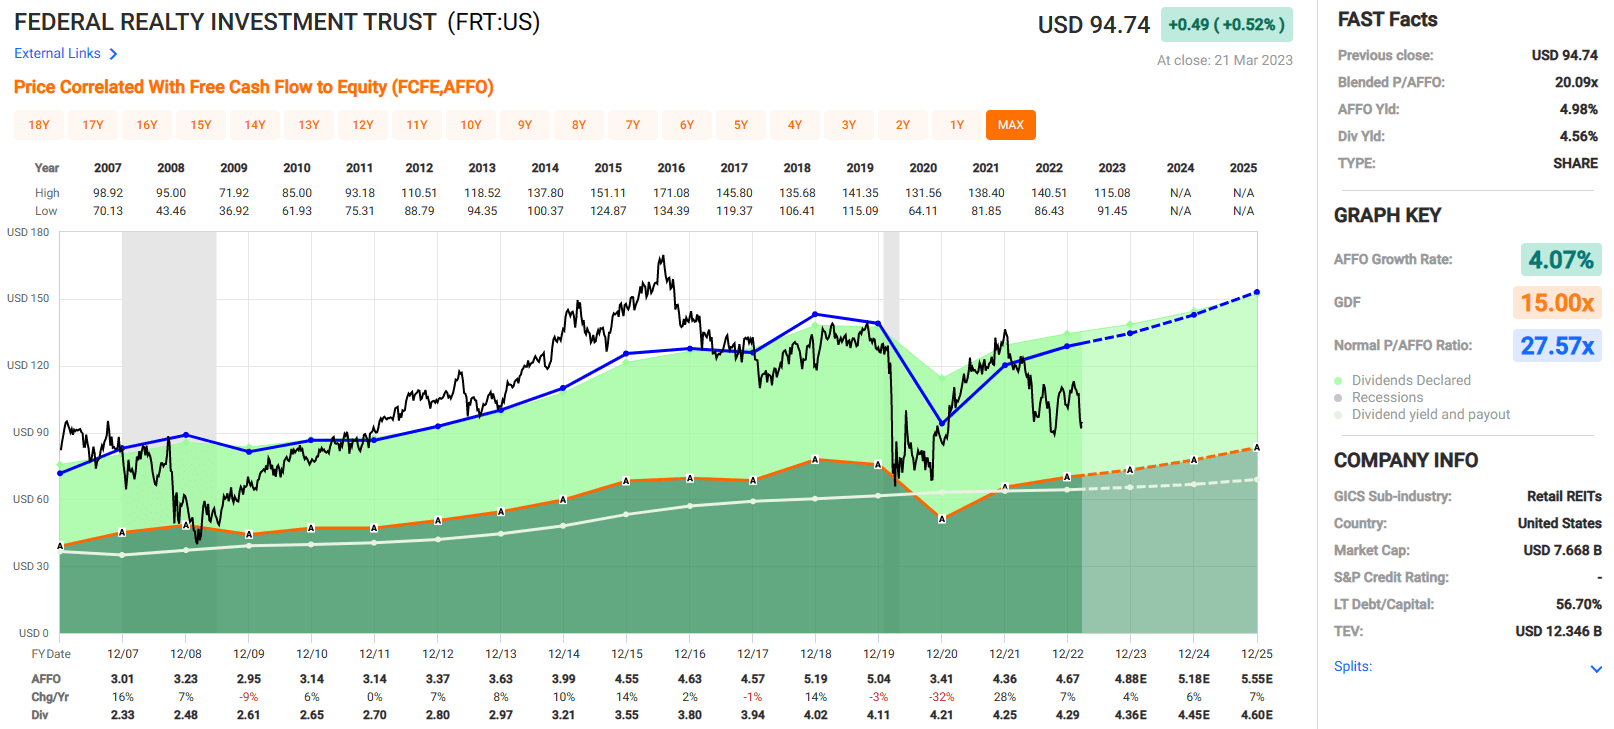
Federal Realty is a primarily a shopping center REIT that has 103 properties which include 3,300 commercial tenants and 3,000 residential units for a total of 26 million square feet of real estate. FRT has the best dividend track record of any REIT with 55 consecutive years of dividend increases, going back to 1967.
FRT - Presentation
This royal REIT has a BBB+ credit rating and solid credit metrics with a 6x annualized net debt to EBITDA and a 4x fixed charge coverage ratio. 86% of their debt is fixed rate and FRT had $1.3 billion in total liquidity as of December 31, 2022.
FRT has an excellent track record of increasing its AFFO per share. Since 2007, over the last 16 years, FRT has increased AFFO per share in every year except for four.
Over this time period FRT has an average AFFO annual growth rate of 4.07%. The average FFO growth rate would be higher if not for the significant decline of -32% that occurred in 2020. The following year, earnings rebounded and FFO increased 28%.
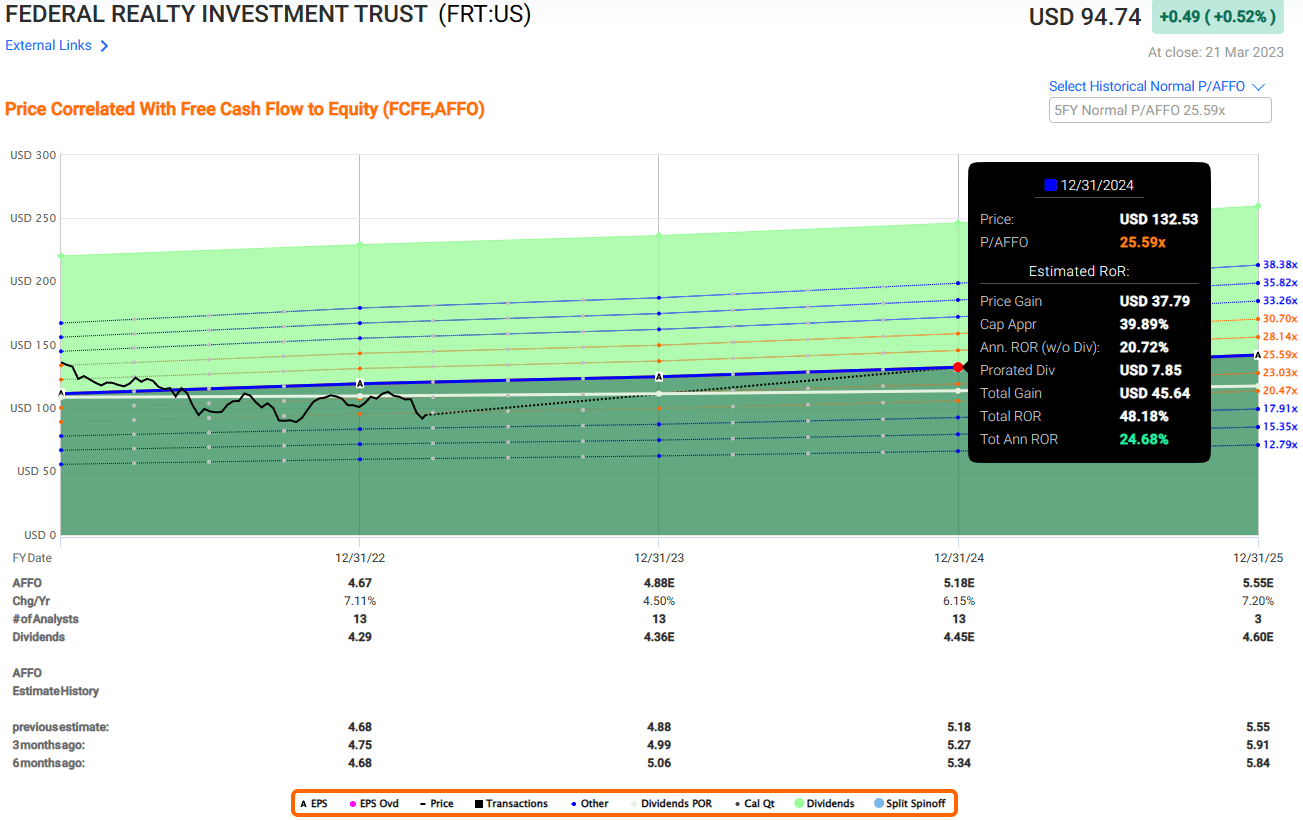
FAST Graphs
As seen above, analysts are forecasting AFFO growth in 2023 of 4%, in 2024 AFFO is expected to grow by 6%, and in 2025 analysts expect AFFO to increase by 7%.
The company recently released its 2023 guidance and projects FFO per diluted share to come in between $6.38 to $6.58. The midpoint of $6.48 would represent a 2.5% year-over-year increase in FFO.
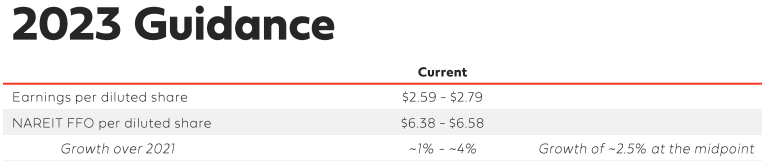
FRT
Currently FRT is trading at a P/AFFO of 20.09x which is a discount to their normal P/AFFO of 27.57x. They pay a 4.56% dividend yield that is covered with a 2022 AFFO payout ratio of 91.86%.
Now this payout ratio is on the high side, but it’s worth pointing out that it has been improving since 2020. In 2020 FRT’s payout ratio was 123.46%.
It improved to 97.48% in 2021 and now sits at 91.86%. If earnings increase as expected, this should take some pressure off the payout ratio and get it down to more reasonable levels. iREIT maintains a BUY with a total return estimate of 24% annually.
FAST Graphs
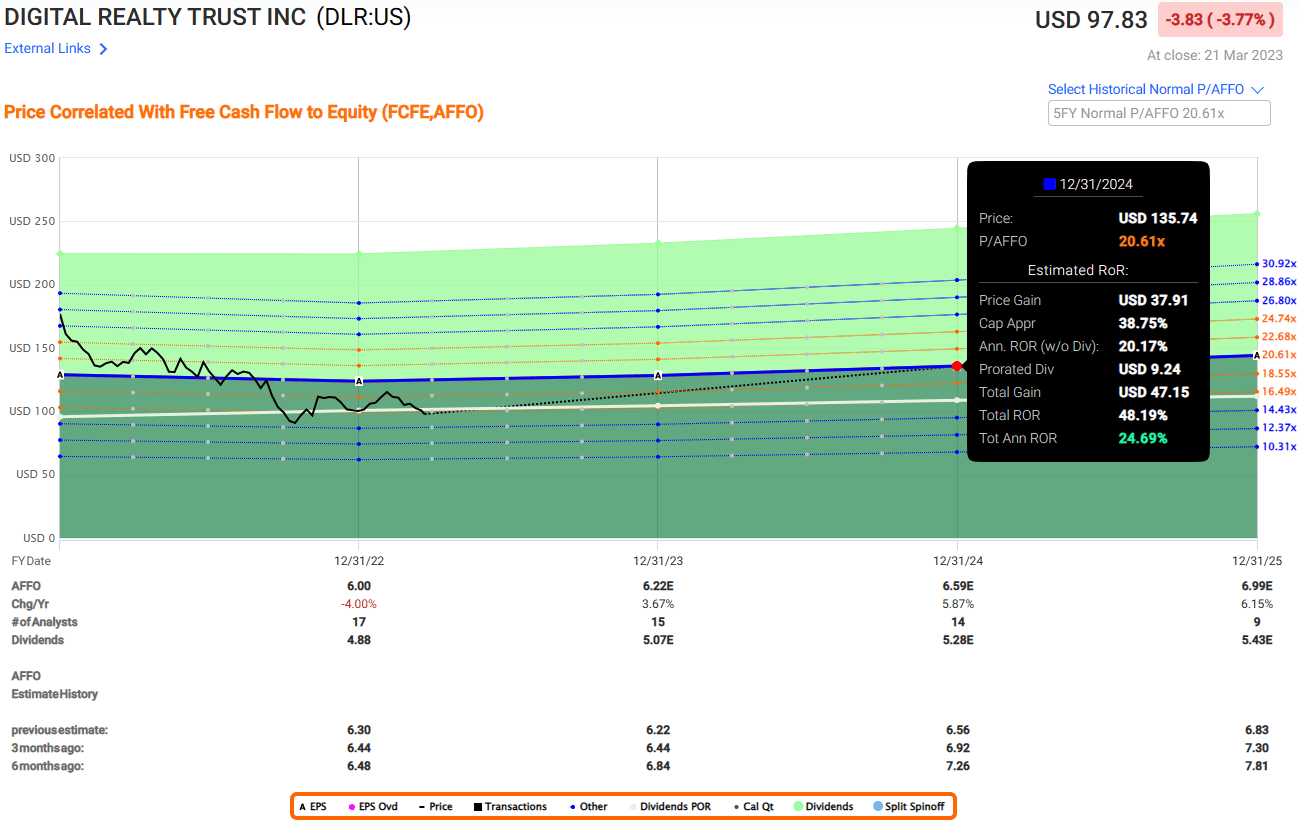
Digital Realty (DLR)
Digital Realty is a data center REIT that owns or has ownership interest in over 300 data centers that serves over 4,000 customers. DLR has an excellent track record of growing its dividend since 2005 as they have increased the dividend for 17 consecutive years and have a 10% compound annual growth rate.
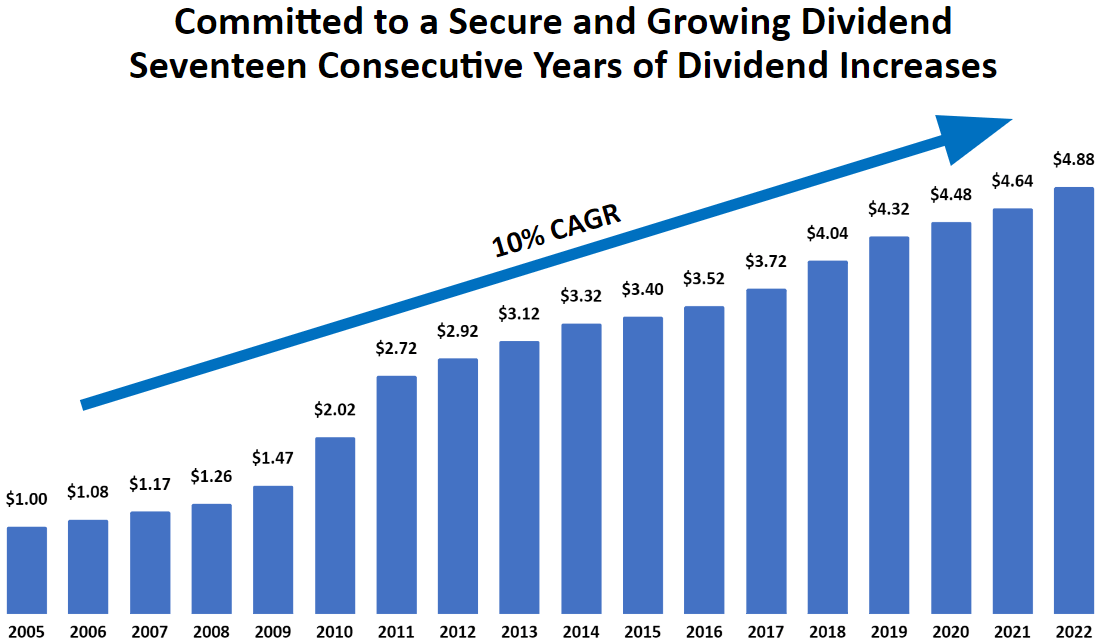
DLR - Dividend
This royal REIT has good credit metrics with a net debt to EBITDA of 6.9x, an interest coverage ratio of 5.3x, and a fixed charge coverage ratio of 4.9x.
They are investment-grade rated with a BBB credit rating from S&P. 81% of their debt is fixed rate and 97% is unsecured. Their weighted average to maturity is 5.2 years and their weighted average interest is 2.7%.
DLR has consistently grown its earnings (AFFO per share) since it went public. Its AFFO has only declined in 4 out of the last 16 years and overall, they have an average AFFO growth rate of 10.38% since 2007.
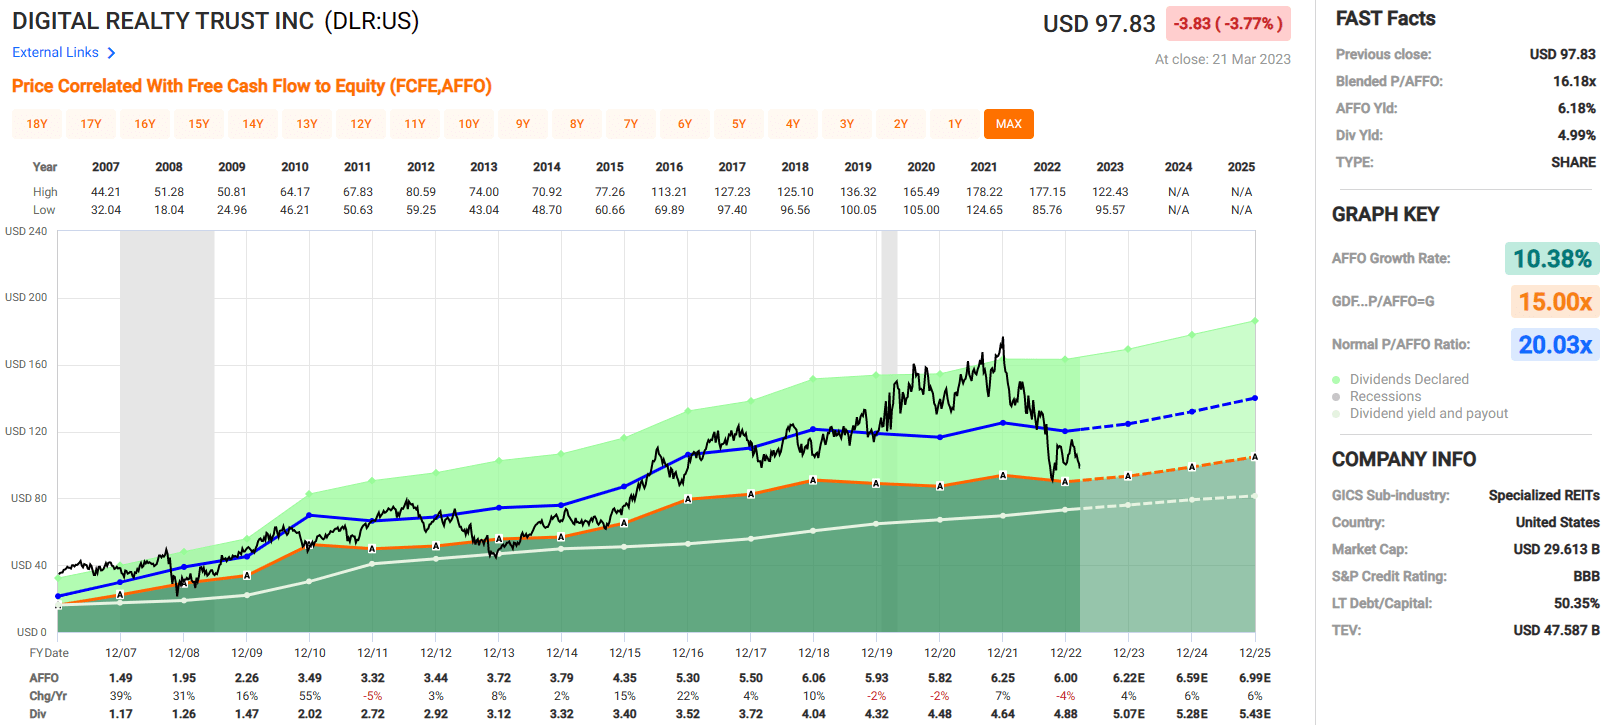
FAST Graphs
As seen above, analysts are forecasting AFFO to grow by 4%, 6%, and 6% in the years 2023, 2024, and 2025 respectively. DLR recently announced its 2023 guidance with FFO expected to come in between $6.65 - $6.75. The midpoint of $6.70 represents no growth in FFO from 2022 to 2023.
Even with the modest AFFO growth of 4% expected in 2023, DLR over the long-term has delivered excellent growth rates in both its FFO and AFFO. The dividend yield is just under 5% and is well-covered with an AFFO payout ratio of 81.33% iREIT maintains a STRONG BUY with a total return estimate of 24.69% annually.
FAST Graphs
In Closing…
Like Dane Bowler explained “once the rate hike cycle has ended, good news will once again be interpreted as good news. The looming fear will go away, and multiples will normalize. The FFO growth is already there. Outperformance merely requires a return to normal valuation.”
99.9% agree with that statement….
However, I’m recommending a more cautious and tactical approach since certain REITs that have shortened duration of debt, increases their risk. Rates are much higher, so when the shorter-term debt is rolled over they may have difficulty refinancing the debt.
Simply put, it boils down to survival of the fittest – the highest quality REITs can expect to have good access to capital during most all market cycles.
(As I referenced in my weekend blog, I'll be publishing an exclusive "Sweet 16 REIT" report this week for iREIT on Alpha members)
May the (dividend) force be with you!
Author's note: Brad Thomas is a Wall Street writer, which means he's not always right with his predictions or recommendations. Since that also applies to his grammar, please excuse any typos you may find. Also, this article is free: Written and distributed only to assist in research while providing a forum for second-level thinking.
Get My New Book For Free!
Join iREIT on Alpha today to get the most in-depth research that includes REITs, mREIT, Preferreds, BDCs, MLPs, ETFs, and we recently added Prop Tech SPACs to the lineup. Nothing to lose with our FREE 2-week trial.

And this offer includes a 2-Week FREE TRIAL plus my FREE book.
This article was written by

Brad Thomas is the CEO of Wide Moat Research ("WMR"), a subscription-based publisher of financial information, serving over 15,000 investors around the world. WMR has a team of experienced multi-disciplined analysts covering all dividend categories, including REITs, MLPs, BDCs, and traditional C-Corps.
The WMR brands include: (1) iREIT on Alpha (Seeking Alpha), and (2) The Dividend Kings (Seeking Alpha), and (3) Wide Moat Research. He is also the editor of The Forbes Real Estate Investor.
Thomas has also been featured in Barron's, Forbes Magazine, Kiplinger’s, US News & World Report, Money, NPR, Institutional Investor, GlobeStreet, CNN, Newsmax, and Fox.
He is the #1 contributing analyst on Seeking Alpha in 2014, 2015, 2016, 2017, 2018, 2019, 2020, 2021, and 2022 (based on page views) and has over 108,000 followers (on Seeking Alpha). Thomas is also the author of The Intelligent REIT Investor Guide (Wiley) and is writing a new book, REITs For Dummies.
Thomas received a Bachelor of Science degree in Business/Economics from Presbyterian College and he is married with 5 wonderful kids. He has over 30 years of real estate investing experience and is one of the most prolific writers on Seeking Alpha. To learn more about Brad visit HERE.Disclosure: I/we have a beneficial long position in the shares of FRT, ESS, O, DLR either through stock ownership, options, or other derivatives. I wrote this article myself, and it expresses my own opinions. I am not receiving compensation for it (other than from Seeking Alpha). I have no business relationship with any company whose stock is mentioned in this article.