Simmons First National: High Dividend Yield With A Flattish Earnings Outlook

Summary
- Macroeconomic factors provide a mixed outlook for loan growth. However, the high level of unfunded commitments gives a positive indication for loan growth.
- Due to the recent deterioration of the deposit mix, the deposit cost will be much higher this year relative to last year.
- The December 2023 target price suggests a high upside from the current market price.
- SFNC is offering a high dividend yield. The implied payout ratio is only 38%; therefore, the dividend appears secure.
- The unrealized losses on the securities portfolio are at a moderate level. Currently, they’re the major source of risk.
designer491
Earnings of Simmons First National Corporation (NASDAQ:SFNC) will likely increase slightly this year on the back of subdued loan growth. Further, the margin is likely to slightly expand this year despite the recent deposit mix deterioration. Overall, I'm expecting Simmons First National to report earnings of $2.12 per share for 2023, up by just 2.7% year-over-year. Compared to my last report on the company, I've reduced my earnings estimate as I've increased my operating expense estimate. The year-end target price suggests a high upside from the current market price. Further, SFNC is offering a high dividend yield for a bank-holding company. Therefore, I'm maintaining a buy rating on Simmons First National Corporation.
Margin Growth to Slow Down this Year
In a sudden reversal of its trend, the net interest margin contracted by three basis points in the last quarter, following an expansion of 58 basis points in the second and third quarters of 2022. The poor performance was attributable to a surge in deposit costs, which was partly due to the rising interest rates. Further, Simmons’ deposit mix continued to worsen during the last quarter as costly time deposits ballooned, which led to a surge in deposit costs.
SEC Filings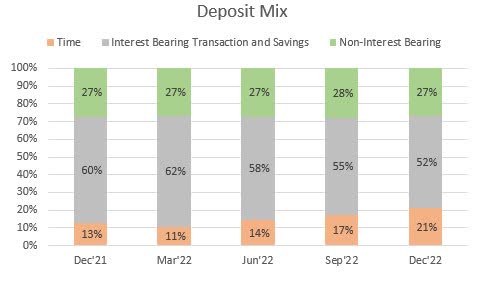
The deterioration of the deposit mix will most probably further boost the deposit cost in the first quarter of 2023 as the full quarter’s impact will be felt in this quarter.
The results of the management’s rate-sensitivity analysis given in the 10-K filing showed that a 200-basis points hike in interest rates boost the net interest income by 3.14% over twelve months.
2022 10-K Filing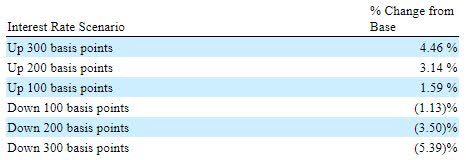
Considering the factors given above and the management’s rate sensitivity analysis, I'm expecting the net interest margin to grow by only five basis points in 2023 after surging by 28 basis points in 2022.
Loan Growth Outlook is Mixed
Simmons’ loan portfolio continued to grow strongly in the fourth quarter on the back of widespread growth across loan segments. Thanks to the strong organic growth in the latter part of 2022 and the acquisition of Spirit of Texas Bancshares in the second quarter, the loan portfolio surged by 35% last year.
Loan growth will most probably slow down this year because of high-interest rates. However, pipelines at the end of December 2022 were very strong, which means that high rates will take some time to hurt loan growth. Unfunded loan commitments stood at a high level of $5,000 million at the end of December 2022, up from $2,943 million at the end of December 2021, as mentioned in the earnings release.
Further, strong labor markets will sustain loan growth. Simmons First National operates in Arkansas, Kansas, Missouri, Oklahoma, Tennessee, and Texas. As the company's markets are quite diverse, I believe it's best to consider the national average when trying to gauge the loan demand. As shown below, the unemployment rate remains near record lows.
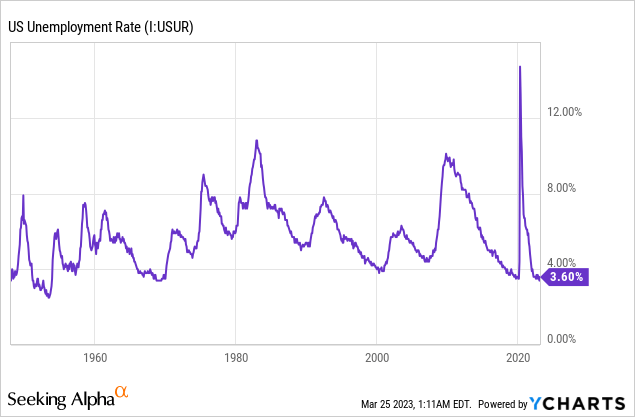
However, the Federal Reserve expects the unemployment rate to worsen considerably this year and jump to 4.5%.
Considering the conflicting factors discussed above, I'm expecting the loan portfolio to grow by 4% in 2023. Further, I'm expecting deposits to also grow by 4%. The following table shows my balance sheet estimates.
| Financial Position | FY18 | FY19 | FY20 | FY21 | FY22 | FY23E |
| Net Loans | 11,667 | 14,357 | 12,663 | 11,807 | 15,946 | 16,594 |
| Growth of Net Loans | 8.6% | 23.1% | (11.8)% | (6.8)% | 35.1% | 4.1% |
| Other Earning Assets | 3,136 | 4,537 | 7,200 | 10,123 | 8,098 | 8,262 |
| Deposits | 12,399 | 19,850 | 16,987 | 19,367 | 22,548 | 23,464 |
| Borrowings and Sub-Debt | 1,795 | 1,836 | 2,024 | 1,908 | 1,386 | 1,414 |
| Common equity | 2,246 | 2,988 | 2,976 | 3,249 | 3,269 | 3,287 |
| Book Value Per Share ($) | 24.2 | 30.2 | 27.0 | 28.4 | 26.3 | 25.8 |
| Tangible BVPS ($) | 14.1 | 18.3 | 16.2 | 17.4 | 14.6 | 14.4 |
| Source: SEC Filings, Earnings Releases, Author's Estimates(In USD million unless otherwise specified) | ||||||
Reducing the Earnings Estimate
The anticipated loan growth and slight margin expansion will lift earnings this year. On the other hand, inflation will push up non-interest expenses, which will restrict earnings growth. Operating expenses were already up by a high rate in the fourth quarter of 2022, which exceeded my expectations. It seems like I overestimated the management's ability to keep costs under control. Therefore, I've decided to raise my estimate for non-interest expenses for 2023.
Overall, I'm expecting Simmons First National to report earnings of $2.12 per share for 2023, up by just 2.7% year-over-year. The following table shows my income statement estimates.
| Income Statement | FY18 | FY19 | FY20 | FY21 | FY22 | FY23E |
| Net interest income | 553 | 602 | 640 | 592 | 717 | 804 |
| Provision for loan losses | 38 | 43 | 75 | (33) | 14 | 32 |
| Non-interest income | 144 | 198 | 240 | 192 | 170 | 175 |
| Non-interest expense | 392 | 454 | 485 | 484 | 567 | 617 |
| Net income - Common Sh. | 216 | 238 | 255 | 271 | 256 | 270 |
| EPS - Diluted ($) | 2.32 | 2.41 | 2.31 | 2.46 | 2.06 | 2.12 |
| Source: SEC Filings, Earnings Releases, Author's Estimates(In USD million unless otherwise specified) | ||||||
In my last report on Simmons First National, I estimated earnings of $2.34 per share for 2023. I've decreased my earnings estimate because I've increased my operating expense estimate.
Unrealized Losses are the Chief Source of Risk
Unrealized losses on available-for-sale (“AFS”) securities held during the period and AFS securities reclassified into held-to-maturity securities during the period, altogether amounted to around $800 million. To put this number in perspective, $800 million is 24% of the equity value at the end of December 2022.
If there's a deposit run à la the SVB Financial Group’s (SIVB) case, then SFNC might have to liquidate its security portfolio, which could turn the unrealized losses into realized losses. In such a case, the income statement will take a sizable hit. Further, it will have a negative effect on the company's fair value. This is because when losses are unrealized, there is an expectation that these losses will reverse once the interest rates start falling. However, once the losses are realized, there is no going back. The equity value is gone for good.
The above scenario is hypothetical, and I think that it's highly likely that it will never come to fruition. Simmons is different from SVB Financial in that it doesn't cater to the risky asset class of venture capital and doesn't have material exposure to California. Further, Simmons First National does not deal with crypto assets.
High Total Expected Return Calls for a Buy Rating
Simmons First National is offering a high dividend yield of 4.5% at the current quarterly dividend rate of $0.20 per share. The earnings and dividend estimates suggest a payout ratio of 38% for 2023, which is above the five-year average of 28%, but still easily sustainable. Therefore, I believe the dividend level is secure. Furthermore, Simmons reported a total capital ratio of 14.22% for the end of 2022, which is much higher than the minimum regulatory requirement of 10.50%. Therefore, there is no pressure from regulatory requirements to cut down on dividend payout.
I’m using the historical price-to-tangible book (“P/TB”) and price-to-earnings (“P/E”) multiples to value Simmons First National. SFNC stock has traded at an average P/TB ratio of 1.59x in the past, as shown below.
| FY18 | FY19 | FY20 | FY21 | FY22 | Average | |
| T. Book Value per Share ($) | 14.1 | 18.3 | 16.2 | 17.4 | 14.6 | |
| Average Market Price ($) | 29.4 | 24.9 | 18.9 | 29.2 | 24.7 | |
| Historical P/TB | 2.08x | 1.36x | 1.16x | 1.67x | 1.69x | 1.59x |
| Source: Company Financials, Yahoo Finance, Author's Estimates | ||||||
Multiplying the average P/TB multiple with the forecast tangible book value per share of $14.4 gives a target price of $23.0 for the end of 2023. This price target implies a 28.4% upside from the March 24 closing price. The following table shows the sensitivity of the target price to the P/TB ratio.
| P/TB Multiple | 1.39x | 1.49x | 1.59x | 1.69x | 1.79x |
| TBVPS - Dec 2023 ($) | 14.4 | 14.4 | 14.4 | 14.4 | 14.4 |
| Target Price ($) | 20.1 | 21.5 | 23.0 | 24.4 | 25.9 |
| Market Price ($) | 17.9 | 17.9 | 17.9 | 17.9 | 17.9 |
| Upside/(Downside) | 12.3% | 20.4% | 28.4% | 36.5% | 44.5% |
| Source: Author's Estimates |
The stock has traded at an average P/E ratio of around 11.0x in the past, as shown below.
| FY18 | FY19 | FY20 | FY21 | FY22 | Average | |
| Earnings per Share ($) | 2.32 | 2.41 | 2.31 | 2.46 | 2.06 | |
| Average Market Price ($) | 29.4 | 24.9 | 18.9 | 29.2 | 24.7 | |
| Historical P/E | 12.6x | 10.3x | 8.2x | 11.9x | 12.0x | 11.0x |
| Source: Company Financials, Yahoo Finance, Author's Estimates | ||||||
Multiplying the average P/E multiple with the forecast earnings per share of $2.12 gives a target price of $23.3 for the end of 2023. This price target implies a 30.1% upside from the March 24 closing price. The following table shows the sensitivity of the target price to the P/E ratio.
| P/E Multiple | 9.0x | 10.0x | 11.0x | 12.0x | 13.0x |
| EPS 2023 ($) | 2.12 | 2.12 | 2.12 | 2.12 | 2.12 |
| Target Price ($) | 19.0 | 21.2 | 23.3 | 25.4 | 27.5 |
| Market Price ($) | 17.9 | 17.9 | 17.9 | 17.9 | 17.9 |
| Upside/(Downside) | 6.4% | 18.2% | 30.1% | 41.9% | 53.7% |
| Source: Author's Estimates |
Equally weighting the target prices from the two valuation methods gives a combined target price of $23.1, which implies a 29.3% upside from the current market price. Adding the forward dividend yield gives a total expected return of 33.7%. Hence, I’m maintaining a buy rating on Simmons First National Corporation.
This article was written by

Disclosure: I/we have no stock, option or similar derivative position in any of the companies mentioned, and no plans to initiate any such positions within the next 72 hours. I wrote this article myself, and it expresses my own opinions. I am not receiving compensation for it (other than from Seeking Alpha). I have no business relationship with any company whose stock is mentioned in this article.
Additional disclosure: Disclaimer: This article is not financial advice. Investors are expected to consider their investment objectives and constraints before investing in the stock(s) mentioned in the article.