IWV: For Total U.S. Market Exposure, There Are Better Choices

Summary
- The iShares Russell 3000 ETF, as the name implies, uses the Russell 3000 Total Market Index as its investment strategy.
- The article will review that Index and the ETF in detail. Some comparisons to other Total Market ETFs are provided in the Portfolio Strategy section.
- Compared to five other TM ETFs, IWV comes in last across multiple time periods. For fans of the R3000 index, there is a lower-fee ETF available, the VTHR ETF.
- Looking for more investing ideas like this one? Get them exclusively at Hoya Capital Income Builder. Learn More »
franckreporter
(This article was co-produced with Hoya Capital Real Estate)
Introduction
My recent article VTI Vs. SPTM For Total US Equity Exposure looked at two ETFs investors could use as a "Core" holding. While that research found the iShares Russell 3000 ETF (NYSEARCA:IWV); it did not fare well against those two ETFs or others referenced as part of that article. It did point out the importance of fees though. So why this article? The difference in return over long periods were small and there are investors who like the Russell set of indices, with the R2000 being the most followed.
iShares Russell 3000 ETF review
Seeking Alpha describes this ETF as:
The investment seeks to track the investment results of the Russell 3000 Index, which measures the performance of the broad U.S. equity market. IWV started in 2000.
IWV has $10.3b in AUM and shows a TTM yield of 1.52%. Of all the Total Market ETFs mentioned anywhere in this article, at 20bps, IWV has the highest fees!
Index review
FTSE Russell provide a small description of the index.
The Russell 3000 Index measures the performance of ~3000 stocks and includes all large-cap, midcap and small-cap US equities, along with some microcap stocks. The combined market capitalization of these stocks represents 98% of the value of all US equities. Investors seeking to capture a strategy reflecting broad US equities performance can confidently choose the Russell 3000 knowing there are no subjective inclusions or exclusions of stocks. Like all Russell Indexes, the Russell 3000 is fully reconstituted once a year to ensure accurate reflection of the targeted market segment.
Source: ftserussell.com R3000
Holdings review
Starting with sectors, the asset counts and weights are:
ishares.com; compiled by Author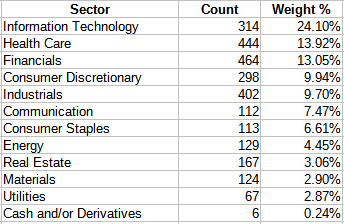
To show the influence of the stocks held by a Large-Cap ETF like the SPDR S&P 500 ETF (SPY), the top seven sectors are in the exact same order and none of the weights vary by much; 2% tops. That is also shown when viewing the Top 20 holdings.
ishares.com; compiled by Author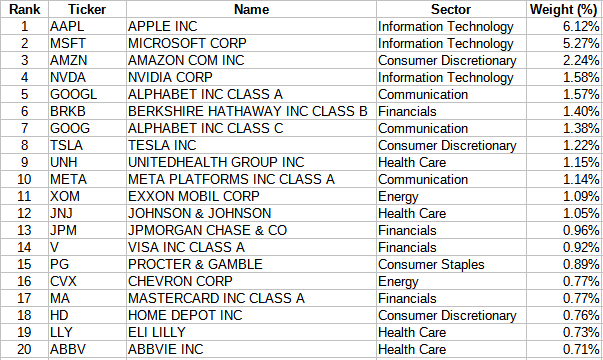
These stocks, even with 3000 in the portfolio, still account for almost 32% of the weight. The bottom half of the portfolio, by weight, are only 2% in total, with 1300 stocks listed with a weight of 0.00%! The Top 500, which might match SPY's holdings well, comes to 87+% of IWV's holdings. Thus the comment; IWV is a Large-Cap ETF: expanded.
Distribution review
seekingalpha.com IWV DVDs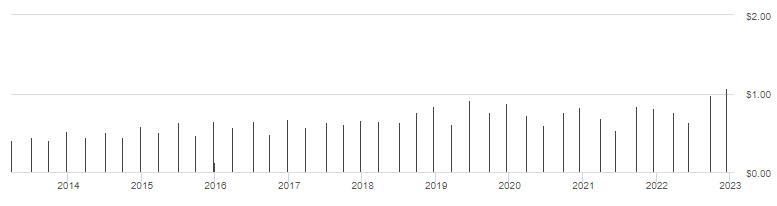
Thanks to the 2022 results, the 10-year CAGR climbed to 7.65%, helping IWV get an "A+" grade for dividends.
seekingalpha.com IWV scorecard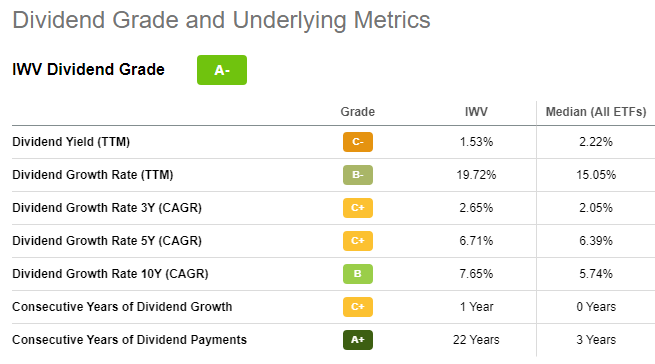
IWV compared to its competitors
The other Total Market ETFs I am familiar with are:
- SPDR Portfolio S&P 1500 Composite Stock Market ETF (SPTM)
- iShares Core S&P Total U.S. Stock Market ETF (ITOT)
- Vanguard Total Stock Market ETF (VTI)
- Schwab U.S. Broad Market ETF (SCHB)
- Vanguard Russell 3000 ETF (VTHR)
Here is some basic data points for each of the above ETFs plus IWV.
advisors.vanguard.com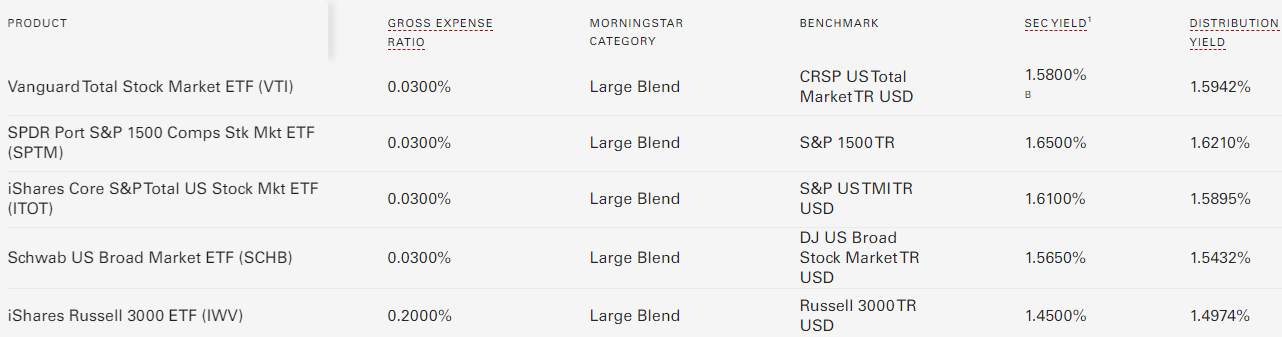
The above chart shows which benchmarks are used and tells readers that IWV thinks 20bps in fees is acceptable whereas the others are all 3bps. The next charts show the size/type allocations.
advisors.vanguard.com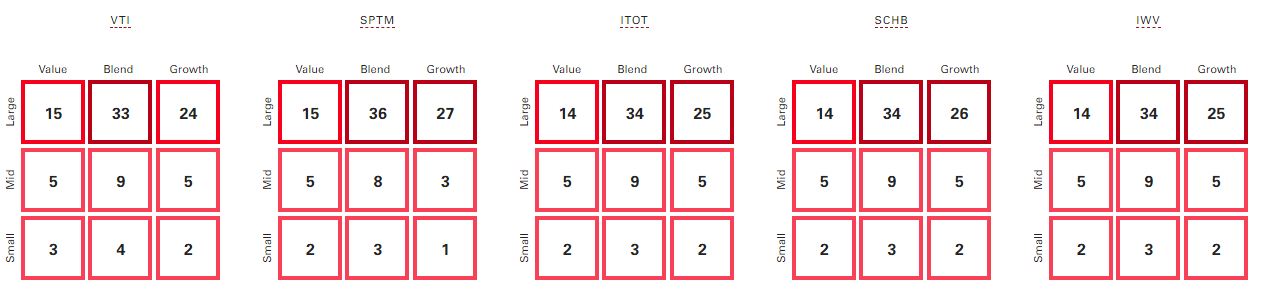
The differences are minor except for SPTM being more Large-Cap than the others, mostly by having the lowest Mid-Cap weighting. That causes it to have the highest weighted market-cap.
advisors.vanguard.com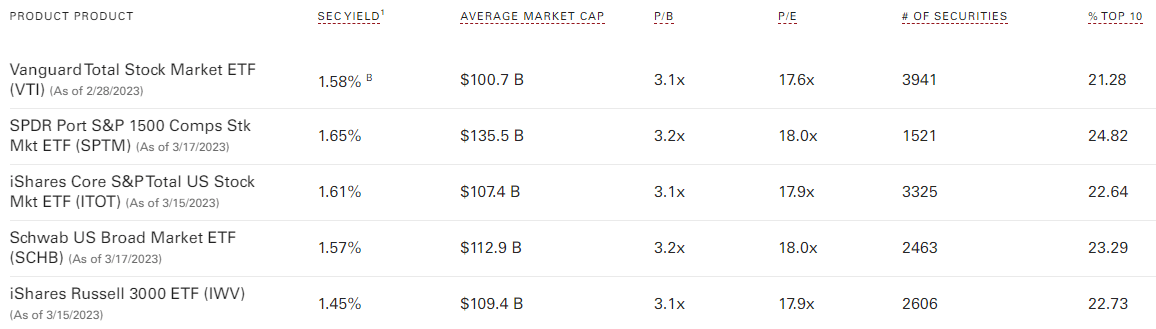
All of that points to, except for IWV's high fees, having little differences between themselves. The Seeking Alpha Peers function allows for six ETFs, and this data shows they all rate about the same, grade wise.
seekingalpha.com IWV compare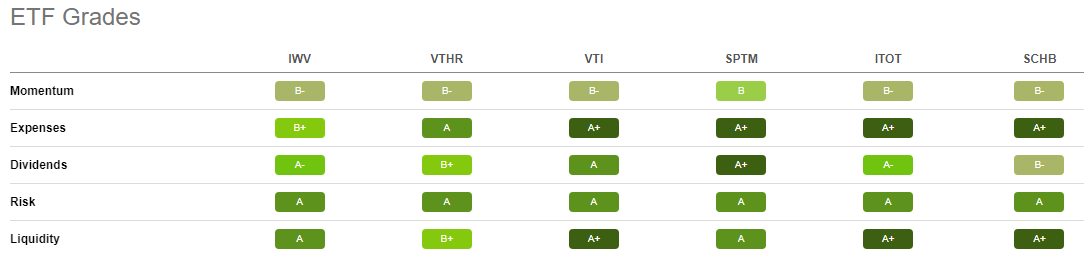
Which leads to the important data; risk and returns. This is where IWV fails compared to the other ETFs, including the Vanguard Russell 3000 ETF (VTHR), which has a 10bps lower fee.
PortfolioVisualizer.com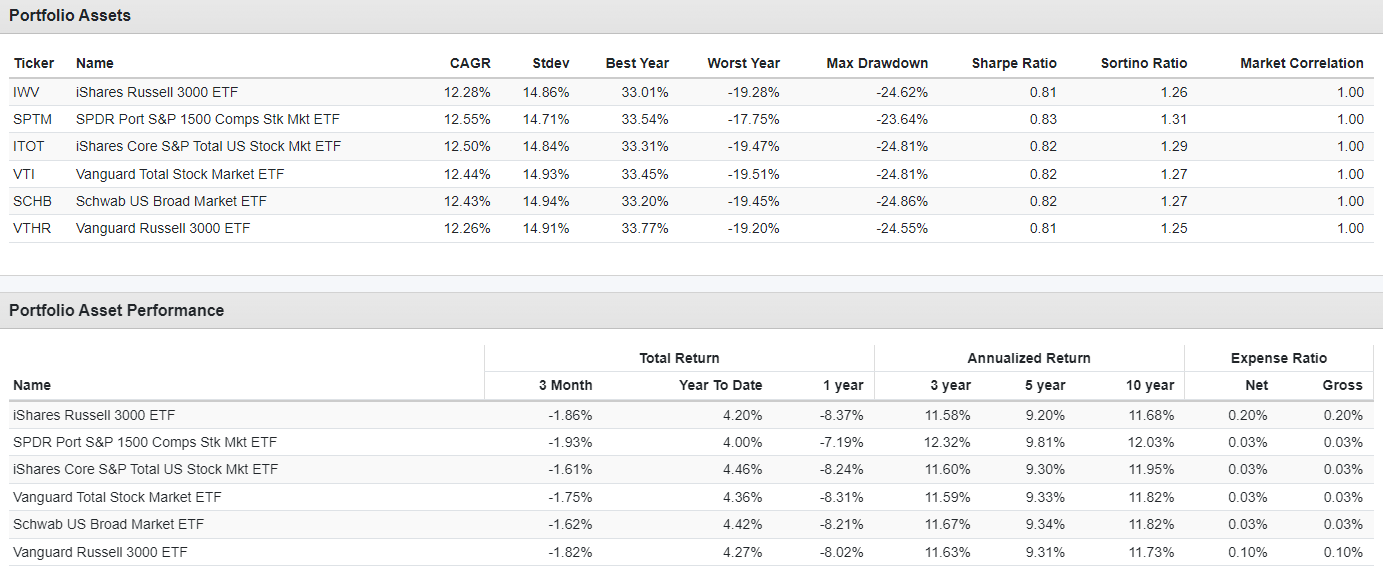
Since late 2010 when the Vanguard Russell 3000 ETF (VTHR) started, IWV is 2bps ahead but behind from 10-years in. Compared to the others since then, it lags by 15-27bps. R3000 Index based ETFs trail all the others across the 1-10-year time periods. That said, measuring periods count, as does apparently the data provider. The SPTM ETF is the next oldest compared to the IWV ETF. Since SPTM launched, Seeking Alpha shows IWV was the best choice; two other sites say SPTM was the better choice.
IWV compared to SPY
Since some investors might consider replacing SPY with a TM fund like IWV, here is brief comparison of the holdings and equity data points of these two.
PortfolioVisualizer.com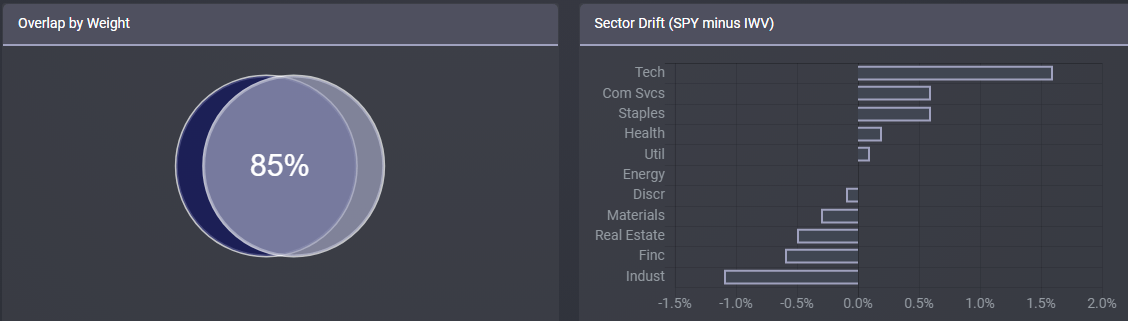
While small, investors who like Tech stocks but maybe not Industrials, stick with SPY. I marked in Green which ETF had the better results for each factor.
Fidelity.com; compiled by Author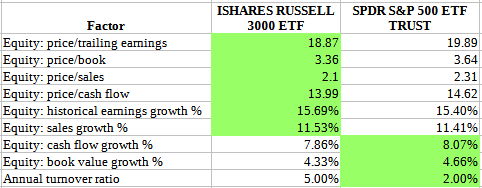
To me, IWV is more Value oriented. To see if my conclusion made sense, I looked at how Morningstar evaluates each ETF. It doesn't appear they would agree with my assessment when I looked at the above ratios.
Morningstar.com IWV ETF Morningstar.com SPY ETF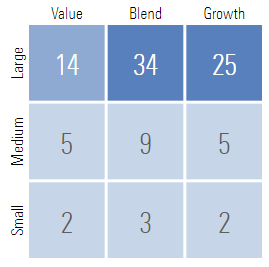
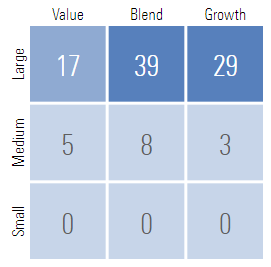
This does indicate the Large-Cap expansion thought as IWV has 7% in Small-Cap, versus 0% for SPY, and 3% more in Mid-Cap stocks. The next chart compares how investors have done owning each ETF since IWV started.
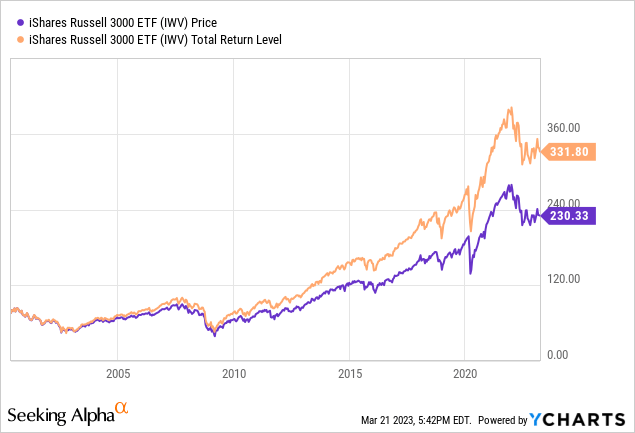
dividendchannel.com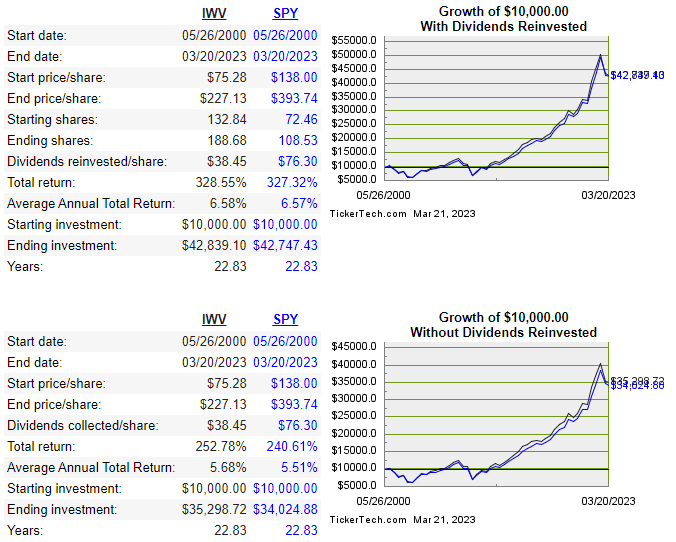
Since 2000, the difference, regardless of whether the investor took or re-invested the dividends is minor, though slightly favoring IWV over SPY.
Portfolio strategy
I view ETFs that cover a wide segment of a particular asset class make for great Core holdings. From there an investor can tweak their allocation into more focused strategies such as Growth/Value, Market-Cap, or Sector selection. There are also funds that enhance income, reduce volatility, or invest using momentum factors. While some of these strategies require market timing to maximum their benefits, especially Bull/Bear leveraged funds, some are more long-term oriented and are useful to adjust the allocation gained by holding Core holdings.
The next of data points illustrates how some of the above possibilities have moved differently over long periods.
PortfolioVisualizer.com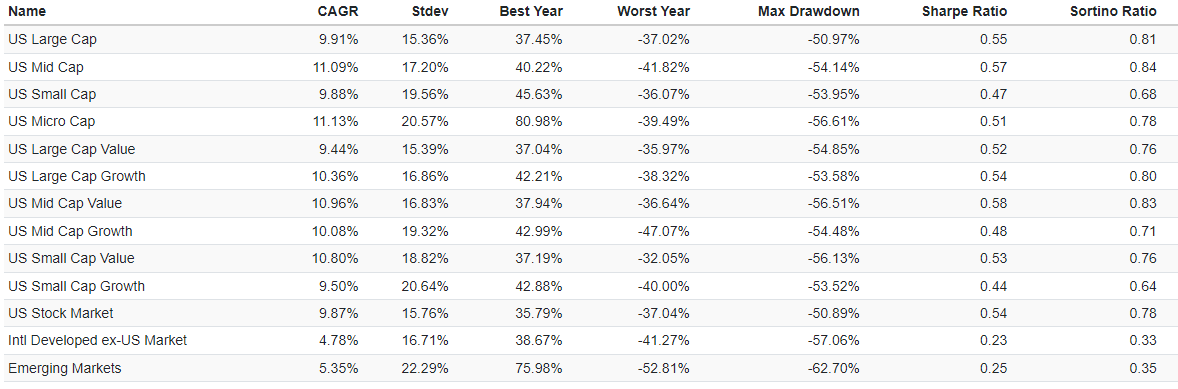
Final thoughts
First: don't sweat the small stuff and get caught making no decision because there are too many choices. The difference on a $10,000 in 2010 between the worst and best performer was just over $1,300, or about $100/year in growth.
While somewhat dated, Lukas Wolgram compared the R3000 ETFs as well: Passive Russell 3000 ETFs: IWV Vs. VTHR.

I ‘m proud to have asked to be one of the original Seeking Alpha Contributors to the 11/21 launch of the Hoya Capital Income Builder Market Place.
This is how HCIB sees its place in the investment universe:
Whether your focus is high yield or dividend growth, we’ve got you covered with high-quality, actionable investment research and an all-encompassing suite of tools and models to help build portfolios that fit your unique investment objectives. Subscribers receive complete access to our investment research - including reports that are never published elsewhere - across our areas of expertise including Equity REITs, Mortgage REITs, Homebuilders, ETFs, Closed-End-Funds, and Preferreds.
This article was written by

I have both a BS and MBA in Finance. I have been individual investor since the early 1980s and have a seven-figure portfolio. I was a data analyst for a pension manager for thirty years until I retired July of 2019. My initial articles related to my experience in prepping for and being in retirement. Now I will comment on our holdings in our various accounts. Most holdings are in CEFs, ETFs, some BDCs and a few REITs. I write Put options for income generation. Contributing author for Hoya Capital Income Builder.
Disclosure: I/we have a beneficial long position in the shares of VTI, SPTM, ITOT either through stock ownership, options, or other derivatives. I wrote this article myself, and it expresses my own opinions. I am not receiving compensation for it (other than from Seeking Alpha). I have no business relationship with any company whose stock is mentioned in this article.