Gold On The Verge Of Massive Breakout (Technical Analysis)

Summary
- The decline in bank deposits reduces the lending capacity and leads to a credit contraction in the economy.
- The gold market is approaching the long-term pivot of $2,075, which has the potential to open the door to higher prices.
- Due to the emergence of bull flags and cup-and-handle patterns, GLD and IAU are attractive investment options.
Huang Evan/iStock via Getty Images
Market uncertainty is growing as the bank run continues, putting pressure on the United States economy. Gold Spot Price (XAUUSD:CUR) is bullish due to safe-haven demand amid market volatility. In recent days, the price of gold has climbed above $1,900 per ounce. Strong resistance between $1,975 and $2,075 is being challenged, and any break above this region will be an extremely bullish indicator for long-term investors. This article presents a continuation of the previous discussion, which was a long-term analysis of the future direction of the gold market. Due to the recent rally and the emergence of strong price action, SPDR Gold Trust (GLD) and iShares Gold Trust (IAU) are two investment opportunities to consider for long-term investors.
Financial Uncertainty
ICE BofAML MOVE Index is used to observe the volatility of the financial markets. The Move index is a measure of the expected volatility of U.S. Treasury bonds based on option contract prices. The index rises during periods of market volatility and economic stress. Higher levels of volatility indicate that bond prices are anticipated to fluctuate more significantly, impacting the overall performance of fixed-income portfolios and influencing interest rates in the economy as a whole. According to the chart below, the Move index has risen to 190. A move above 150 signifies boosted bond market volatility. When volatility increases, bond prices typically decline as investors demand higher yields to compensate for the added risk. The level around 150 also suggests that the Federal Reserve is losing control of interest rates and will soon be forced to intervene. The Move index returned to 143, which is still a high level.
BofAML Move Index (tradingview.com)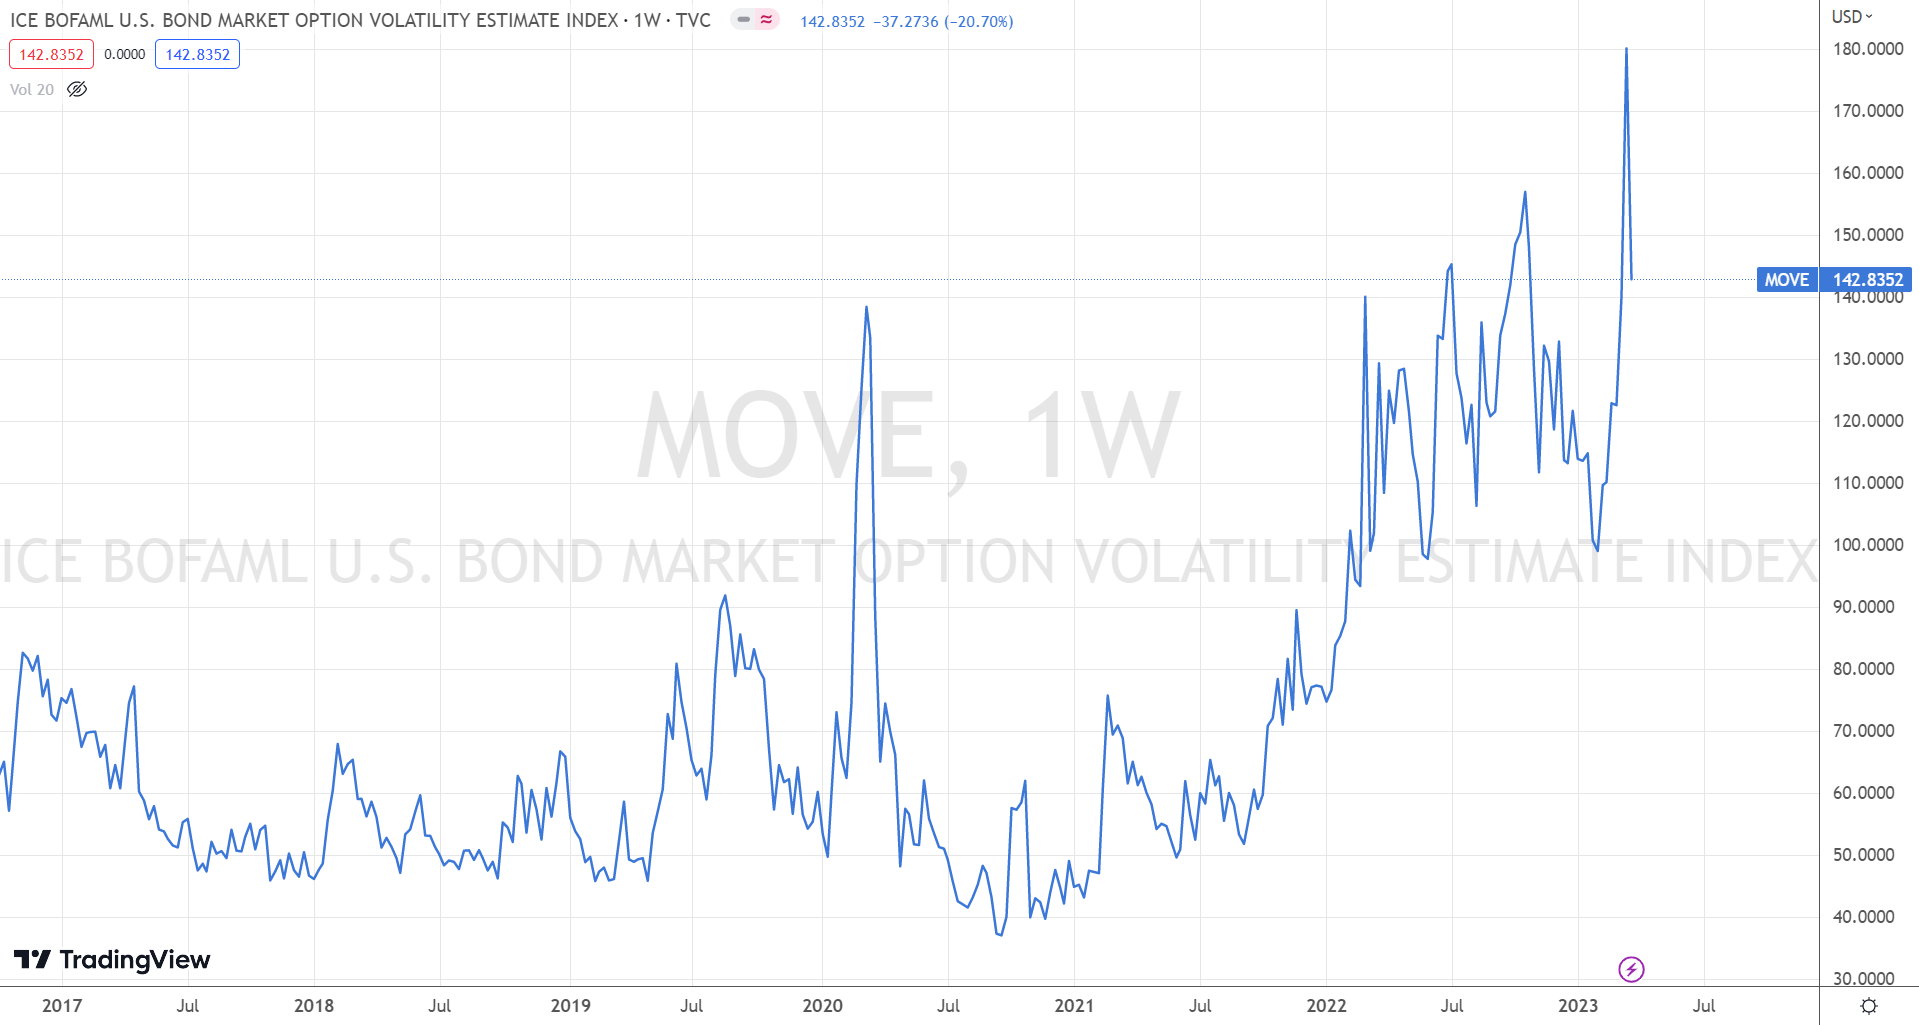
On the other hand, the bank run continues as large depositors invest in T-bills and money market funds rather than bank deposits. The chart below illustrates a significant decline in deposits across all commercial banks. This type of decrease in bank deposits reduces lending capacity and leads to a credit contraction in the economy, which has negative effects on businesses and households. The decline in bank deposits also creates a liquidity crisis. The 13-week Treasury Bill dropped from 4.90% to 4.30% on strong demand, as volatility increased.
A significant decline in deposits across all commercial banks has terrible impacts on the banking system and the economy. Large uninsured depositors' shift to Treasury Bills and money market funds is indicative of a stressed financial system. Due to its perceived value and limited supply, gold's demand as a safe-haven asset increases during times of economic stress. The increased demand in the gold market during financial stress boosts gold prices.
A Threat of Deflation During Financial Uncertainty
Since 1913, the dollar has lost more than 95% of its purchasing power, while the price of gold has increased significantly. The chart below illustrates the drop in purchasing power since 1913. Gold is used as a hedge against inflation and economic crisis. As a result of the contraction of credit during a financial crisis, the value of assets plummets. Due to a lack of available funds, lenders become less willing to extend credit or be unable to do so. If credit contraction causes a significant decrease in demand for goods and services, deflation will result in a decline in prices across the economy.
Purchasing Power of the Consumer Dollar (fred.stlouisfed.org)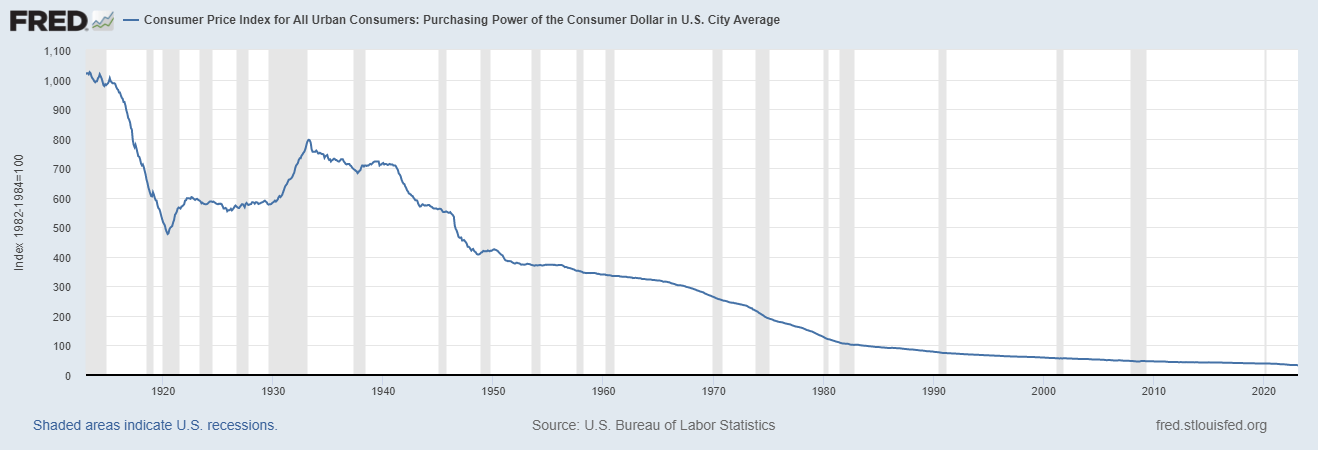
In a deflationary environment, gold is also bullish due to its status as a store of value and a hedge against financial and political instability. During the 2008 global financial crisis and the 2020 pandemic crisis, the Fed injected a large amount of liquidity into the system to stabilize prices and prevent a deflationary spiral, as seen in the chart below. However, this deflation is likely to be short-lived and is typically followed by a substantial increase in the price of gold.
Total Assets (Chart prepared by Author (fred.stlouisfed.org))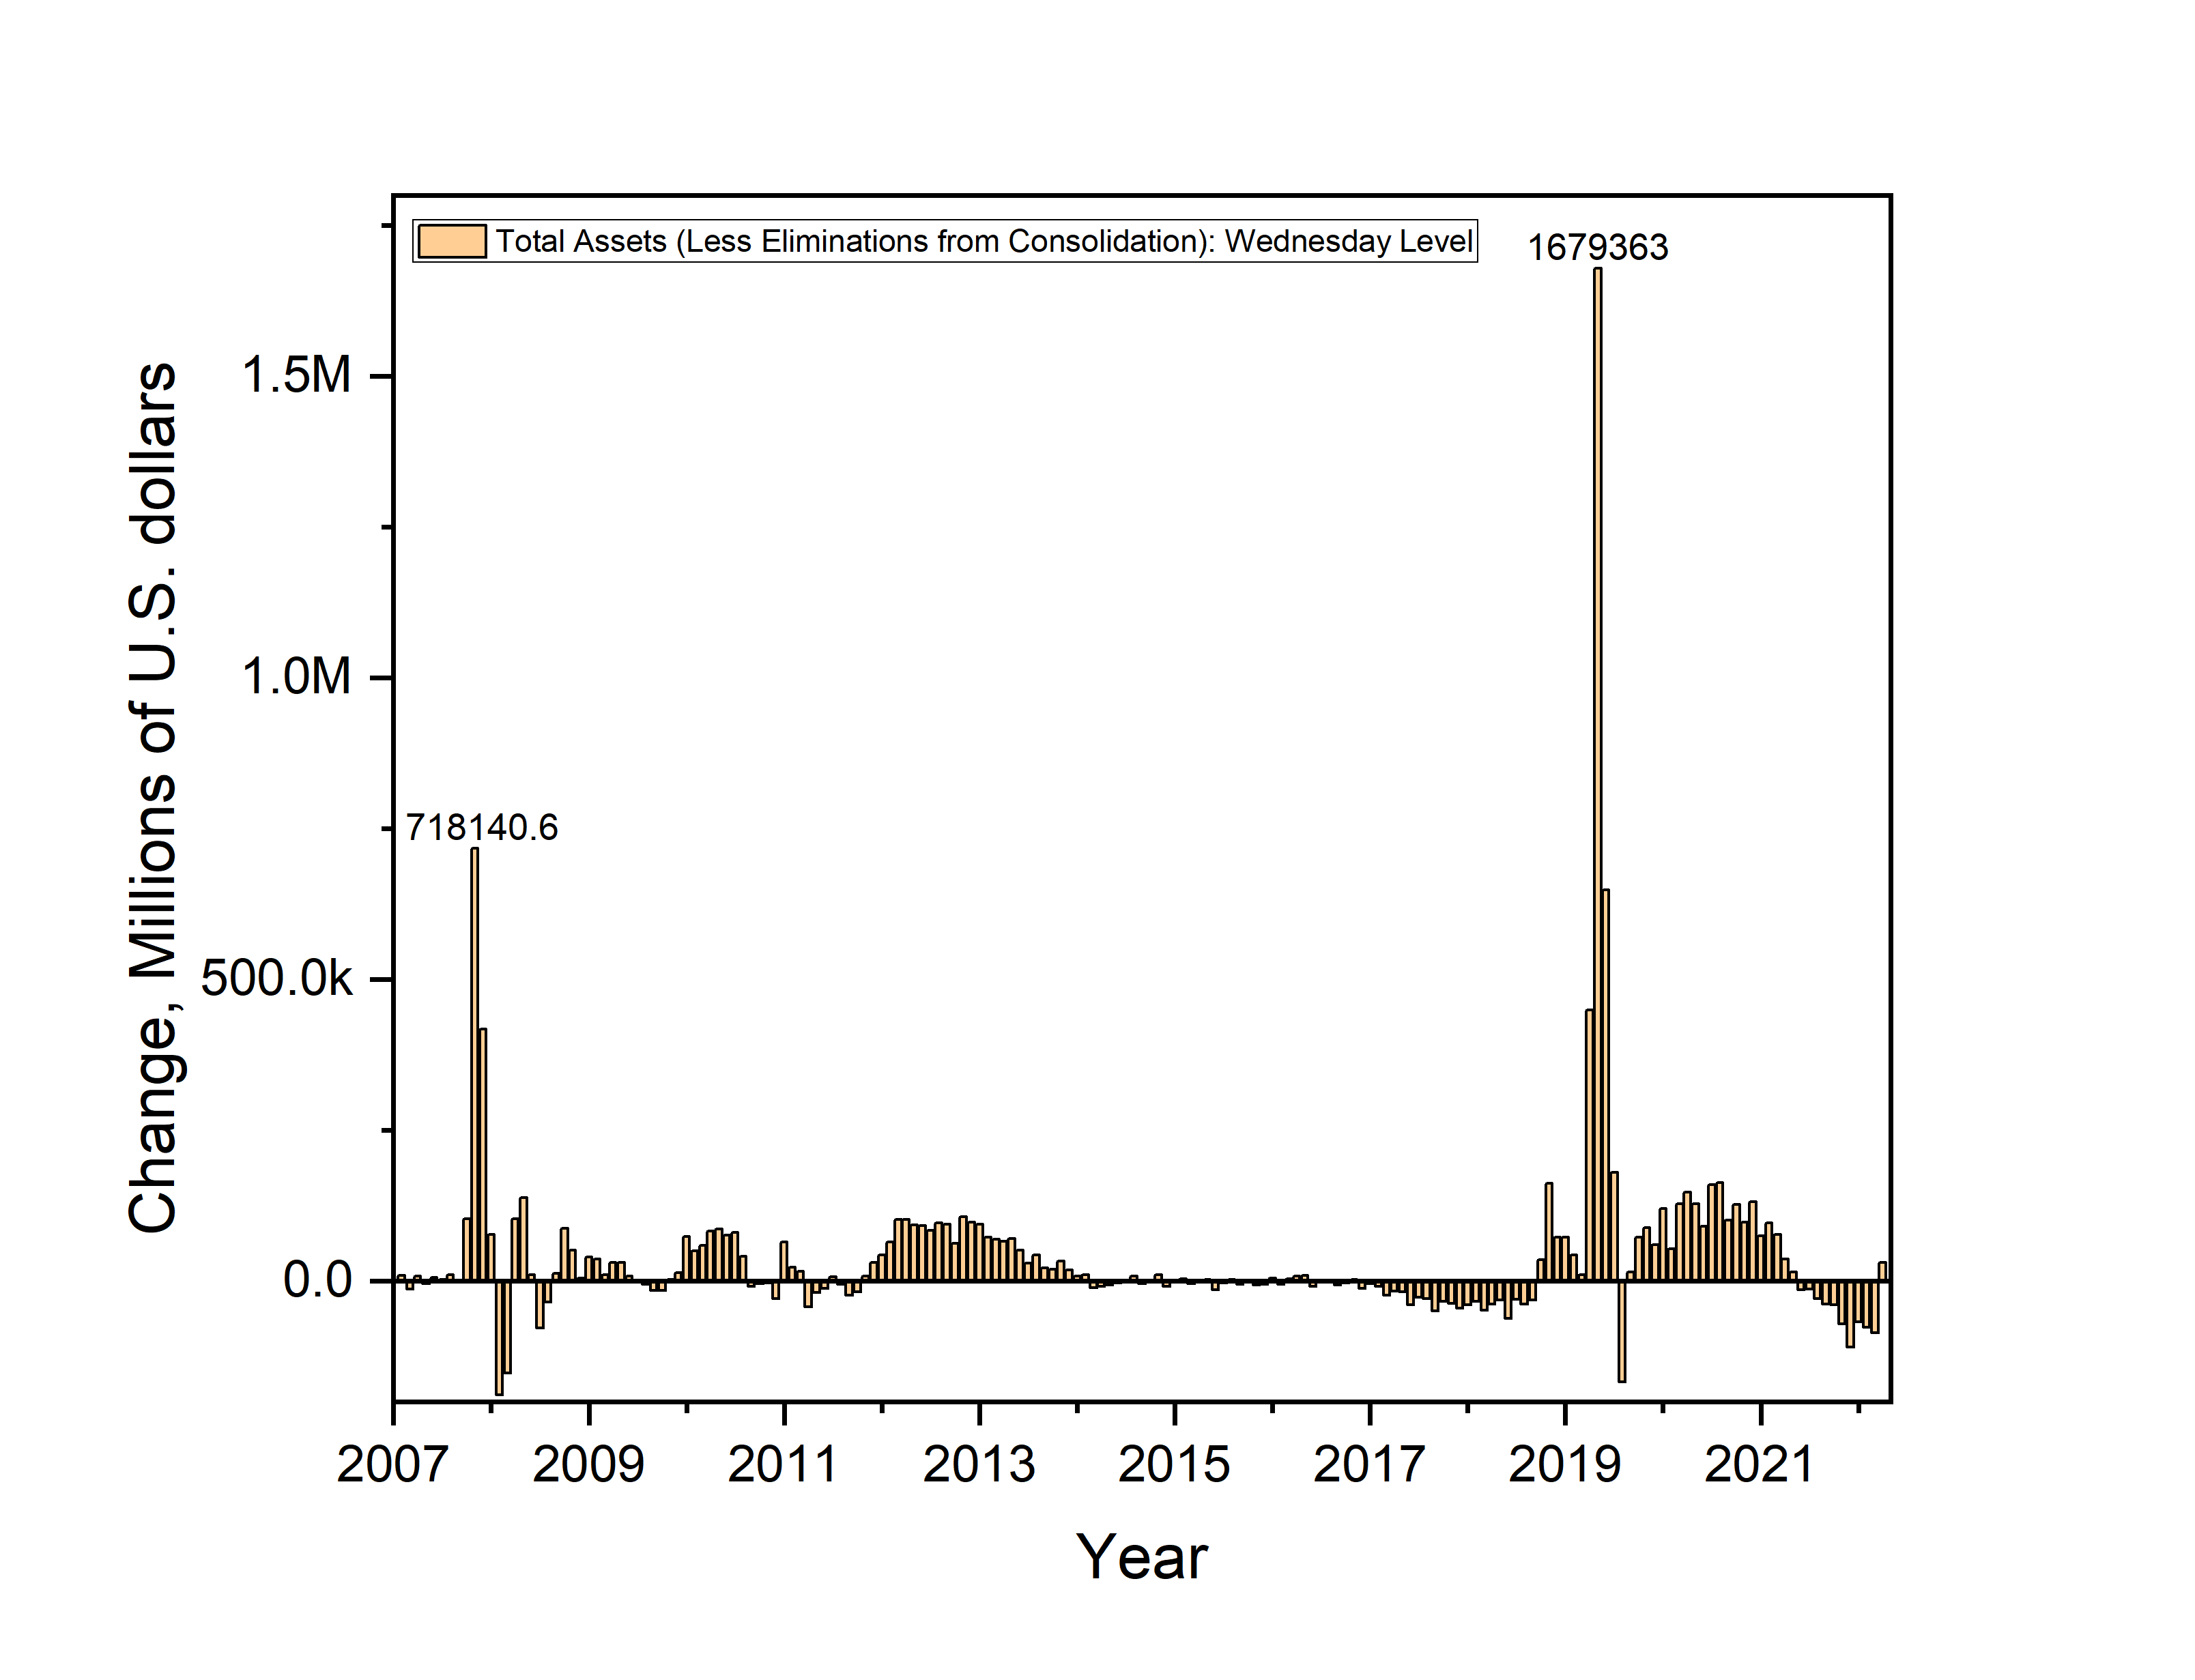
ETF Performance
Gold demand is anticipated to increase as a safe-haven asset, and exchange-traded fund (ETF) is a convenient and cost-effective way to invest in the gold market due to diversification, lower transaction costs, transparency, and flexibility. GLD and IAU are the best ETFs for gaining exposure to the gold market due to low expense ratios, liquidity, and sizable asset bases. The 30-day average daily trading volume for GLD is $7.747 million on March 17, 2023, whereas the 30-day average daily trading volume for IAU is $5.32 million. The average volume of GLD trading has increased by more than 60% since December 2022. The increase in the ETF's trading volume is indicative of an increase in investor interest and activity.
On the other hand, Assets Under Management (AUM) is a crucial metric for ETF analysis, as it indicates the size and popularity of an ETF. GLD has a total AUM of $56.56 billion as of March 15, 2023, which has been steadily increasing since November 2022. In contrast, IAU has an AUM of $27.23 billion. A high AUM indicates that the ETF has been successful in attracting investors and is therefore well-managed and has a track record of achieving its investment objectives. The expense ratio for GLD is 0.40% while that for IAU is only 0.25%. The lower expense ratio of IAU indicates that a fund is an attractive option for investors seeking low investment fees.
Gold Hit Long-Term Pivot
A Quick Recap
In a previous article, using yearly charts, the bullish outlook for the gold market was discussed. The inside bars are a strong indicator of price compression, and a breach of the pivot points indicates a price increase. As has been discussed in previous articles, the yearly candles for 2021 and 2022 are inside bars, and any breakout above the highs of these bars indicates a massive move to the upside. The pivot point for this upcoming gold rally is marked at $2,075, which is the high point of these bars. Price is now approaching this barrier, and any move above it will trigger a massive rally in the gold market. The red trendline depicted in the chart below is regarded as the gold market's resistance. If gold breaks above $2,075, the price will meet its next resistance at this red line, which is not before the $3,000 level.
Gold yearly chart (stockcharts.com)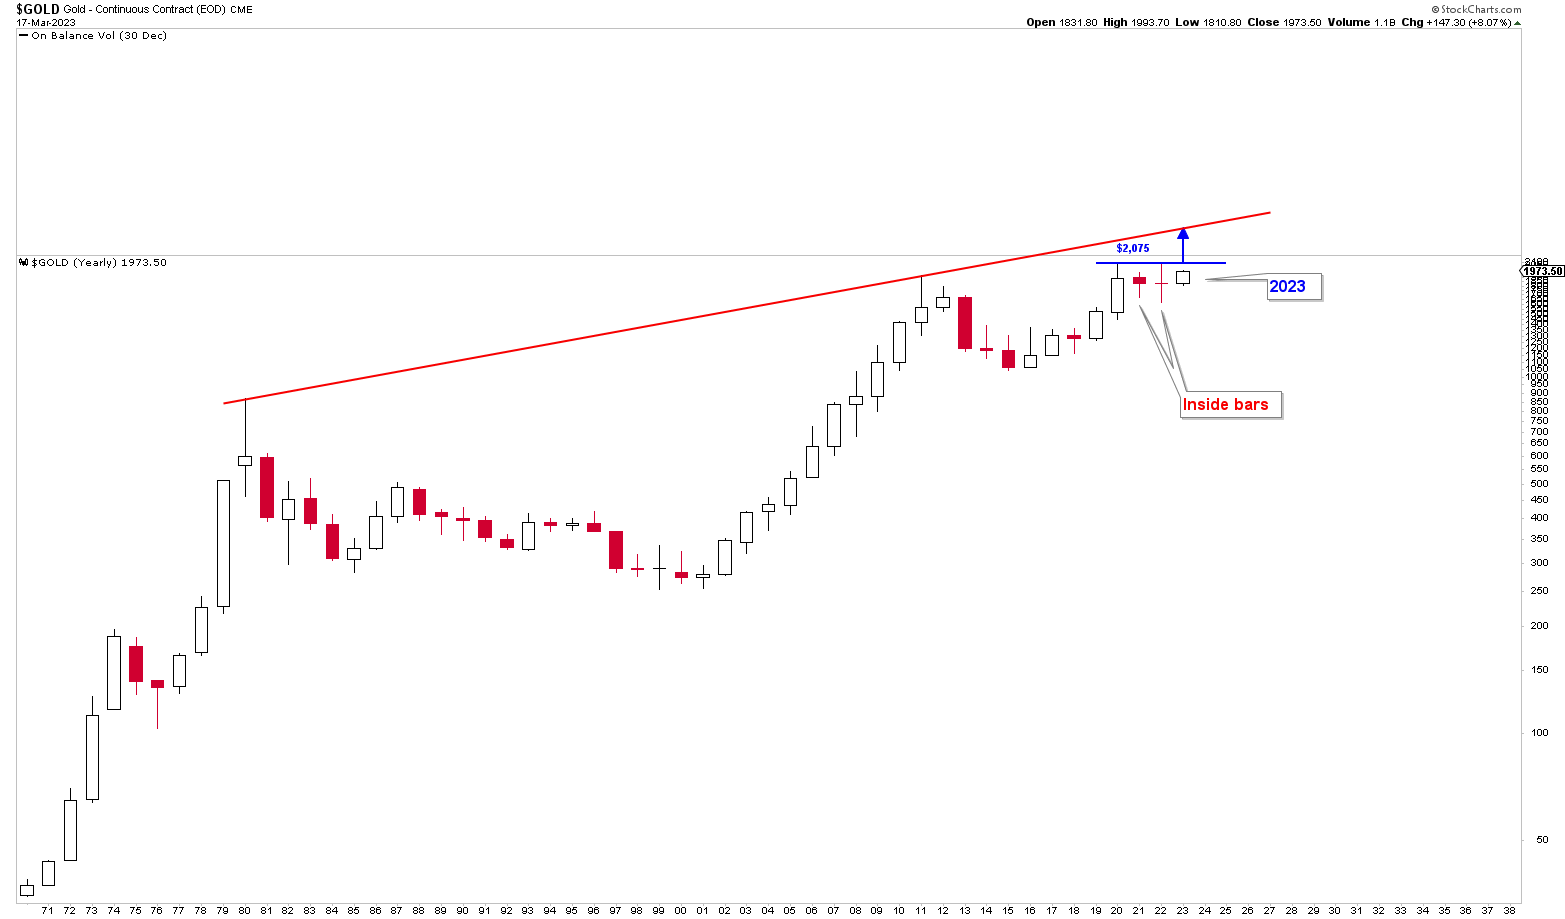
Previously, the formation of bull flags on the quarterly gold charts was also analyzed, and the price is currently exhibiting strong bullish momentum. The breakout of the bull flag signifies a significant acceleration of the gold price to higher levels.
Present Outlook
The above fundamental and technical discussion presents a strong bullish outlook for gold prices on a long-term basis. The bullish outlook can further be understood by the emergence of inverted head and shoulders, which were broken a few weeks ago, and the retracement to the level of $1,810 was a strong buying opportunity targeting the regions of $1,975 and $2,075. The gold market has reached the targeted price range and is now consolidating gains.
The strength of gold is depicted on the monthly chart shown below. The chart presents the 10- and 20- exponential moving averages (EMA). It is interesting to note that when the 10 EMA is crossed above the 20 EMA, the gold price emerges with strong bullish momentum, and any correction to the 10 and 20 EMA during bullish momentum is considered a strong buying opportunity. In this context, blue arrows indicate the crossing of the 10 EMA above the 20 EMA.
In 2001, the first blue arrow indicates that the gold price increased by more than 500%. The other blue arrow is marked with the year 2019, and the price is exhibiting a strong bullish momentum and is continuously rising while forming strong bullish price patterns. Recently, the price touches the moving averages in February 2023, around $1,815, generating a buying opportunity. After this buying opportunity price rises towards the strong formidable barrier of $1,975 and $2,075. Since $2,075 is the long-term pivot, the gold market can consolidate around this region before the next advance. The breakout above $2,075 is likely based on the current financial uncertainty in the United States.
Gold Monthly chart (stockcharts.com)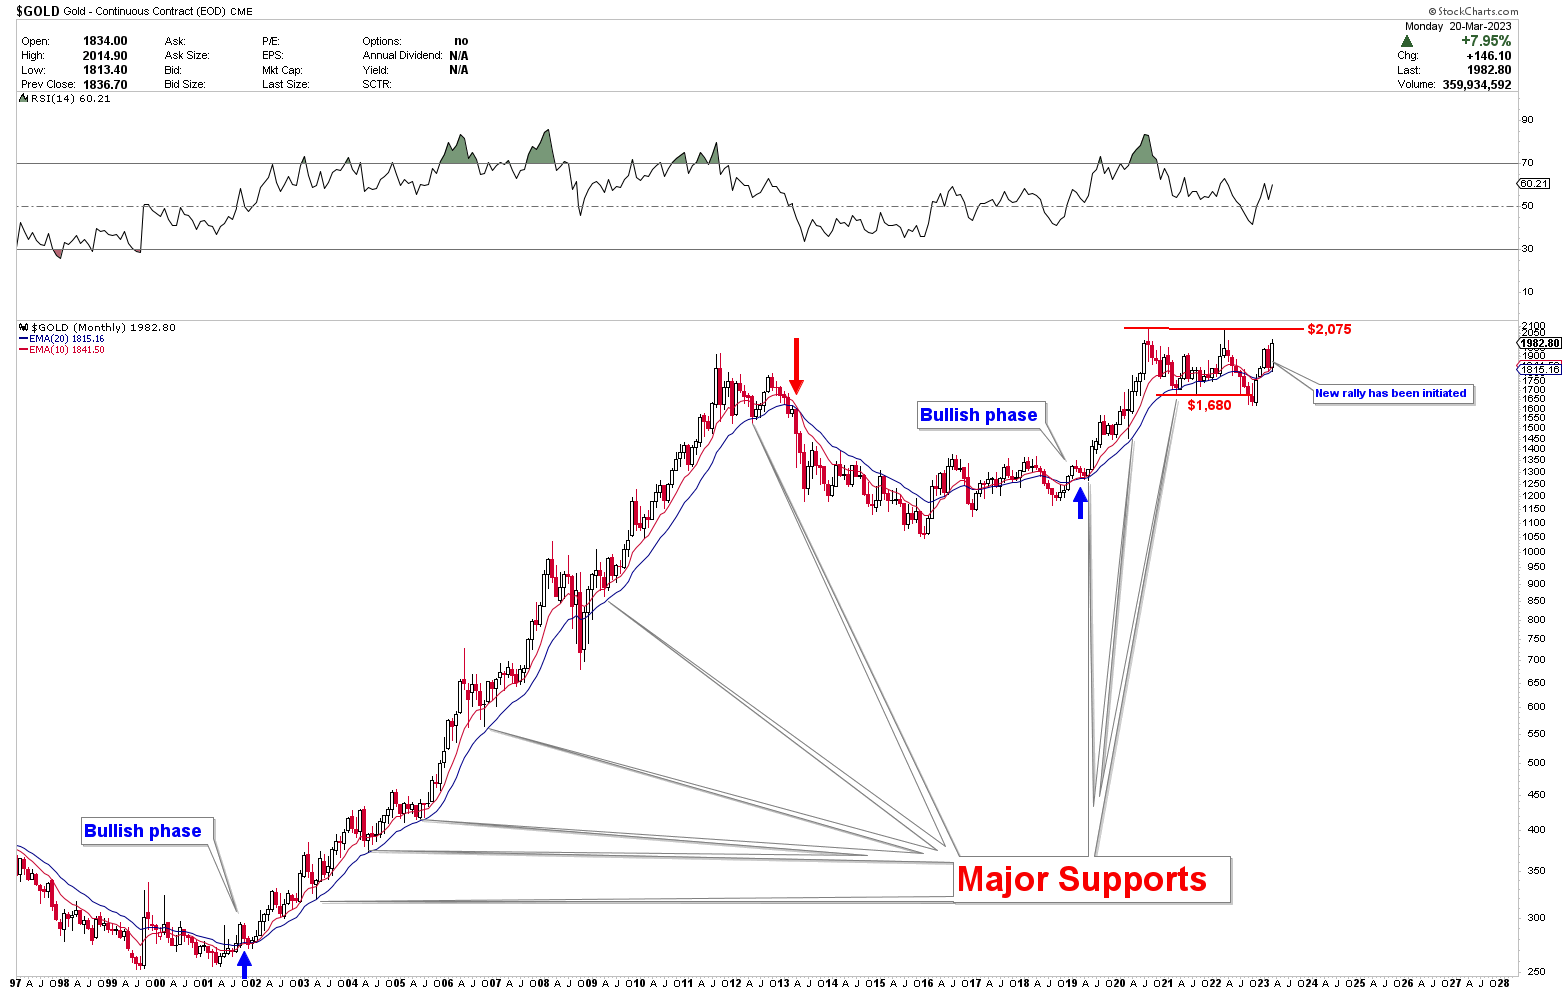
GLD & IAU - On the Verge of Breaking Higher
Since the gold market has established a strong bullish price pattern and is poised to break higher, GLD ETF appears to be an attractive investment option, as the ETF is poised to close above $182. In a few days, the monthly candle will close, and a monthly close above $182 would break the bull flag and indicate further price increases. This bull flag has emerged above the inverted head-and-shoulder pattern, which was serving as the foundation for a potential run higher. The emergence of the bull flag after the breakout of the inverted head-and-shoulders pattern indicates that a break above $182 in GLD would be significant and the price may move higher.
GLD Monthly chart (stockcharts.com)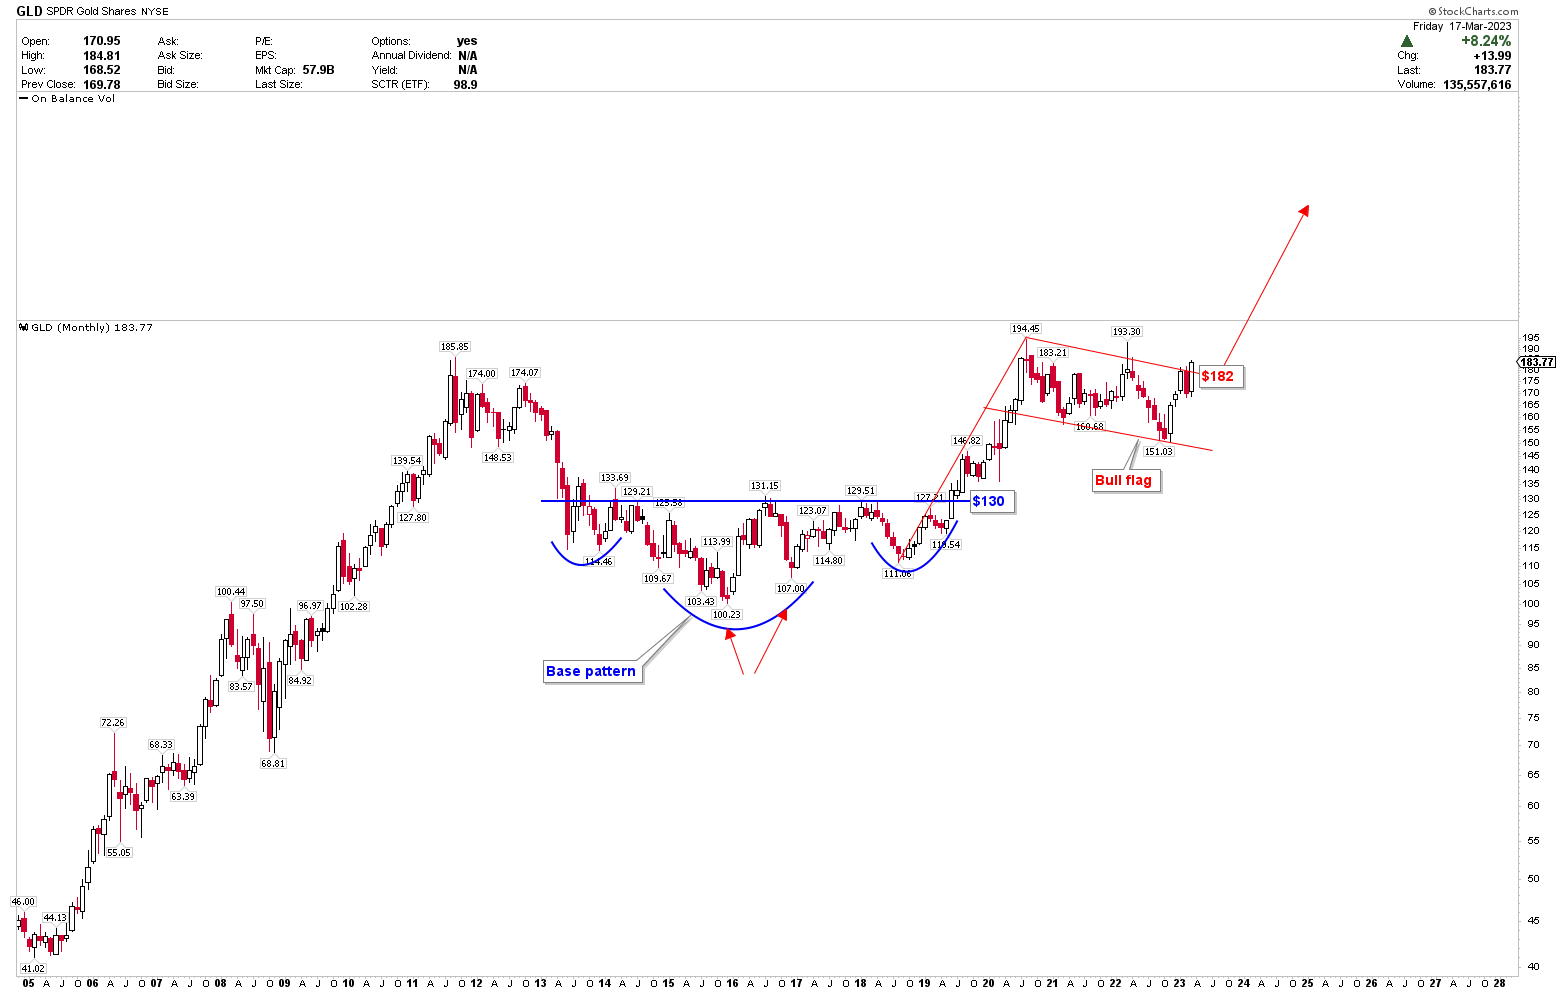
Due to the formation of a cup-and-handle pattern on the below chart, IAU also offers lucrative investment opportunities at current levels. The cup-and-handle pattern is formed as a result of the emergence of a rounding base followed by a consolidation period. The consolidation between the $33 and $39 region in IAU allows the handle to emerge. The price range for the neckline of this cup and handle pattern is between $37 and $39. A breach above this region will propel IAU considerably higher. Investors can consider buying IAU after the breakout at $39 or if the ETF price corrects lower.
IAU Monthly Chart (stockcharts.com)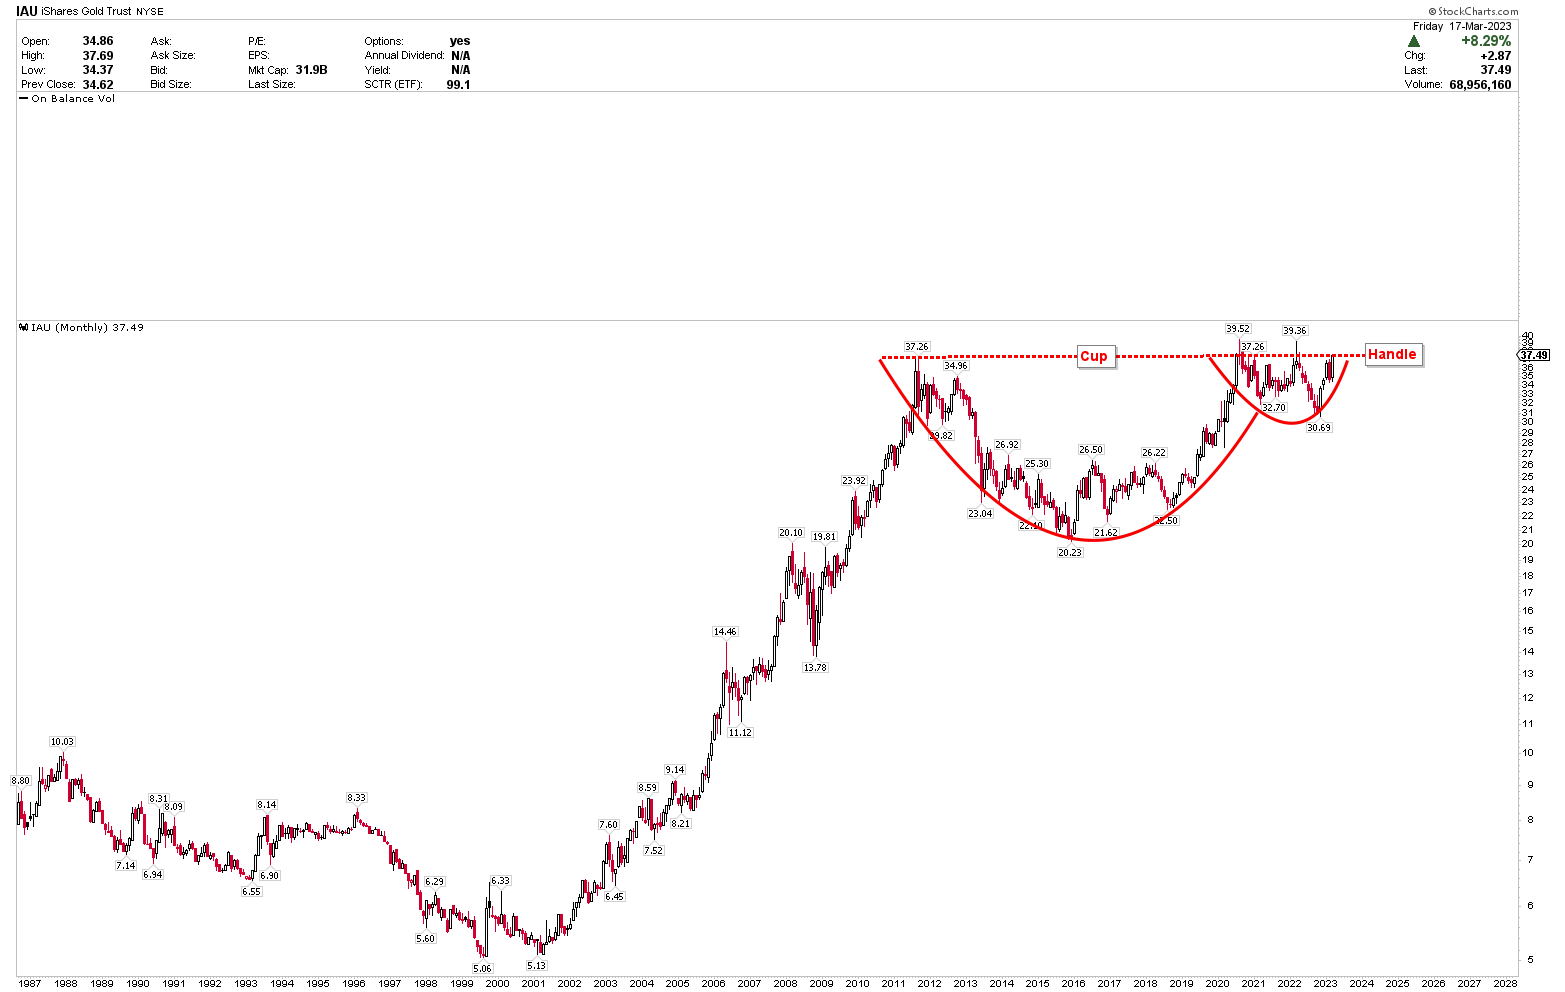
Final Thoughts
The decline in bank deposits reduces the lending capacity and leads to a credit contraction in the economy, affecting businesses, households, and the banking system. A move by large uninsured depositors to money market funds is indicative of a stressed financial system. Due to credit contraction, the financial crisis caused a decline in the value of assets, which can lead to deflation. As a safe-haven asset, the gold price is expected to rise during a financial crisis. The deflation is likely to be short-lived, followed by higher gold market gains. Since the gold market is bullish during the financial crisis, GLD and IAU are attractive investment options due to lower expense rations and technical price developments.
In conclusion, as the spot gold price approaches $2,075, GLD and IAU are poised for a strong breakout from respective pivotal regions. The appearance of a bull flag in GLD and a cup-and-handle pattern in IAU suggest that both ETFs have good potential to go higher in the future. Investors can consider a correction in the gold market as an opportunity to invest in GLD and IAU. A monthly close above $182 in GLD and $40 in IAU would provide investors with a strong buying point. While a pullback to $170 in GLD and $34 in IAU also represents another excellent buying opportunity.
This article was written by

Disclosure: I/we have no stock, option or similar derivative position in any of the companies mentioned, and no plans to initiate any such positions within the next 72 hours. I wrote this article myself, and it expresses my own opinions. I am not receiving compensation for it (other than from Seeking Alpha). I have no business relationship with any company whose stock is mentioned in this article.