A 10-Year Misconception Leaves REITs Cheap Like 1999

Summary
- REIT underperformance over the past 10 years has been the result of multiple contraction while broader market multiples expanded.
- This leaves REITs relatively cheap.
- I see significant outperformance ahead for REITs as multiples normalize.
- Looking for a helping hand in the market? Members of Portfolio Income Solutions get exclusive ideas and guidance to navigate any climate. Learn More »
Jan-Schneckenhaus/iStock via Getty Images
Substantial valuation spreads have emerged between REITs and the rest of the market. I believe it sets up well for big returns in REITs as valuations normalize. It is a similar setup to 1999 when REITs languished as a boring asset class in the presence of extreme excitement over the internet. Today, the emotion is different, coming more in the form of fear rather than exuberance, but the price action is the same.
Let me begin by reviewing the history of various similar price movement disparities and follow with how to identify which ones lead to a reversal and which ones are sticky.
An excitement-driven market
In 1999 the market was driven by excitement. It's not that people thought REITs were bad businesses. It was just that they weren't exciting. The big dividends were nice, but people didn't want a moderate to high return, they wanted an astronomical return. People sold REITs and poured into tech. Here are the relative returns in the calendar year 1999.
S&P Global Market Intelligence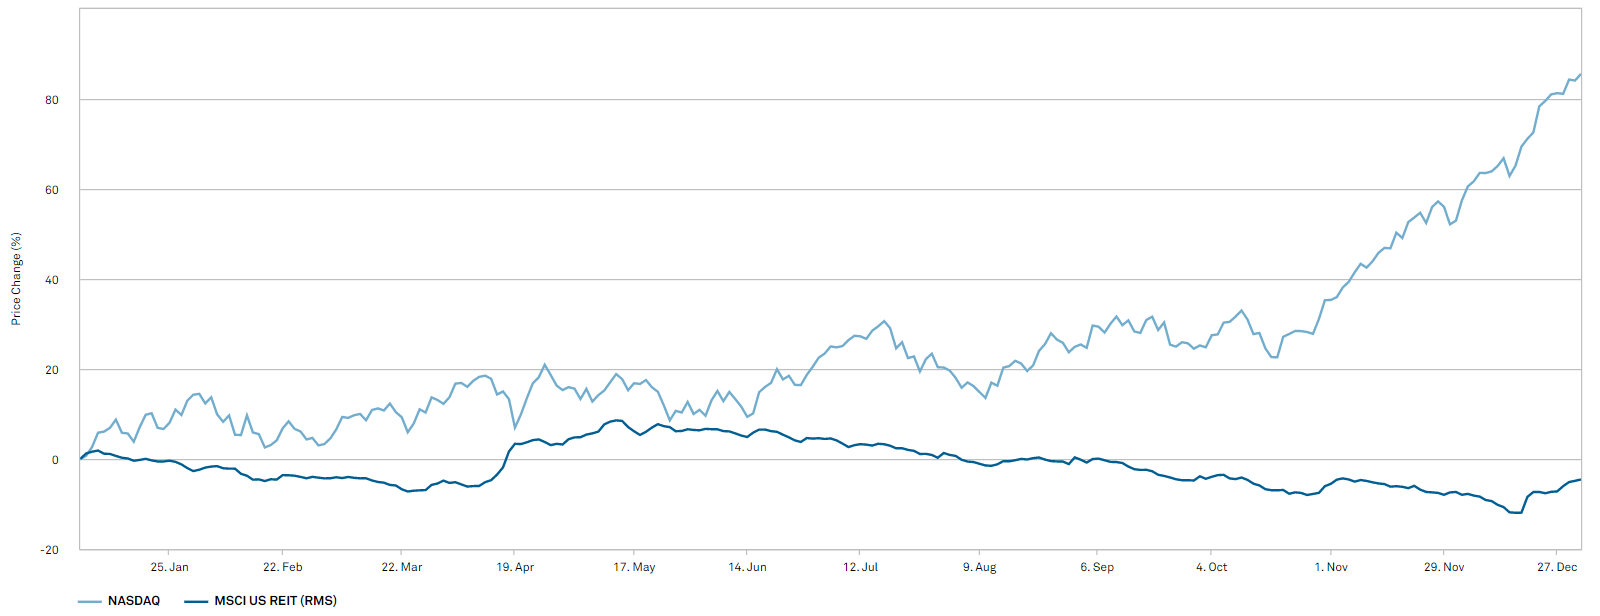
This is one of the best examples of how price is not the same as value. This was not tech outperforming REITs. It was tech getting bloated while REITs were getting cheap. You probably already know the history, but of course, this did not work out well for tech while those who bought the cheap REITs did great.
S&P Global Market Intelligence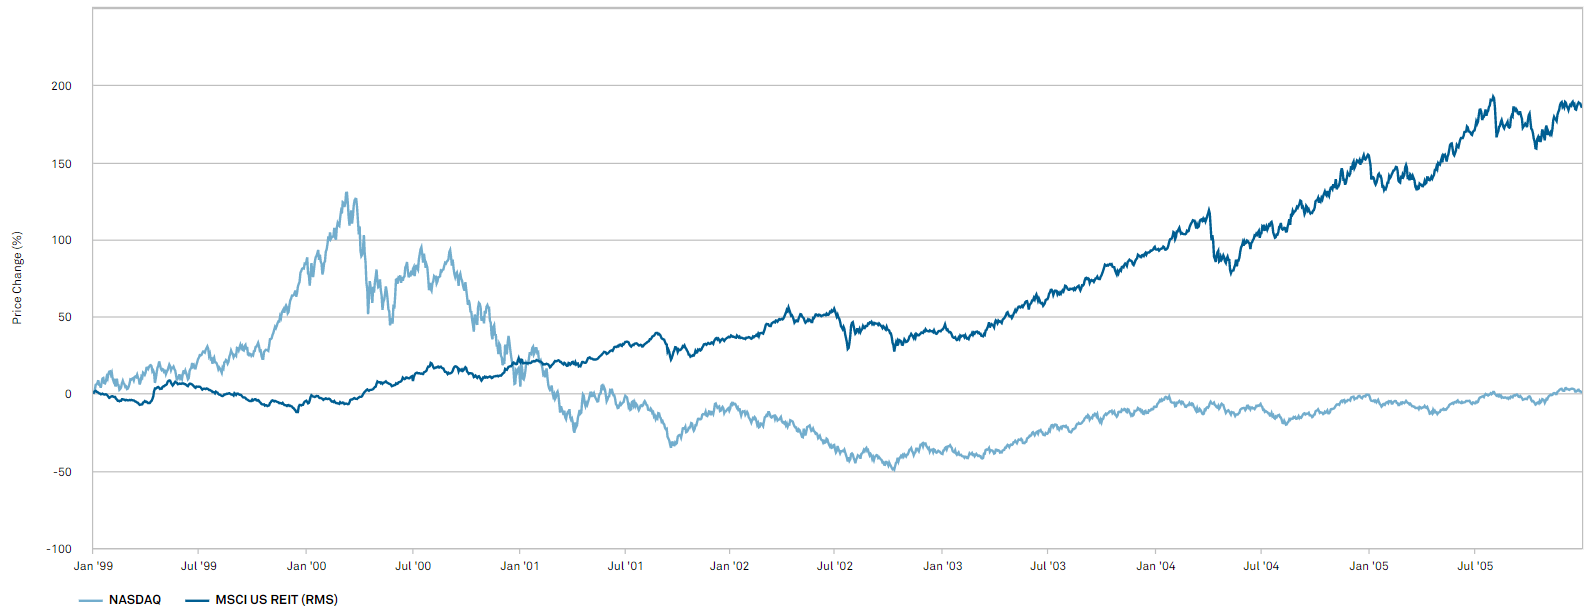
It took the Nasdaq until the end of 2005 to break even, and during that time, REITs had nearly tripled.
Looking back, it is clear that the Nasdaq's surge in the late 90s was a result of euphoria rather than actual outperformance. However, at other times, price movements are reflective of actual outperformance.
A period of real outperformance that coincided with price outperformance
In 2020, the Nasdaq once again surged and once again REITs languished in the flurry. In calendar year 2020, the Nasdaq index was up 44% while REITs were down 8%.
S&P Global Market Intelligence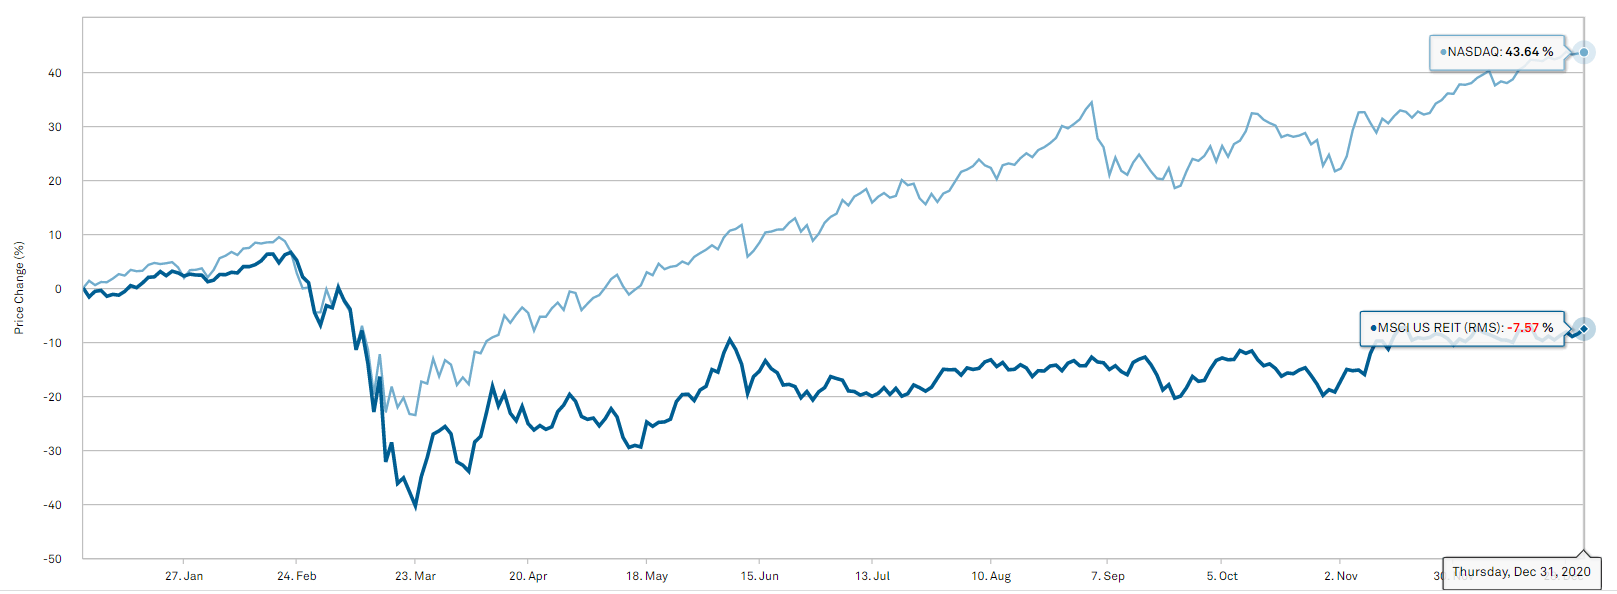
One might think that is the sort of setup that would cause a situation similar to 1999 in which REITs would dramatically outperform from their relatively cheaper state.
Well, as it turns out, REITs did outperform in 2021 but only mildly. REITs had a 45% up year, but the interesting thing here is that the Nasdaq returned about 22%.
S&P Global Market Intelligence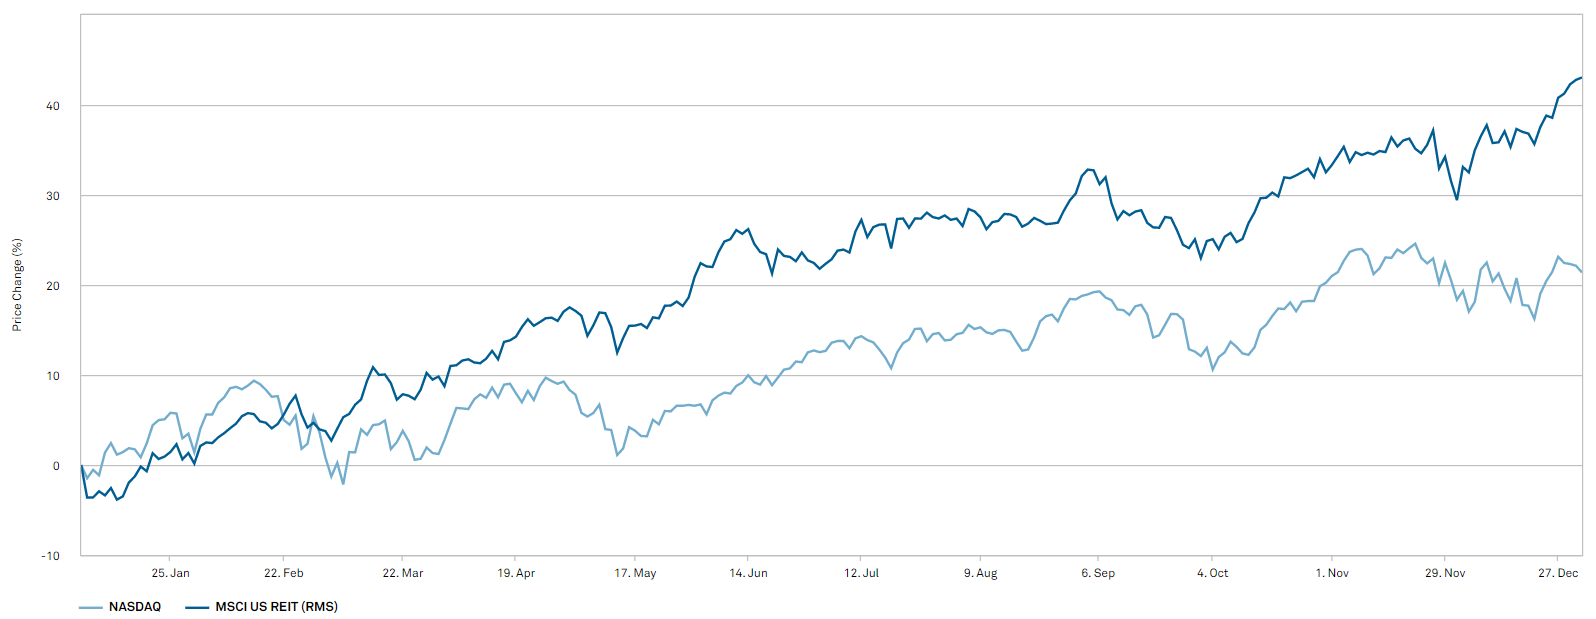
It is shockingly different than the 1999 situation, and the key to understanding such patterns in the future is the underlying fundamental reason as to why.
The 2020 price movement disparity was significantly stickier than in 2000 because it was backed up by fundamentals. The pandemic significantly improved demand for anything digital, as the real world was a place to avoid due to a contagious virus. With REITs owning real-world properties, they were fundamentally harmed by the pandemic while the Nasdaq was fundamentally stimulated. Thus, at least a portion of the price disparity was driven by tech legitimately outperforming, and that is why the price outperformance was sticky.
That is the key to identifying price disparities that will mean revert versus those that remain.
- Price disparities not backed by fundamentals reverse.
- Price disparities that ARE backed by fundamentals are sticky.
I believe spotting the former can lead to a great opportunity in catching the mean reversion that follows. In that regard, I believe there is a price dispersion 10 years in the making that is not backed by fundamentals and will thus revert.
A 10-year misconception
May 21, 2013 marked the beginning of the taper tantrum. Ben Bernanke was the Fed chair, and that was the first rumblings of a rate hiking cycle that is only just now finishing up. During this 10-year period, REITs dramatically underperformed in terms of market price. You can see a clear inflection point at 5/21/2013 where the REIT underperformance began.
S&P Global Market Intelligence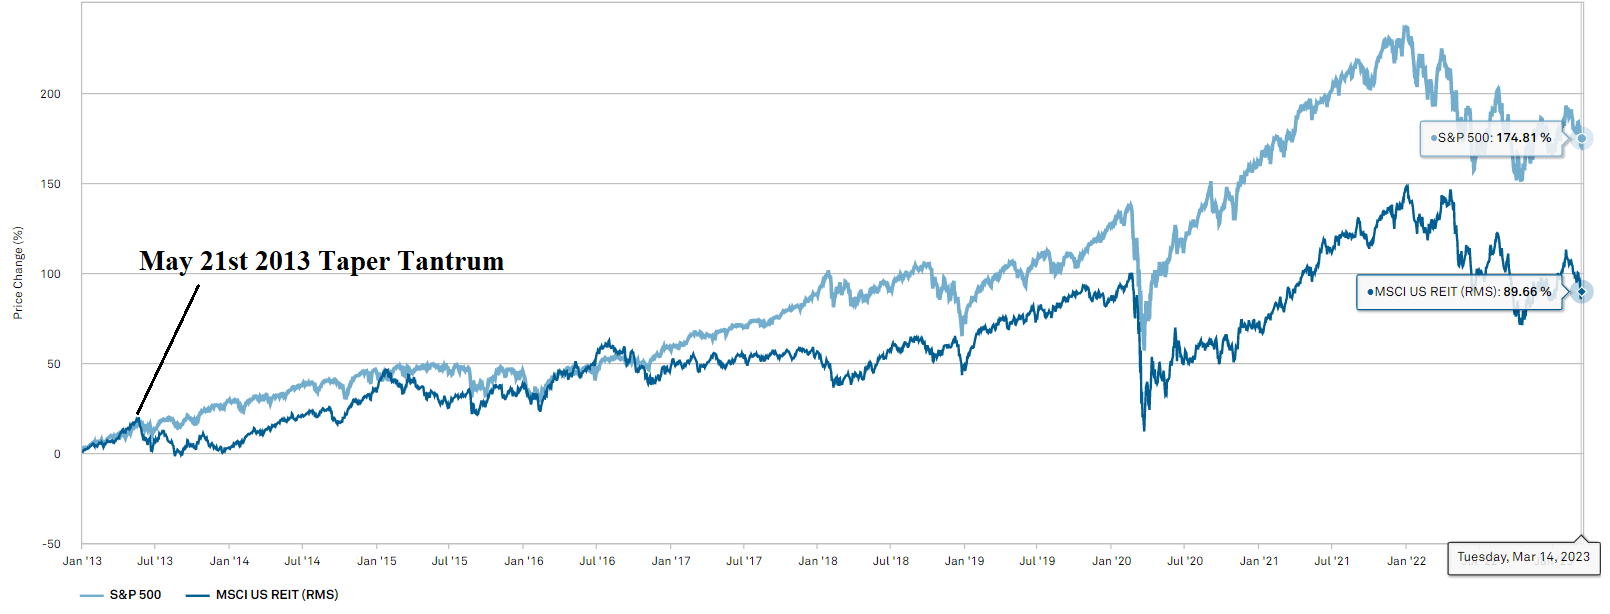
It was not a linear progression of interest rates from the zero bound up to wherever it will peak (somewhere between 450 and 550 basis points). There were many false starts, and at times in that period, interest rates even went back down, such as during Covid. However, during this entire period, Fed hikes were central to any economic discussion.
The REIT underperformance was a slow progression. Each year just performing a bit worse than the broader market. I believe this underperformance is not the result of actual fundamentals (where REITs slightly outperformed), but rather the result of a misconception that REITs are particularly interest rate sensitive.
This caused economic news to be interpreted differently. Most of the news items that are normally considered good for REITs fundamentally began to be filtered through the lens of interest rates. REITs grow earnings and or asset value in response to each of the following:
- Job growth (higher rents)
- Inflation (higher real estate values)
- GDP growth (more demand for real estate)
Over most of the past decade, I have continually witnessed a phenomenon in which REITs often sell down on days in which strong economic data comes out. Rather than interpreting the favorable macro data as discussed in the bullet points above, the market seems to be interpreting it as below.
- High jobs or GDP numbers mean the Fed is more likely to hike.
- High inflation forces the Fed to go higher for longer.
For some reason, that sentiment was applied disproportionately to REITs while most of the S&P still responded positively to strong economic data.
Frankly, higher interest rates should hurt the market price of everything. Bonds mathematically go down in price when rates rise, and stocks should decline in price because the discount rate is higher. Whatever future earnings one is discounting back to the present in calculating present value, a higher discount rate means a lower PV.
At the same time, both REITs and the broader market were growing earnings, so it makes sense that they were able to fight through the rising interest rate environment and still deliver positive returns. REITs simply delivered a significantly smaller positive return with a price change of +90% since the start of 2013 compared to +175% for the S&P.
My hypothesis
I posit that the entirety of this gap in market price performance is a result of multiple expansion in the S&P and multiple contraction among REITs. REITs actually outperformed fundamentally over the rising rate cycle, with slightly higher earnings growth (FFO/share growth versus EPS growth of the S&P).
Therefore, this is a price disparity that is NOT backed up by fundamentals and is thus likely to result in a reversion. In this case, the reversion would consist of REITs outperforming the S&P until their relative earnings multiples normalize.
The evidence
S&P multiples have expanded significantly over the past decade. At the start of 2013, the S&P was trading at 17.03X forward earnings.
multpl.com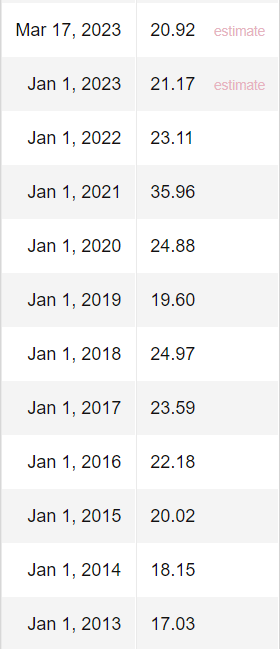
Today, the S&P is trading at 20.92X forward earnings
REITs, in contrast, had significant multiple contraction. Here is an archived table from SNL Financial (now called S&P Global) showing the median price to FFO of REITs at the end of 2012.
S&P Global Market Intelligence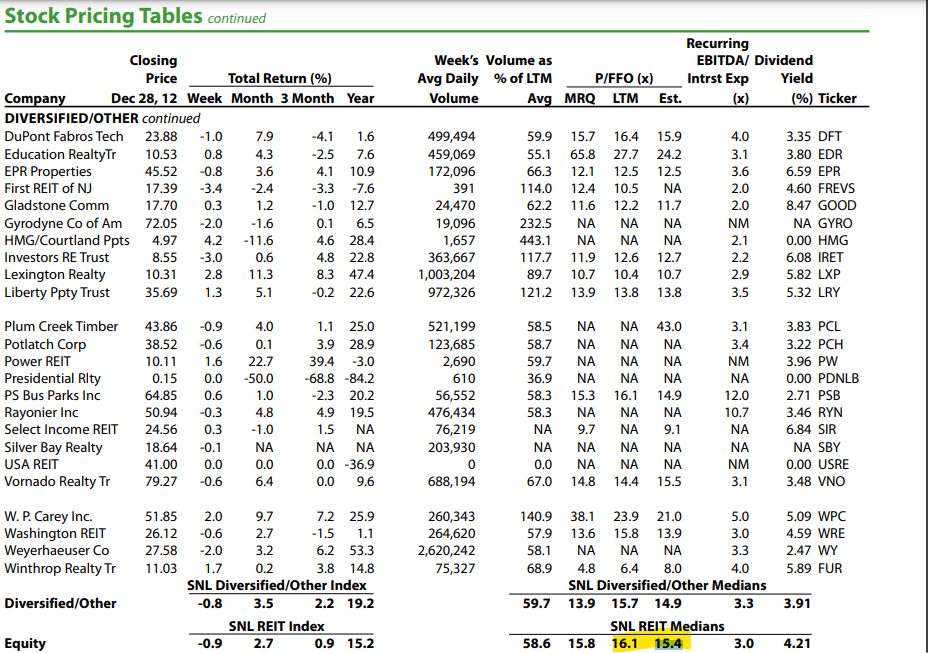
The forward REIT multiple was 15.4X FFO.
Today, the median REIT trades at 12.3X FFO.
So over the past 10 years, the S&P multiple has expanded by 22.8% while the REIT multiple has contracted by 20.1%.
2MC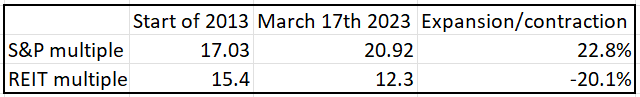
Let me proceed by calculating the price returns of S&P and REITs if there was no multiple contraction/expansion over this roughly 10-year period.
2MC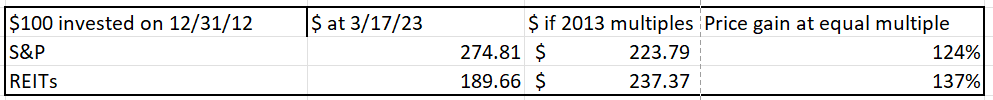
At equal multiples, REITs actually outperformed. This means REITs actually grew earnings faster than the S&P. More than 100% of the S&P's outperformance has been the result of multiple expansion while REIT multiples contracted.
With 10 years of slightly faster bottom line growth, it seems REITs were not disproportionately affected fundamentally by interest rates. The only disproportionate effect is the market perception. I believe this sets up well for REITs to rebound and substantially outperform the S&P.
Multiple contraction in the presence of quality improvement
Multiples should contract if risk increases, but looking at the data, it seems REITs have substantially improved quality over this period. Debt levels have declined continuously.
NAREIT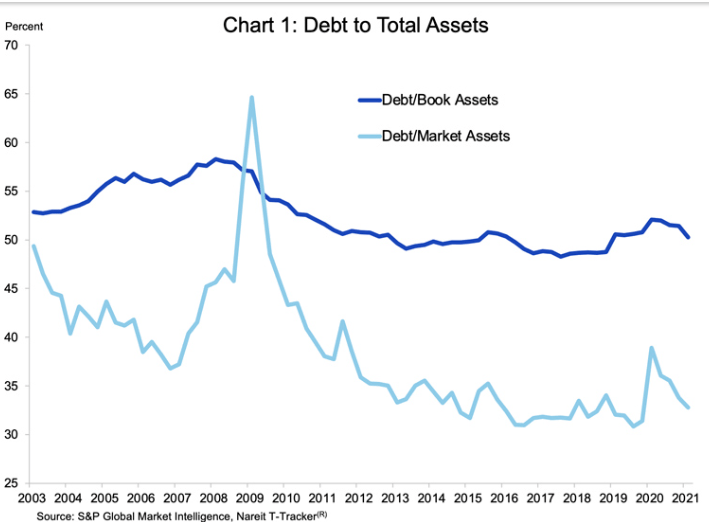
Net operating income coverage of debt has improved.
NAREIT
EBITDA coverage of interest expense has gone from just over 3X to over 5X.
S&P Global Market Intelligence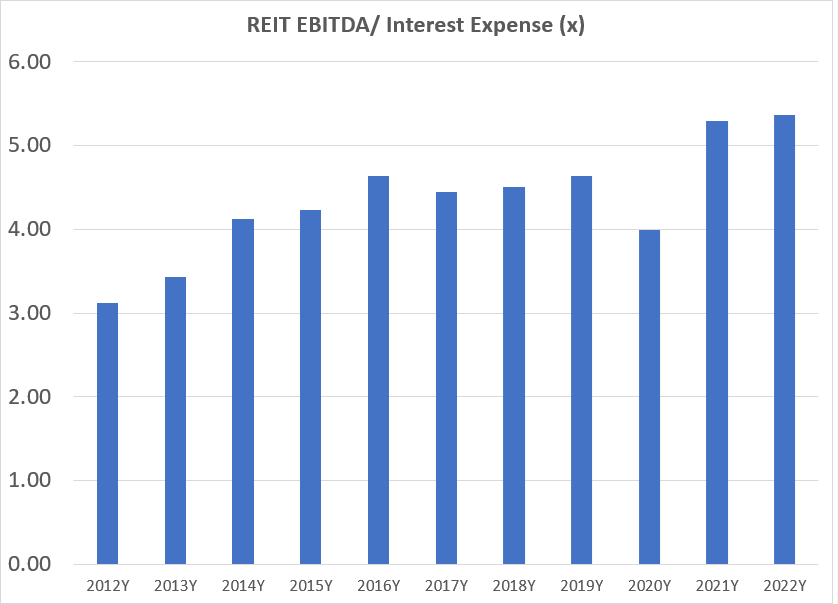
REITs remember the lessons from the financial crisis and have largely been funding growth with equity capital. The blue bars below represent the incremental spend on additional properties. Some of it came from debt but the majority came from equity issuance.
Chart by Dane Bowler with data from S&P Global Market Intelligence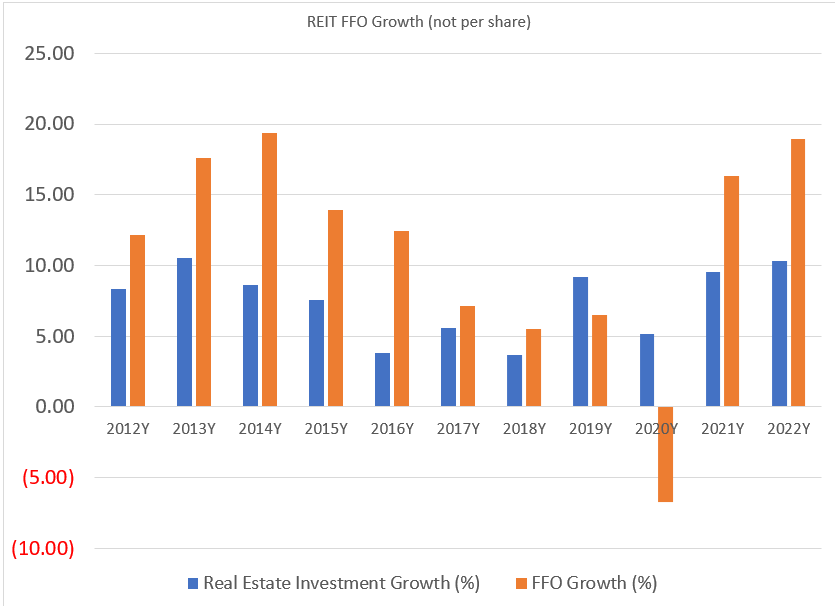
Even with all this equity issued, there was enough organic growth that FFO (the orange bars above) grew by substantially more than investments.
The delta between the orange bars and the blue bars roughly approximates FFO growth on a per share basis while the orange bar is absolute FFO growth.
That is a healthy amount of growth for a decade of deleveraging, especially considering the REITs were supposedly being disproportionately harmed by rising interest rates.
The current state of affairs
Given the quality and balance sheet improvement in REITs, 12.3X forward FFO is unusually cheap relative to the S&P at 17X. It is not quite as extreme as the pricing disparity in 1999, but similar. I'm not saying REITs will triple in the next five years as they did back then, but it is a great setup for outperformance.
10 years of fear is currently baked into REIT share prices, and those fears have not manifested in fundamental damage. In 10 years of a rising rate environment, REIT FFO/share outgrew S&P earnings per share. It is misinformation that became ubiquitous, but the popularity of opinion does not make it correct.
The catalyst
Given the banking crisis and other stresses in the economy, it is likely the Fed will be done raising soon. Once the rate hike cycle has ended, good news will once again be interpreted as good news. The looming fear will go away and multiples will normalize. The FFO growth is already there. Outperformance merely requires a return to normal valuation.
Opportunistic Market Sale: 20% off for a limited time!
Right now, there are abnormally great investment opportunities. With the market crash, some fundamentally strong stocks have gotten outrageously cheap, and I want to show you how to take advantage and slingshot out of the dip.
To encourage readers to get in at this time of enhanced opportunity, we are offering a limited time 20% discount to Portfolio Income Solutions. Our portfolio is freshly updated and chock full of babies that were thrown out with the market bathwater.
Grab your free trial today while these stocks are still cheap!
This article was written by

2nd Market Capital Advisory specializes in the analysis and trading of real estate securities. Through a selective process and consideration of market dynamics, we aim to construct portfolios for rising streams of dividend income and capital appreciation.
Our Portfolio Income Solutions Marketplace service provides stock picks, extensive analysis and data sheets to help enhance the returns of do-it-yourself investors.
Investment Advisory Services
We now offer a variety of ways to invest with us. Our focus is on maximizing client returns while staying within risk their risk parameters. To learn more about our advisory services you may schedule a 15 minute intro meeting here: https://calendly.com/2mc/intro
Dane Bowler, along with fellow SA contributors Simon Bowler and Ross Bowler, is an investment advisory representative of 2nd Market Capital Advisory Corporation (2MCAC). As a state registered investment advisor, 2MCAC is a fiduciary to our advisory clients.
Full Disclosure. All content is published and provided as an information source for investors capable of making their own investment decisions. None of the information offered should be construed to be advice or a recommendation that any particular security, portfolio of securities, transaction, or investment strategy is suitable for any specific person. The information offered is impersonal and not tailored to the investment needs of the specific person. Please see our SA Disclosure Statement for our Full Disclaimer.
Disclosure: I/we have no stock, option or similar derivative position in any of the companies mentioned, and no plans to initiate any such positions within the next 72 hours. I wrote this article myself, and it expresses my own opinions. I am not receiving compensation for it (other than from Seeking Alpha). I have no business relationship with any company whose stock is mentioned in this article.
Additional disclosure: All articles are published and provided as an information source for investors capable of making their own investment decisions. None of the information offered should be construed to be advice or a recommendation that any particular security, portfolio of securities, transaction, or investment strategy is suitable for any specific person.
The information offered is impersonal and not tailored to the investment needs of any specific person. Readers should verify all claims and do their own due diligence before investing in any securities, including those mentioned in the article. NEVER make an investment decision based solely on the information provided in our articles.
It should not be assumed that any of the securities transactions or holdings discussed were profitable or will prove to be profitable. Past Performance does not guarantee future results. Investing in publicly held securities is speculative and involves risk, including the possible loss of principal. Historical returns should not be used as the primary basis for investment decisions.
Commentary may contain forward looking statements which are by definition uncertain. Actual results may differ materially from our forecasts or estimations, and 2MC and its affiliates cannot be held liable for the use of and reliance upon the opinions, estimates, forecasts, and findings in this article.
S&P Global Market Intelligence LLC. Contains copyrighted material distributed under license from S&P
2nd Market Capital Advisory Corporation (2MCAC) is a Wisconsin registered investment advisor. Dane Bowler is an investment advisor representative of 2nd Market Capital Advisory Corporation.