Materials Ebb Amid A Quiet Dollar, XLB Momentum Waning

Summary
- Materials stocks, sensitive to the economic cycle, have come under pressure considering renewed recession jitters.
- The USD has rebounded but is very tame at the moment - watch the greenback for key implications on XLB.
- I'm a hold on XLB for its weakening momentum, and I highlight one key price range to monitor for clues on the next move.
courtneyk
Going into the Fed meeting, the dollar was all too quiet. The greenback drives price action in resource-sensitive stocks found in the Materials sector. The Materials Select Sector SPDR fund (NYSEARCA:XLB) is one of the most popular ways to play the space, and I see shares as continuing to slog through tough resistance in the highly cyclical space.
I am upgrading the ETF to a hold recommendation as it appears a bottom is in, but momentum is not great. My profile of XLB last November was still optimistic about XLB long-term.
Dollar Rises From its Groundhog Day Low, Quiet Lately
Stockcharts.com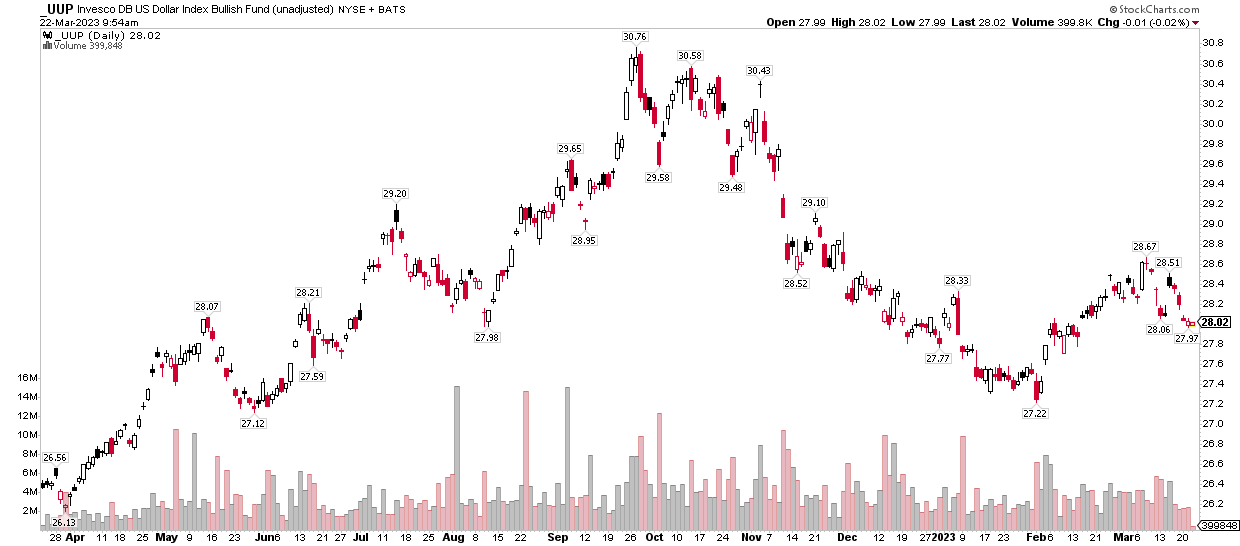
According to SSGA Funds, XLB seeks to provide precise exposure to companies in the chemical, construction material, containers and packaging, metals and mining, and paper and forest products industries. Tracking the S&P 500 Materials sector index, the fund allows investors to take strategic or tactical positions at a more targeted level than traditional style-based investing.
With an expense ratio of just 0.10% annually and a median 30-day bid/ask spread of a single basis point, tradeability is on the fund, and average volume is about 6 million shares daily. XLB has a nearly 25-year track record and pays quarterly dividends with a current yield of 2.3%, above the S&P 500’s 1.8% rate.
SSGA lists 3-5 year EPS growth in the 8% to 9% range while its price-to-earnings ratio is somewhat attractive at 16.6 when using forward estimates. That yields a PEG ratio under two, which indicates a decent long-term value. The ETF houses 29 equities with a weighted-average market cap of $60 billion.
Digging into the portfolio, Morningstar shows that XLB is primarily a large-cap blend fund, but there’s also significant mid-cap exposure, adding to the fund's elevated beta.
XLB: Portfolio & Factor Profiles
Morningstar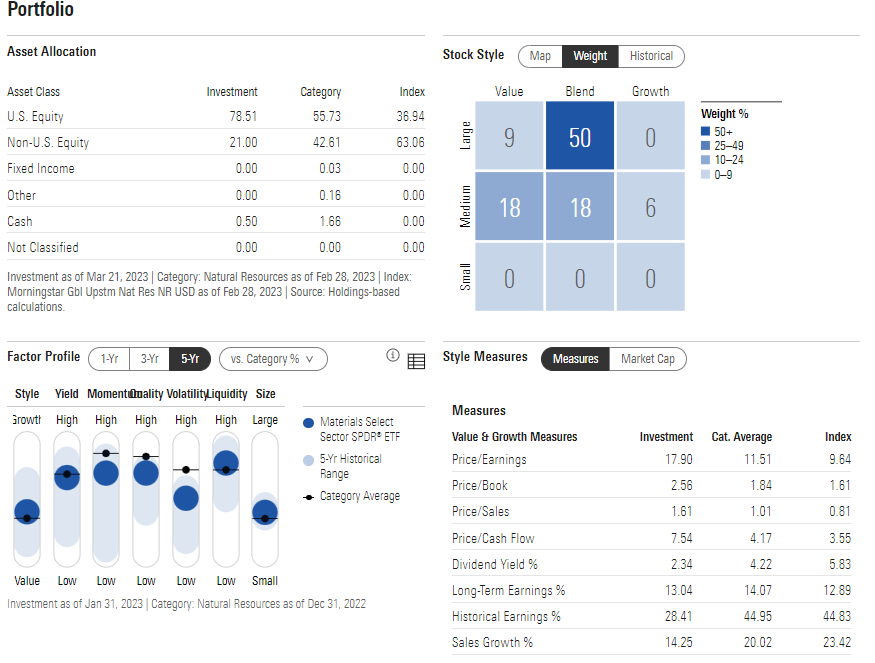
A key risk for XLB holders is that the fund is concentrated in just a handful of stocks. The top 10 holdings account for 64% of total assets with Linde plc (LIN) making up nearly one-fifth of the ETF. The volatile Chemicals industry is 68% of XLB, so monitoring key happenings in that space is critical.
Overall, I like the fundamental valuation, but XLB should be a small part of an investor’s allocation given that it’s such a minor piece of the S&P 500 and is concentrated.
XLB: Focused On A Few Names
SSGA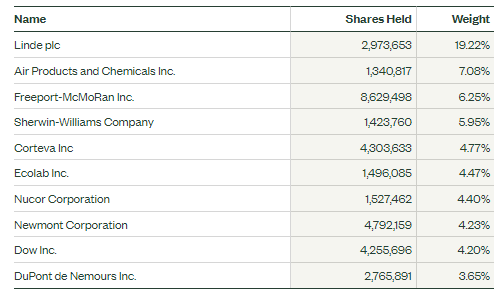
Seasonally, data from Equity Clock show that XLB tends to rally through April before chopping around into early October. I also took a look at the relative seasonal performance chart against the S&P 500, and Materials often outperform from early February through early July before sinking against the SPX into early October. These are just things to keep in mind for sector allocation strategy.
XLB: Bullish Seasonality
Equity Clock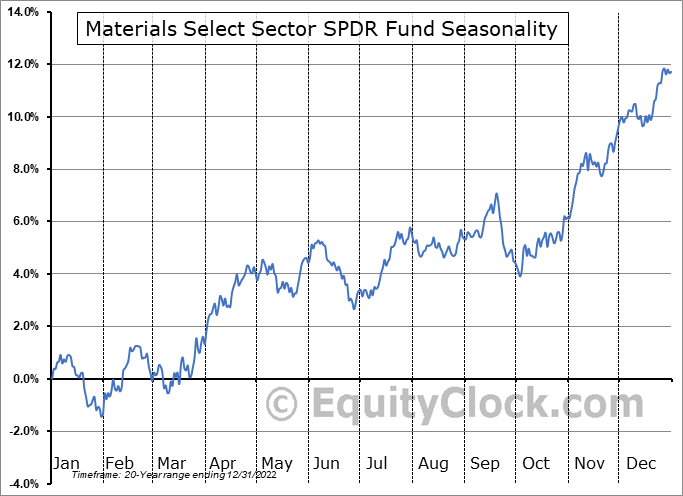
The Technical Take
XLB’s chart does not look as strong as the S&P 500’s in my view. The SPX is putting in higher highs and higher lows off the October nadir while XLB fell below a key range established in January and February. The fund’s 200-day moving average remains negative with shares swinging back and forth around that line.
Also notice in the graph below that there has been big volume lately on some bearish price sessions, helping to confirm a near-term bearish tilt. The key range to watch is from $77 to $80 – if it can climb above that zone and hold it, then the outlook is brighter. Under it, though, the bears likely maintain their grip.
Materials: A Sideways Trade In The Last 12 Months
Stockcharts.com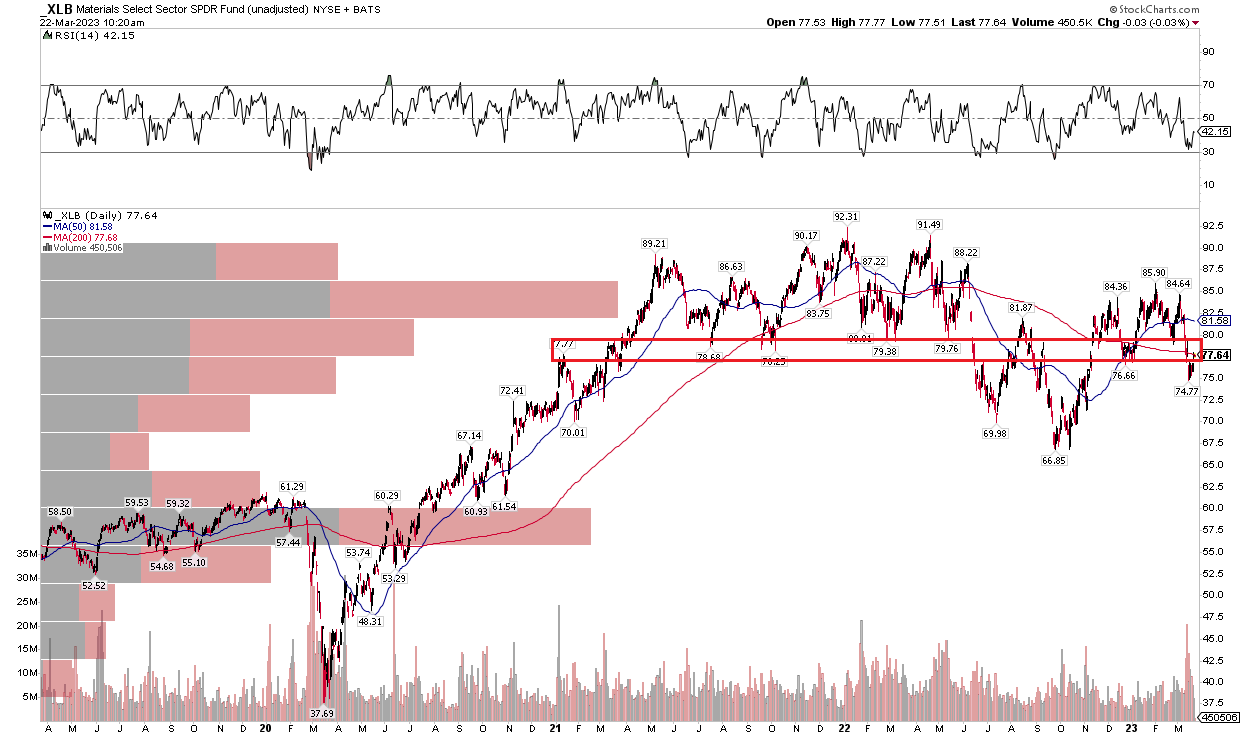
The Bottom Line
I am upgrading XLB to a hold from a sell as the October lows appear to be a solid foundation, but momentum has waned recently.
This article was written by

Disclosure: I/we have no stock, option or similar derivative position in any of the companies mentioned, and no plans to initiate any such positions within the next 72 hours. I wrote this article myself, and it expresses my own opinions. I am not receiving compensation for it (other than from Seeking Alpha). I have no business relationship with any company whose stock is mentioned in this article.