
The return on equity (ROE) for the stock stood at 18.95 per cent. Traded volume on the counter stood at 10:36AM shares and turnover at Rs 0.69 crore around that time. The stock of Pidilite Industries Ltd. quoted a 52-week high price of Rs 2916.85 and 52-week low prices of Rs 1988.6, respectively.
The stock's Beta value, which measures its volatility in relation to the broader market, stood at 1.04.
Promotor/FII Holding
Promoters held 69.4 per cent stake in the company as of 31-Dec-2022, while FIIs held 11.08 per cent and domestic institutional investors had 4.08 per cent.
Key Financials
The company reported consolidated sales of Rs 3002.72 crore for the quarter ended 31-Dec-2022, down 0.64 per cent from previous quarter's Rs 3022.13 crore and down 5.14 per cent from the year-ago quarter's Rs 2855.89 crore. Net profit after tax for the latest quarter stood at Rs 304.17 crore, down 15.15 per cent from the same quarter a year ago.
Technicals
The MACD signalled a bullish bias on the counter. The MACD is known for signalling trend reversals in traded securities or indices.
It is the difference between the 26-day and 12-day exponential moving averages. A nine-day exponential moving average, called the signal line, is plotted on topof the MACD to reflect "buy" or "sell" opportunities. When the MACD crosses below the signal line, it gives a bearish signal, indicating that the price of the security may see a downward movement and vice versa.
 Wednesday, 22 Mar, 2023
- Front Page
- Pure Politics
- Brands & Companies
- ET Markets
- More
 Ola Electric Kicks Off $250-300m Fundraise Plan
India’s largest electric two-wheeler company Ola Electric Mobility is planning to raise a fresh round of $250-300 million in growth equity to expand two-wheeler operations and fund its planned battery facility, said people with knowledge of the matter.
 Bond Sales: PNB, IOB & DCB Bank may Face Higher Funding Costs
Punjab National Bank (PNB), Indian Overseas Bank (IOB) and DCB Bank may have to negotiate higher funding costs as these lenders seek to sell bonds amid a global turmoil caused by the Swiss regulator's write-down of nearly $17 billion of Additional Tier 1 (AT-1) instruments in the Credit Suisse bailout.
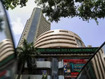 D-St Back in Green as Credit Suisse Deal Soothes Investors
Indian equities rose on Tuesday, tracking the overnight rebound in the US markets, on hopes that the banking crisis might be eased for now following Credit Suisse’s acquisition by UBS. The decline in crude oil prices also alleviated some worries. Investors are now awaiting the outcome of the US Federal Reserve’s monetary policy meeting on Wednesday.
Read More News on
Download The Economic Times News App to get Daily Market Updates & Live Business News.


 Get Unlimited Access to The Economic Times
