Star Bulk Carriers: Increasing Capesize Rates Vs. Weak Q4 2022 Performance

Summary
- As a result of higher iron ore demand in China, Capesize rates are increasing.
- Also, the low order book for dry bulk vessels can support TCE rates.
- However, Star Bulk’s financial position is not as good as it was a few quarters ago.
- The company distributes 90% of its net income as dividends, which puts the company at risk of dividend reduction in the future.
- SBLK stock is a hold.
sandsun
Star Bulk Carriers' (NASDAQ:SBLK) TTM dividend yield is 25% and its forward dividend yield is 11.73%. The company's TTM cash dividend payout ratio is 90%, significantly higher than the sector median cash dividend payout ratio (TTM) of 34% and its 5-year average cash dividend payout ratio of 33%, which has put Star Bulk at risk of a further dividend reduction, limited the company's potentials to expand its business and has left no room for the company to increase its payout ratio. All of these happened as the Skyrocketed dry bulk shipping rates dropped in 2022. However, due to the recovery in the construction sector in China that is expected to continue, TCE rates increased in the past month, especially for Capesize vessels, which account for more than 50% of SBLK's fleet. SBLK's 1Q 2023 financial results are expected to be weaker than the previous quarter. However, I expect the company's TCE revenues to increase for the rest of the year.
Quarterly results
In its 4Q 2022 financial results, SBLK reported voyage revenues of $295 million, compared with $500 million in the same period last year and $364 million in 3Q 2022. The company's net income dropped from $300 million in 4Q 2021 to $110 million in 3Q 2022 and decreased further to $86 million in the fourth quarter of 2022. Star Bulk reported net cash provided by operating activities of $116 million in the fourth quarter of 2022, compared with $296 million in the same period last year, and $184 million in 3Q 2022. The company declared a dividend distribution of $0.6 per share for the fourth quarter of 2022, compared with a dividend distribution of $1.20 in the previous quarter. For the full-year 2022, Star Bulk distributed a dividend of $5.10 per share, or $525.7 million.
"During the last few months we completed new debt refinancings totaling ~$430 million, effectively reducing our annual interest cost by ~$5.2 million," the CEO commented. "Despite the current seasonal spot market weakness, the long term prospects of the dry bulk market remain encouraging given the 25-year low orderbook and the positive effect on dry bulk demand from the Chinese economy re-opening. Star Bulk is well positioned due to its scrubber fitted and diverse fleet to take advantage of a recovery in the dry bulk freight rates," he continued.
The market outlook
As TCE rates dropped continuously in 2022, SBLK's TCE revenues decrease from $428 million in 4Q 2021 to $267 million in 3Q 2022 and decreased further to $216 million in 4Q 2022. Star Bulk reported a TCE rate of $19590 in 4Q 2022, compared with $37406 in 4Q 2021 and $24365 in 3Q 2022. As dry bulk rates decreased further in January and February, I expect Star Bulk's TCE revenues in the first quarter of 2023 to be lower than in 4Q 2022. Also, I expect it to be much lower compared with the same period last year. However, SBLK's TCE revenues can increase for the rest of the year.
Figure 1 shows that in February 2023, the Baltic Dry Index dropped to below the 1-year trend line and bounced back in March, reaching the 1-year mean. However, despite the higher Baltic Dry Index in the past few weeks, to be considered as recovered, the Index still needs to increase much further. Figure 2 shows that dry time charter estimates (1 year) for Capesize vessels increased significantly in the past few months. It is important to know that Newcastlemax/Capesize vessels account for 54.6% of Star Bulk's fleet (see Figure 3). Also, Panamax/Kamsarmax vessels and Ultramax/Supramax vessels account for 29.8% and 15.6% of SBLK's fleet, respectively. Dry time charter estimates (1 year) for Panamax/Kamsarmax vessels in the week ending 15 March 2023 were lower than in the week ending 14 December 2022; however significantly higher than in the week ending 15 February 2023. Finally, the dry time charter estimates (1 year) for Ultramax/Supramax vessels increased by 30% in the past month.
The reason behind the recent increase in dry bulk shipping rates can be traced back to the reopening of China as the country's steel production and consumption increased in the past few weeks. China's rebar consumption in February 2023, increased to more than its levels in the same month in the last 4 years. It is worth noting that China accounts for more than 70% of global seaborne iron ore imports.
IMF estimates the Chinese economy to grow by 5.2% in 2023 (0.8 percentage point higher than IMF's previous forecast). China's economic recovery can increase the demand for iron ore as it is expected to improve construction in China. More demand for iron ore means more demand for Capesize vessels. Thus, I expect Capesize rates to continue increasing and Star Bulk can benefit considerably from higher Capesize rates in the following months. It is worth mentioning that given the low order book for dry bulk carriers, the TCE rates are supported in the following years. Thus, further recovery in demand for dry bulk ships can increase TCE rates at a relatively high pace.
Figure 1 - Baltic Dry Index
tradingeconomics.com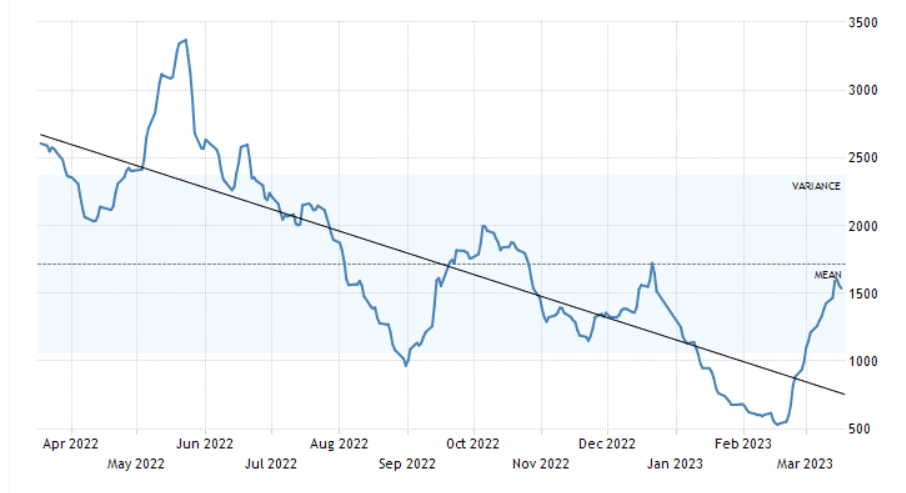
Figure 2 - Dry time charter estimates
www.hellenicshippingnews.com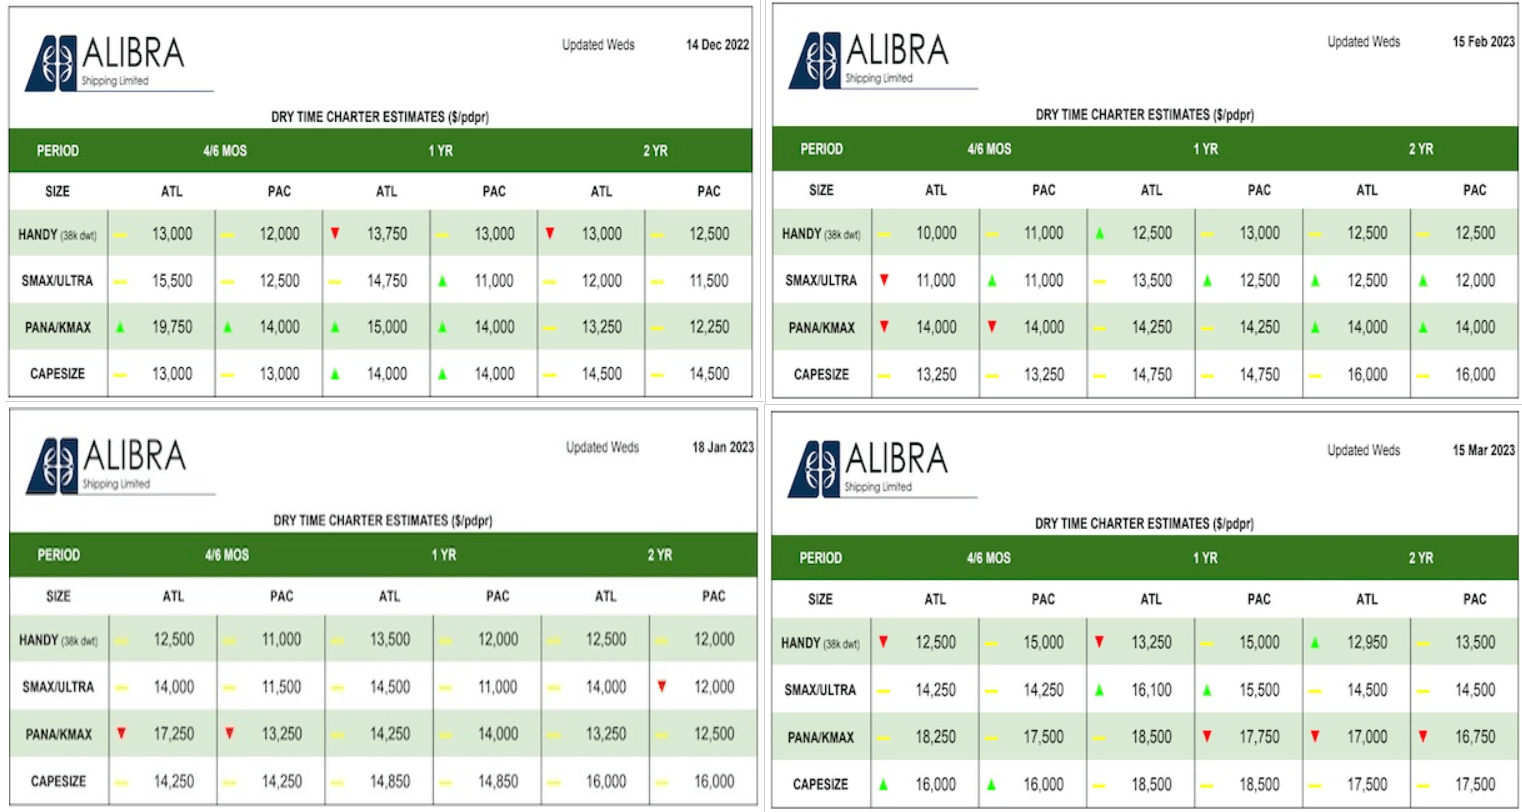
Figure 3 - SBLK's fleet breakdown
4Q 2022 presentation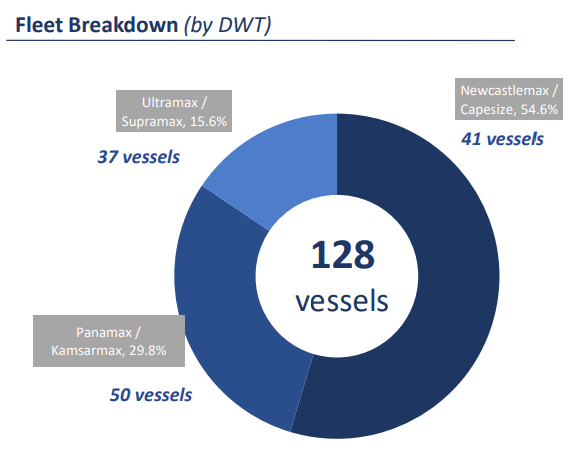
SBLK performance outlook
In this section, I investigated Star Bulk Carrier's balance sheet to analyze its performance during previous years. As is observable, in 2022, SBLK's overall condition was weaker than at the end of 2021. The company's cash generation was $270 million in 4Q 2022, which is 40% lower year over year, compared with $450 million in 4Q 2021. Moreover, the company's EBITDA dropped by 17% compared with 3Q 2022 and over 60% year over year versus $358 million at the end of 2021. On the other hand, the company's net debt level stayed on a constant path in 2022 and reached $1031 million in 4Q 2022, which is slightly lower than $1140 million in 4Q 2021. Furthermore, notwithstanding a slight decline in SBLK's total equity of $2019 million in 4Q 2022 compared with $2080 million at the end of 2021, thankfully, its equity level is still well higher than the net debt (see Figure 4).
Figure 4 - SBLK's financial data (in millions)
Author (based on SA data)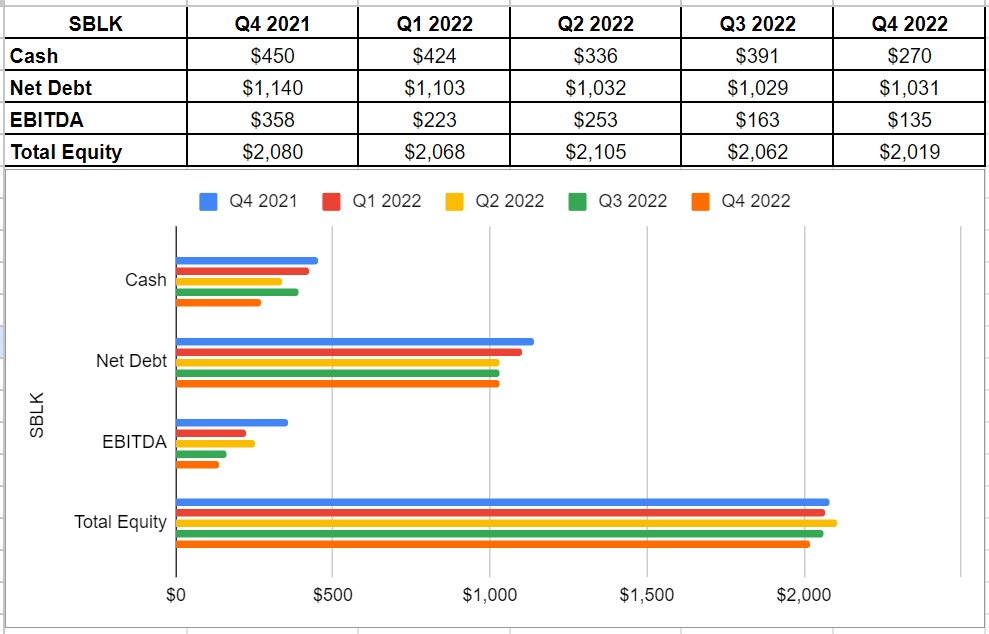
Star Bulk Carrier has an appealing dividend yield of around 25%. However, the company's dividend payout ratio (DPR) is about 90%. To be more accurate, the dividend payout ratio is the amount of dividend that is paid to investors from its net income. In other words, SBLK is distributing about 90% of its net income to shareholders in the form of dividends. Albeit some new investors may assume a company with a high DPR is well-performed, it is worth mentioning that it depends on their investment goals. More specifically, dividend payout ratios vary by industry. A high DPR means that the company is reinvesting less money back into its business and thus focuses less on business growth. Thus, the company tends to attract income investors rather than growth investors. When all was said and done, by distributing about 90% of its net income into dividends, SBLK potentially puts itself at risk of a dividend reduction in case of weaker business and market conditions (see Figure 5). However, higher iron ore demand from China can cause TCE rates to increase further. Thus, Star Bulk's TCE revenues can be supported and the risk of the company's high payout ratio can be mitigated.
Figure 5 - SBLK's dividend safety grade
Seeking Alpha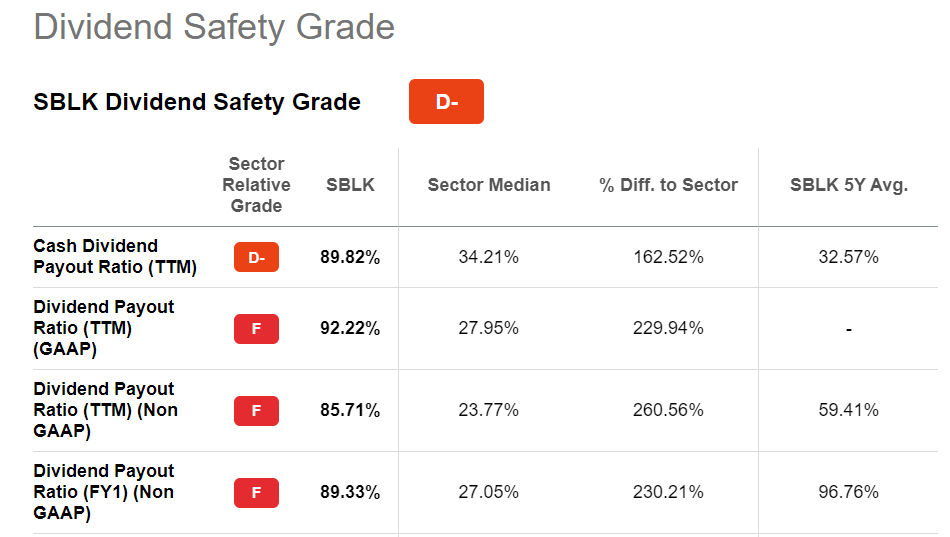
Moreover, I investigated the leverage condition of Star Bulk Carrier. Leverage ratios are insightful to show how the company is financing its assets and business operations. In other words, does it use debt or equity financing for most of its operations? I used some common leverage ratios that have significant comparability to its debt. The ratios are calculated in comparison with previous quarters to be more helpful.
The debt-to-assets ratio is one of the significant calculations that measure the company's debt capacity. This ratio indicates the proportion of assets that are being financed with debt. Thereby, the higher the ratio, the greater the degree of leverage and financial risks. The debt-to-asset ratio of Star Bulk was at a constant level of 0.30 during the last year. On the other hand, their net debt-to-EBITDA ratio has been on an upward path continuously in 2022 and reached 7.62 in 4Q 2022 compared with its level of 3.19 at the end of 2021, which is not surprising due to the drop in the company's EBITDA amount. The net debt-to-EBITDA depicts a picture of how long Star Bulk would need to operate at its current condition to pay off its debt, and thus, its high ratio indicates that the company has a heavy debt load (see Figure 6). As I expect SBLK's 1Q 2023 cash provided by operating activities to be lower than in 4Q 2022, the company's debt load is expected to decrease. However, higher levels of adjusted EBITDA that are expected in the second half of 2023, can help the company to decrease its net debt-to-EBITDA ratio.
Figure 6 - SBLK's leverage ratios
Author (based on SA data)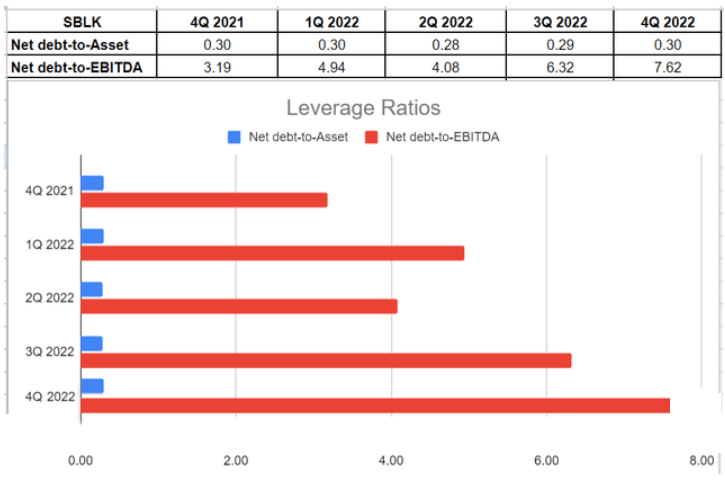
Summary
In the fourth quarter of 2022, a drop in the company's EBITDA level led to a higher net debt-to-EBITDA ratio. Moreover, the company's significantly high payout ratio has put Star Bulk in a risky position. However, the recent recovery in dry bulk shipping rates, especially Capesize rates, can help the company's TCE revenues to start increasing in 2Q 2023, improving its cash position. The stock is a hold.
This article was written by

Disclosure: I/we have no stock, option or similar derivative position in any of the companies mentioned, and no plans to initiate any such positions within the next 72 hours. I wrote this article myself, and it expresses my own opinions. I am not receiving compensation for it (other than from Seeking Alpha). I have no business relationship with any company whose stock is mentioned in this article.