SoFi Technologies: Financial Services Driving Superb Growth

Summary
- We forecasted the company's Lending segment to increase from $1.1 bln in 2022 to $1.48 bln by 2025.
- We expect Technisys to drive Technology Platform growth by 103.1% in 2023 and we expect SoFi’s Technology Platform revenue to increase to $963 mln by 2025.
- We expect the Financial Services segment to almost double from $168 mln in 2022 to $318 mln in 2025.
alexsl
This analysis delves into the three primary segments of SoFi Technologies, Inc. (NASDAQ:SOFI), namely Lending, Technology Platform, and Financial Services. Notably, prior to its Initial Public Offering in June 2021, the company experienced impressive double-digit growth across all segments, with Lending contributing the lion's share of revenue at 71.8% in 2022. However, with the strategic acquisitions of Galileo and Technisys in 2020 and 2022, respectively, SoFi Technologies appears to be directing its efforts toward bolstering growth in its Technology Platform segment. Therefore, the following paragraphs will analyze and determine which segment is likely to drive the company's growth trajectory in the future.
SoFi Segments ($ mln) | 2019 | 2020 | 2021 | 2022 | Average |
Lending (adjusted net revenue) | 443 | 537 | 764 | 1,107 | |
Growth % | 21.1% | 42.4% | 44.9% | 36.1% | |
Technology Platform | 1 | 96 | 195 | 315 | |
Growth % | 12,015% | 102.3% | 61.7% | 4059.8% | |
Financial Services | 4 | 12 | 58 | 168 | |
Growth % | 201.9% | 389.3% | 188.7% | 260.0% | |
Others | 4 | (24) | (6) | (49) | |
Total | 451 | 621 | 1,010 | 1,540 | |
Growth % | 37.6% | 62.6% | 52.5% | 50.9% |
Source: Company Data, Khaveen Investments
Lending Revenue Driven by Personal Loans
SoFi Lending Segment | 2019 | 2020 | 2021 | 2022 | Average |
Personal Loans Products ('000) ('a') | 501 | 610 | 837 | ||
Personal Loans Origination Volume per Product ($ '000s) ('b') | 5.2 | 8.8 | 11.7 | ||
Growth % | 71.4% | 32.2% | 51.8% | ||
Personal Loans Origination Volume ($ mln) ('c') | 3,733 | 2,581 | 5,387 | 9,774 | |
Student Loans Products ('000) ('d') | 403 | 446 | 477 | ||
Student Loans Origination Volume per Product ($ '000s) ('e') | 12.2 | 9.6 | 2.8 | ||
Growth % | -21.3% | -70.5% | -45.9% | ||
Student Loans Origination Volume ($ mln) ('f') | 6,695 | 4,930 | 4,293 | 1,356 | |
Home Loans Products ('000) ('g') | 14 | 23 | 26 | ||
Home Loans Origination Volume per Product ($ '000s) ('h') | 156.0 | 129.5 | 37.2 | ||
Growth % | -17.0% | -71.3% | -44.2% | ||
Home Loans Origination Volume ($ mln) ('i') | 774 | 2,184 | 2,978 | 966 |
*c = a × b, f = d × e, i = g × h
Source: Company Data, Khaveen Investments
From the table above, despite all 3 products seeing an increase in products from 2020 to 2022, origination volumes for Student Loans and Home Loans decreased in 2022 by 68.4% and 67.6% respectively. On the other hand, origination volumes for Personal Loans increased by 81.4%. We calculated the Origination Volume per Product for the 3 products and realized that Origination Volume per Product had a 2-year average increase of 51.8% for Personal Loans whereas there was a decrease of 45.9% and 44.2% respectively for Student Loans and Home Loans.
SoFi Lending Segment | 2019 | 2020 | 2021 | 2022 | Average |
Total Origination Volume ('$ mln') ('a') | 11,202 | 9,695 | 12,658 | 12,096 | |
Growth % | -13.5% | 30.6% | -4.4% | 4.2% | |
Revenue per Origination Volume (take rate) (%) ('b') | 4.0% | 5.5% | 6.0% | 9.2% | |
Growth % | 40.0% | 9.0% | 51.7% | 33.5% | |
Net Revenue ($ mln) ('c') | 443 | 537 | 764 | 1,107 | |
Growth % | 21.1% | 42.4% | 44.9% | 36.1% |
* c = a × b
Source: Company Data, Khaveen Investments
We collated the Net Revenue and Total Origination Volume for SoFi’s Lending segment for the past 4 years and calculated the Revenue per Origination Volume for its Lending segment. Despite origination volumes decreasing by 13.5% and 4.4% in 2020 and 2022 respectively, Revenue per Origination Volume has increased since 2020, with a 3-year average growth of 33.5%.
Over the past 5 years, the average total student debt has plateaued and slightly declined to around $30,000 whereas the US Household Income per Capita has grown at an average of 4.1%. This might have reduced debt uptake, improved credit scores, and encouraged early repayment of student loans. The housing mortgage market has worsened due to higher interest rates and inflation according to CNBC.
SoFi Lending Segment | 2022 | 2023F | 2024F | 2025F |
Total Origination Volume ($ mln) | 12,096 | 13,676 | 15,052 | 16,115 |
Growth % | -4.4% | 13.1% | 10.1% | 7.1% |
Revenue per Origination Volume (take rate) (%) | 9.2% | 9.2% | 9.2% | 9.2% |
Growth % | 3.1% | 0.0% | 0.0% | 0.0% |
Net Revenue ($ mln) | 1,107 | 1,252 | 1,377 | 1,475 |
Growth % | 44.9% | 13.1% | 10.1% | 7.1% |
Source: Company Data, Khaveen Investments
To project SoFi’s Lending segment revenues, we used a 2-year historical average for its Total Origination Volume of 13.1% and tapered it by 3% for each year whereas, for its Revenue per Origination Volume, we kept it constant at 9.2% as its members would unlikely take up higher volumes of loans in this high-interest rate environment. Thus, we projected net revenues for the Lending segment to increase from $1.1 bln in 2022 to $1.48 bln in 2025.
Technology Platform Revenue Boosted by Technisys Synergies
SoFi Technology Platform | 1Q2021 | 2Q2021 | 3Q2021 | 4Q2021 | 1Q2022 | 2Q2022 | 3Q2022 | 4Q2022 | Average |
Technology Platform Accounts ($ mln) ('a') | 70 | 79 | 89 | 100 | 110 | 117 | 124 | 131 | |
Growth % | 133.3% | 119.4% | 81.6% | 66.7% | 57.1% | 48.1% | 39.3% | 31.0% | 43.9% |
Revenue per Account ($) ('b') | 0.66 | 0.57 | 0.56 | 0.53 | 0.55 | 0.72 | 0.69 | 0.66 | 0.65 |
Growth % | 1871.4% | 7.9% | -29.4% | -14.1% | -15.6% | 26.0% | 22.0% | 23.9% | 14.1% |
Net Revenue ($ mln) ('c') | 46 | 45 | 50 | 53 | 61 | 84 | 85 | 86 | |
Growth % | 4500.0% | 136.8% | 28.2% | 43.2% | 32.6% | 86.7% | 70.0% | 62.3% | 62.9% |
* c = a × b
Source: Company Data, Khaveen Investments
The table above shows steady increases in the number of Technology Platform Accounts and the growth in net revenue. On a quarterly YoY basis, Technology Platform Accounts increased by an average of 43.9% in 2022 whereas net revenue grew by an average of 62.9% in 2022. Negative growth of Revenue per Account from 3Q2021 to 1Q2022 is likely due to the initial acquisition of Galileo the previous year while the increase from 2Q2022 to 4Q2022 is likely due to the acquisition of Technisys. This resulted in revenue per customer having an average growth increase of 14.1% in 2022 with an average Revenue per Account of $0.65.
In April 2020, SoFi acquired Galileo, a payment processing solutions platform with the use of application programming interfaces ('API') benefiting SoFi’s Financial Services products. Galileo earns revenue by helping companies build consumer and B2B financial services such as account set-ups, ACH transfers, point-of-sale authorizations and more. With the acquisition of Technisys in Feb 2022, it is expected to help established banks build a cloud-native core banking platform to develop digital products such as secured and unsecured credit cards and lending-as-a-service. Technisys also has a “strong presence in Latin America and other emerging markets” as mentioned in its annual report, which we believe can help SoFi expand into those markets.
SoFi Technology Platform | 2020 | 2021 | 2022 | 2023F | 2024F | 2025F |
Technology Platform Accounts ('mln') | 60 | 100 | 131 | 167 | 197 | 223 |
Increase in Accounts | 40 | 31 | 36 | 31 | 26 | |
Revenue per Account ($) | 1.60 | 1.94 | 2.41 | 2.88 | 3.29 | 3.60 |
Growth % | 21.3% | 24.3% | 19.3% | 14.3% | 9.3% | |
Net Revenue Excluding Technisys ($ mln) | 96 | 194 | 154 | 479 | 648 | 801 |
Growth % | 102.1% | -20.9% | 212.3% | 35.3% | 23.5% | |
Revenue from Technisys | 163 | 163 | 163 | 163 | ||
Total Revenue for Technology Platform ($ mln) | 96 | 194 | 316 | 642 | 811 | 963 |
Growth % | 102.1% | 62.9% | 103.1% | 26.4% | 18.8% |
Source: Technisys, Company Data, Khaveen Investments
From the table above, we projected Technology Platform Accounts and Revenue per Account based on its average increase in Technology Platform Accounts of 36 mln and tapering by 5 mln for each following year. Following this we multiplied it by the Revenue per Account, which was projected by tapering its 2022 growth of 24.3% by 5% every subsequent year, to achieve Net Revenue Excluding Technisys. Additionally, from SoFi’s acquisition of Technisys, the company “is expected to add a cumulative $500 to $800 million through year-end 2025” as mentioned by Technisys. Assuming an average of $650 mln recognized, we allocated its revenue synergies from the transaction across 4 years from 2022 to 2025. Despite only driving revenue for Technology Platform to grow by 62.9% in 2022, we expect Technisys to drive Technology Platform growth by 103.1% in 2023 and eventually slow down to 18.8% by 2025. With this projection, we expect SoFi’s Technology Platform revenue to increase from $316 mln in 2022 to $963 mln in 2025.
Financial Services Revenue Driven by High Product Growth
SoFi Financial Services Products ('000) | 2020 | 2021 | 2022 | Average |
Invest | 532 | 1,595 | 2,159 | |
Growth % | 199.8% | 35.4% | 117.6% | |
Money | 646 | 1,437 | 2,195 | |
Growth % | 122.4% | 52.7% | 87.6% | |
Relay | 409 | 930 | 1,922 | |
Growth % | 127.4% | 106.7% | 117.0% | |
Credit Card | 6 | 91 | 171 | |
Growth % | 1416.7% | 87.9% | 752.3% | |
Others | 13 | 41 | 107 | |
Total Financial Service Products | 1,606 | 4,094 | 6,554 | |
Growth % | 315.0% | 154.9% | 60.1% | 107.5% |
Source: Company Data, Khaveen Investments
From the table above, we can see that Invest, Money and Relay are the most popular products, with Money overtaking Invest recently in 2021. In total, Financial Services Products increased by an average of 107.5% over the past 2 years, which is likely the growth driver for its revenue which had an average increase of 260%.
- SoFi Invest: Based on a 2-year average of the top 3 products, Invest products experienced the highest growth of 117.6%. According to its annual report, it earns brokerage fees from “share lending and payment for order flow arrangements, exchange conversion services and digital assets activity”.
- SoFi Money: Money experienced the lowest growth among the top 3 products at 87.6%. This segment derives revenues from payment network fees charged on merchants.
- SoFi Relay: Relay had the second highest growth of 117.0% among its top 3 products and is described in its annual report as “a personal finance management product which allows members to track all of their financial accounts in one place and utilize credit score monitoring services”.
- SoFi Credit Card: Launched in H2 2020, SoFi Credit Card has the highest growth at an average of 752% and earns revenues from payment network fees.
Furthermore, in Jan 2022, SoFi received "regulatory approval to become a national bank". SoFi’s Management highlighted the importance of the banking license.
As a bank holding company, we expect to reduce our interest expense as we are able to increasingly use deposit accounts as an alternative and more cost-effective and less interest-rate sensitive source of funding for loans. Additionally, through operating under a national bank charter, we expect to be able to offer a wider range of loan sizes and interest rates through SoFi Bank, which we expect to positively impact our interest income. – SoFi Annual Report
SoFi Financial Services Segment | 2019 | 2020 | 2021 | 2022 | 2023F | 2024F | 2025F |
Total Financial Service Products ('000) | 387 | 1,606 | 4,094 | 6,554 | 8,610 | 10,565 | 12,421 |
Increase in Products ('000) | 1,219 | 2,488 | 2,460 | 2,056 | 1,956 | 1,856 | |
Revenue per Product ($ '000) | 0.01 | 0.01 | 0.01 | 0.03 | 0.03 | 0.03 | 0.03 |
Growth % | -32.6% | 106.8% | 80.9% | 0.0% | 0.0% | 0.0% | |
Net Revenue ($ mln) | 4 | 11 | 58 | 168 | 221 | 271 | 318 |
Growth % | 179.8% | 427.3% | 189.7% | 31.4% | 22.7% | 17.6% |
Source: Company Data, Khaveen Investments
To project net revenues for the Financial Services segment, we decided to calculate and project the Revenue per Financial Service product and multiply it by our projected total Financial Service products. As seen from the table above, we projected the total Financial Services Projects by its 3-year average increase of 2.06 mln and taper it by 100k for each subsequent year; whereas for Revenue per Product, we maintained the same Revenue per Product of $30 per product. We projected the net revenues of the company's Financial Services segment to increase from $168 mln in 2022 to $318 mln in 2025, giving it an average revenue CAGR of 23.9% from 2023 to 2025.
Risk: Still Negative Profitability
Company Data, Khaveen Investments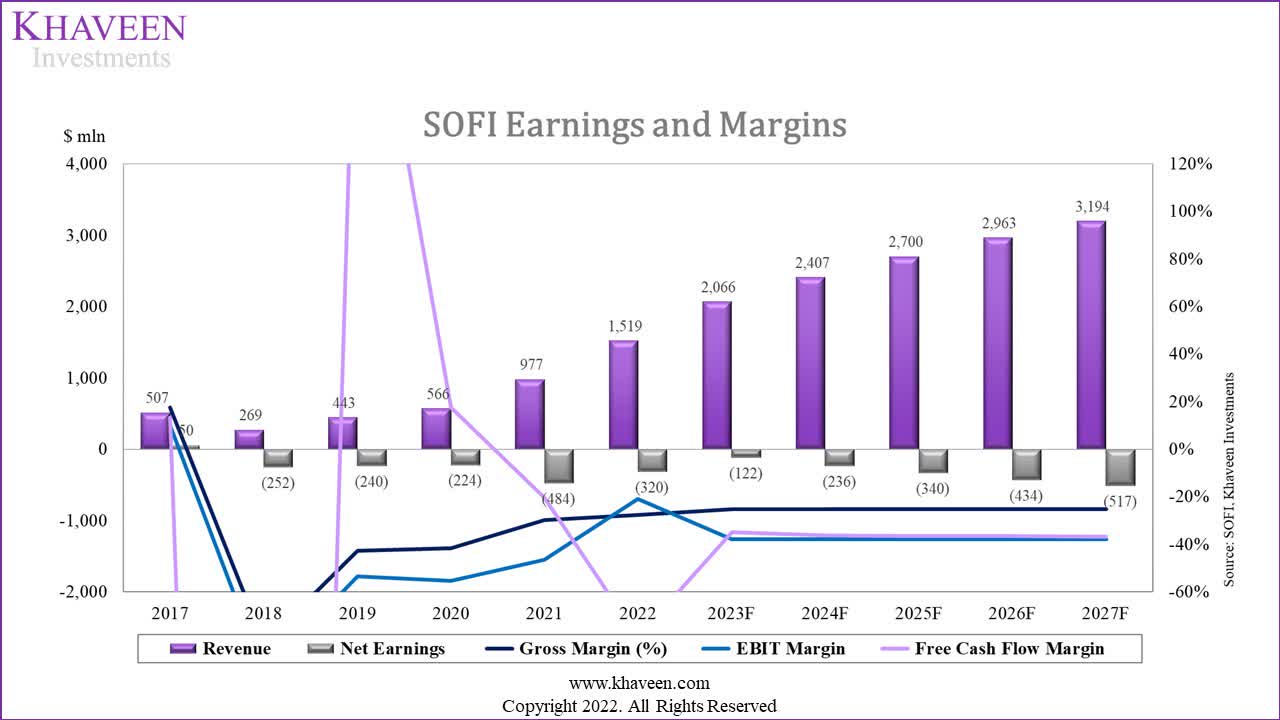
From the graph above, we projected that SoFi would remain unprofitable in the near term even as its revenue continues to grow at an average of 16.44% over the next 5 years. Its gross and EBIT margins would likely continue to be negative due to the high Cost of Sales and Other Expenses incurred. Its Free Cash Flow Margin fluctuated in the initial years due to its numerous acquisitions including Galileo and Technisys. Due to its high growth but negative profitability, we valued SoFi based on the average P/S ratio of the companies in the Fintech industry which has a CAGR of more than 20%.
Verdict
SoFi Revenue Projections ($ mln) | 2022 | 2023F | 2024F | 2025F |
Lending (adjusted net revenue) | 1,107 | 1,252 | 1,377 | 1,475 |
Growth % | 44.9% | 13.1% | 10.1% | 7.1% |
Technology Platform | 315 | 642 | 811 | 963 |
Growth % | 61.7% | 103.7% | 26.4% | 18.8% |
Financial Services | 168 | 221 | 271 | 318 |
Growth % | 188.7% | 31.6% | 22.7% | 17.6% |
Others | (49) | (19) | (19) | (19) |
Total | 1,540 | 2,095 | 2,440 | 2,737 |
Growth % | 52.5% | 36.0% | 16.5% | 12.2% |
Source: Company Data, Khaveen Investments
After conducting a thorough analysis of SoFi, our assessment indicates that the company is well-positioned to sustain its robust revenue growth across all segments, particularly in the Financial Services segment, owing to its impressive organic growth and revenue synergies stemming from the Technisys acquisition in the Technology Platform segment. While we expect Lending to continue to account for the majority of SoFi's revenues, driven largely by Personal Loans, we anticipate that the Technology Platform and Financial Services segments could increasingly contribute a greater proportion of the company's revenue over the next three years.
Seeking Alpha, Khaveen Investments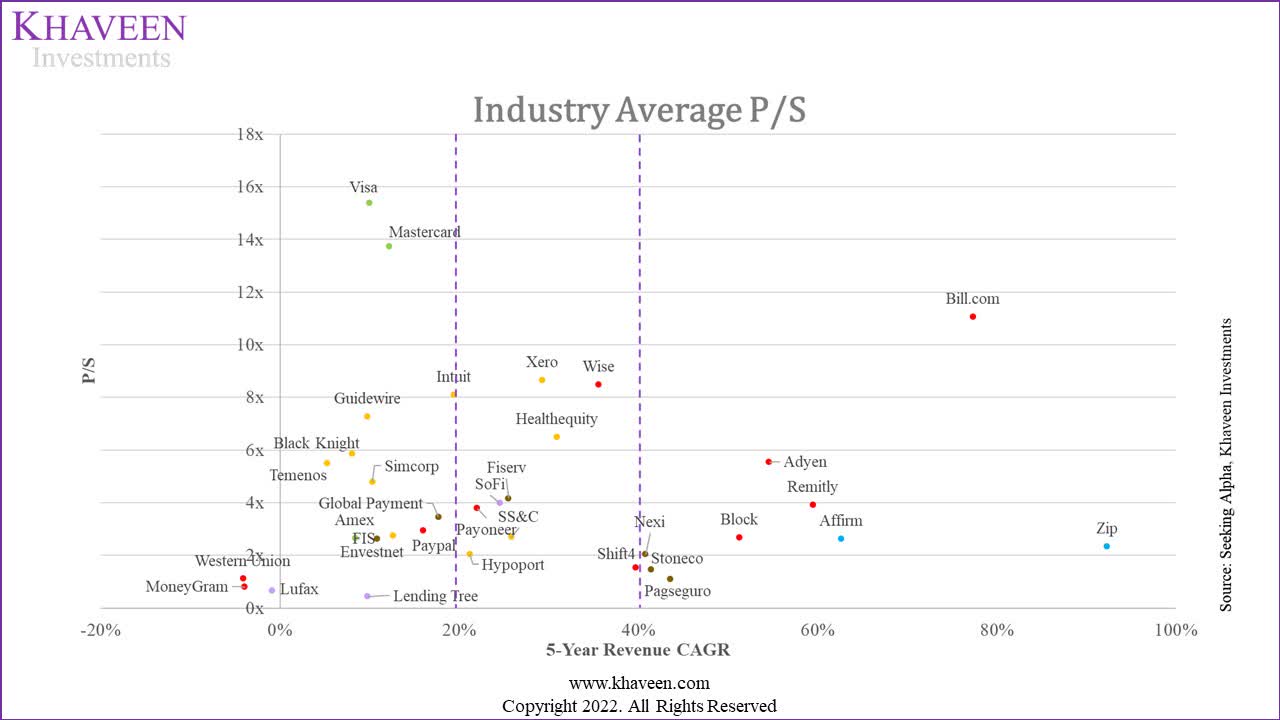
SoFi Valuation | 2023F | 2024F | 2025F |
Sales (2023F) ($ mln) | 2,095 | 2,440 | 2,737 |
Fintech Average P/S Ratio | 3.35 | 3.95 | 4.83 |
SoFi Market Cap (2023F) ($ mln) | 7,009 | 9,628 | 13,226 |
Share Outstanding ('mln') | 934.6 | 934.6 | 934.6 |
Price Target ($) | 7.50 | 10.30 | 14.15 |
Current Share Price ($) | 5.46 | 5.46 | 5.46 |
Upside | 37.37% | 88.69% | 159.20% |
Source: Khaveen Investments
Our valuation of SoFi was conducted using the P/S multiples of Fintech companies with a 5-year CAGR of 20% to 40% which is 4.83x. We applied this to our 2025 revenue forecast and obtained a prorated price target of $14.15 in 2023 to derive a price target of $7.50 with an upside of 37.4%, thus rating the company as a Strong Buy.
This article was written by

Disclosure: I/we have a beneficial long position in the shares of SOFI either through stock ownership, options, or other derivatives. I wrote this article myself, and it expresses my own opinions. I am not receiving compensation for it (other than from Seeking Alpha). I have no business relationship with any company whose stock is mentioned in this article.
Additional disclosure: No information in this publication is intended as investment, tax, accounting, or legal advice, or as an offer/solicitation to sell or buy. Material provided in this publication is for educational purposes only, and was prepared from sources and data believed to be reliable, but we do not guarantee its accuracy or completeness.