Interest Rates May Surge As The Short Squeeze Nears Its End

Summary
- It appears there's a short squeeze taking place in Treasury rates.
- Liquidity in the Treasury futures has evaporated, making the short squeeze even more painful.
- Once liquidity returns and short covering subsides, rates should rise sharply.
- Looking for a helping hand in the market? Members of Reading The Markets get exclusive ideas and guidance to navigate any climate. Learn More »
peshkov
The recent drop in Treasury rates may have gone too far and seems to have held critical technical levels thus far. This suggests that interest rates could rise from current levels.
The primary reason for the sudden move was the news of Silicon Valley Bank's (SIVB) failure, which triggered a flight to safety and induced a massive wave of short covering across the entire yield curve. This has caused rates to drop sharply, giving the impression that the market is pricing in Fed rate cuts.
Short Covering
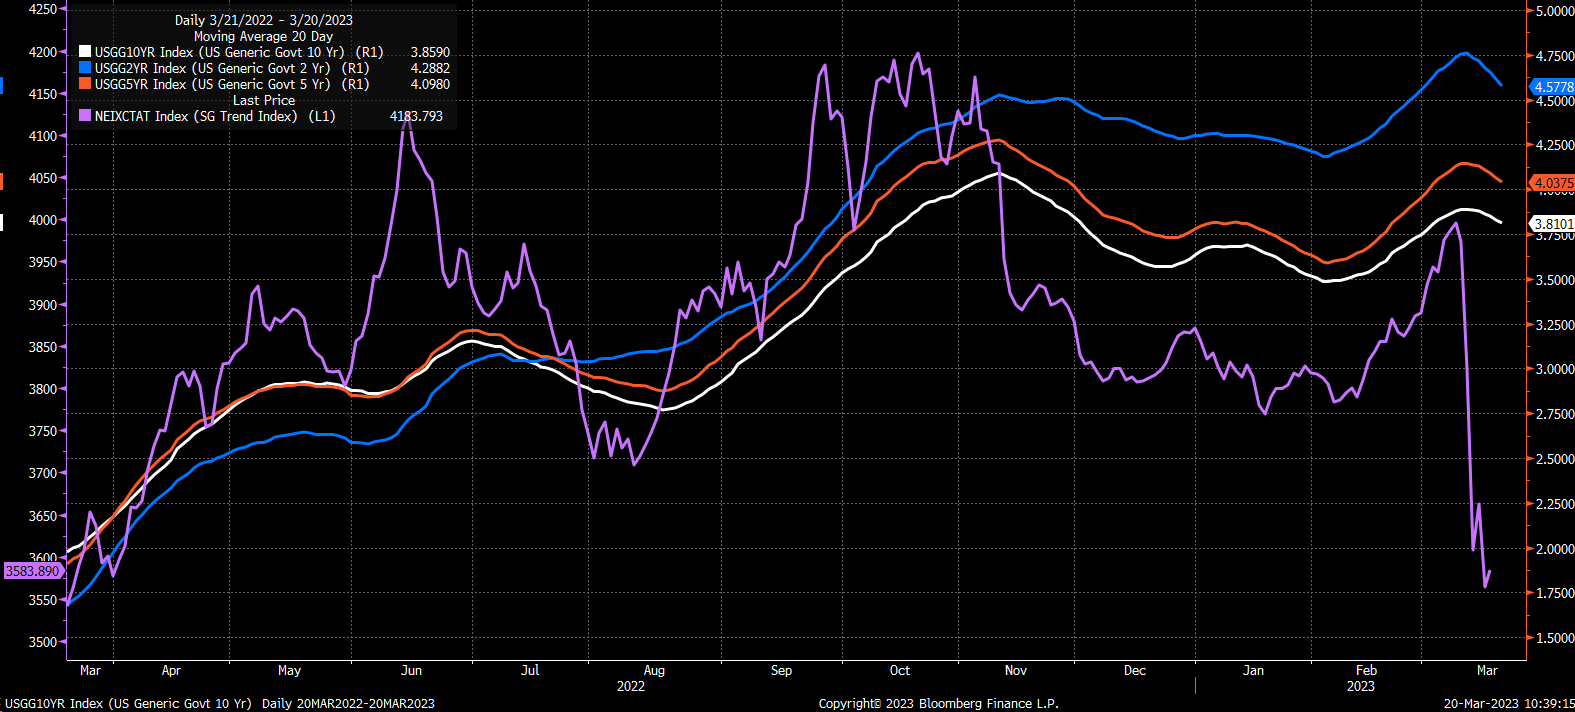
Short positions among leveraged funds across the yield curve have become very large, and these funds have suffered significant losses in recent days, as indicated by the SG Trend Index. The index, which tracks the commodity trade advisor's net daily rate of return, has fallen by 10.3% from March 8 to March 16, wiping out all of the index's gains over the past year.
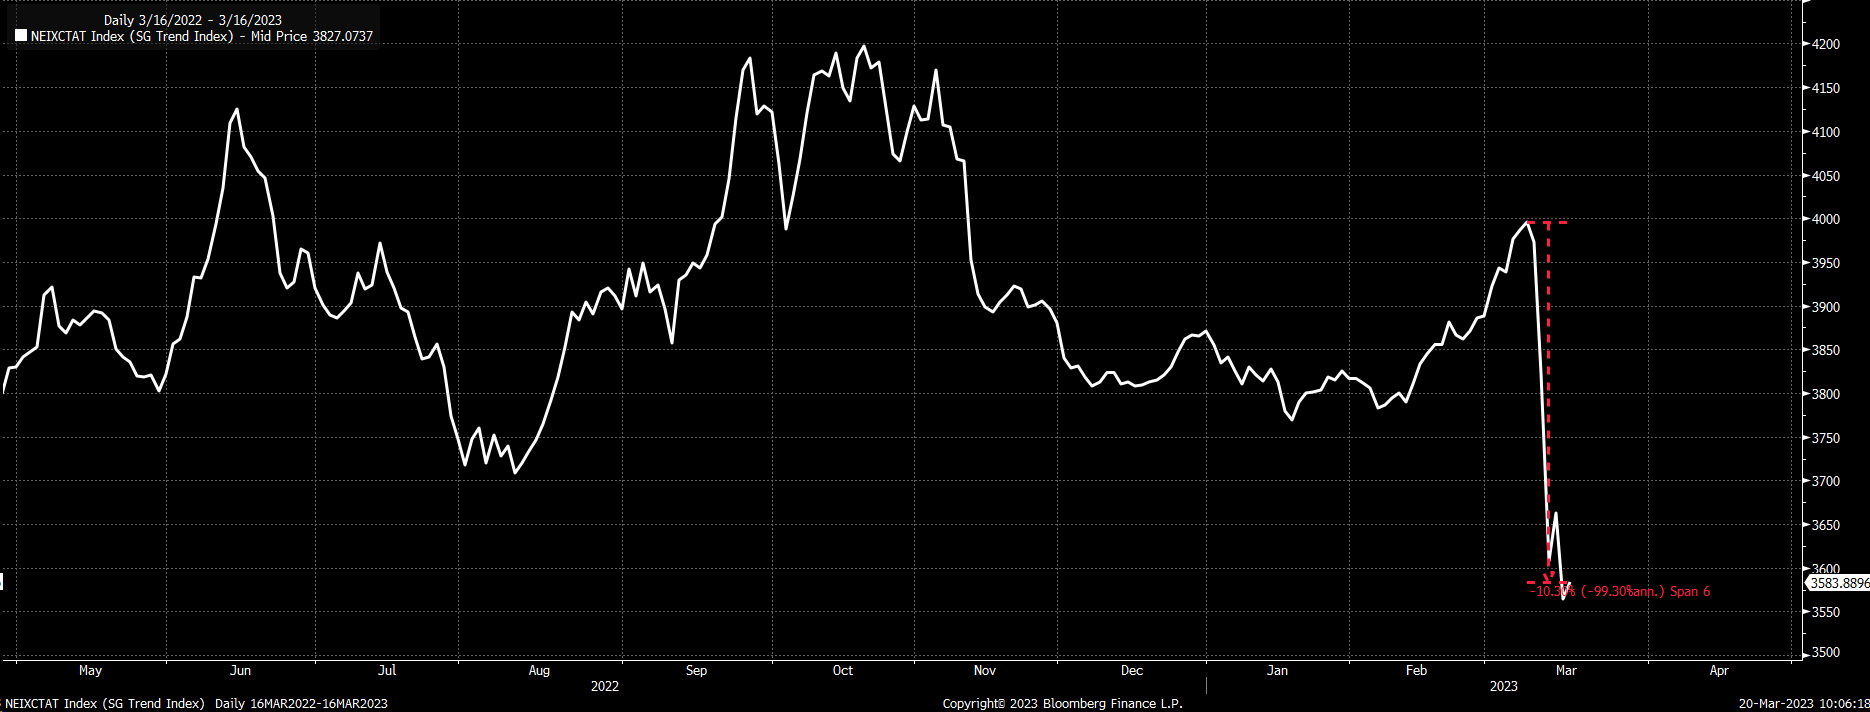
Bloomberg
The SG Trend index has followed the changes in rates over the past two years. This suggests that the recent sharp decline in yields has been the primary driver of the sudden and significant decline in the SG Trend index.
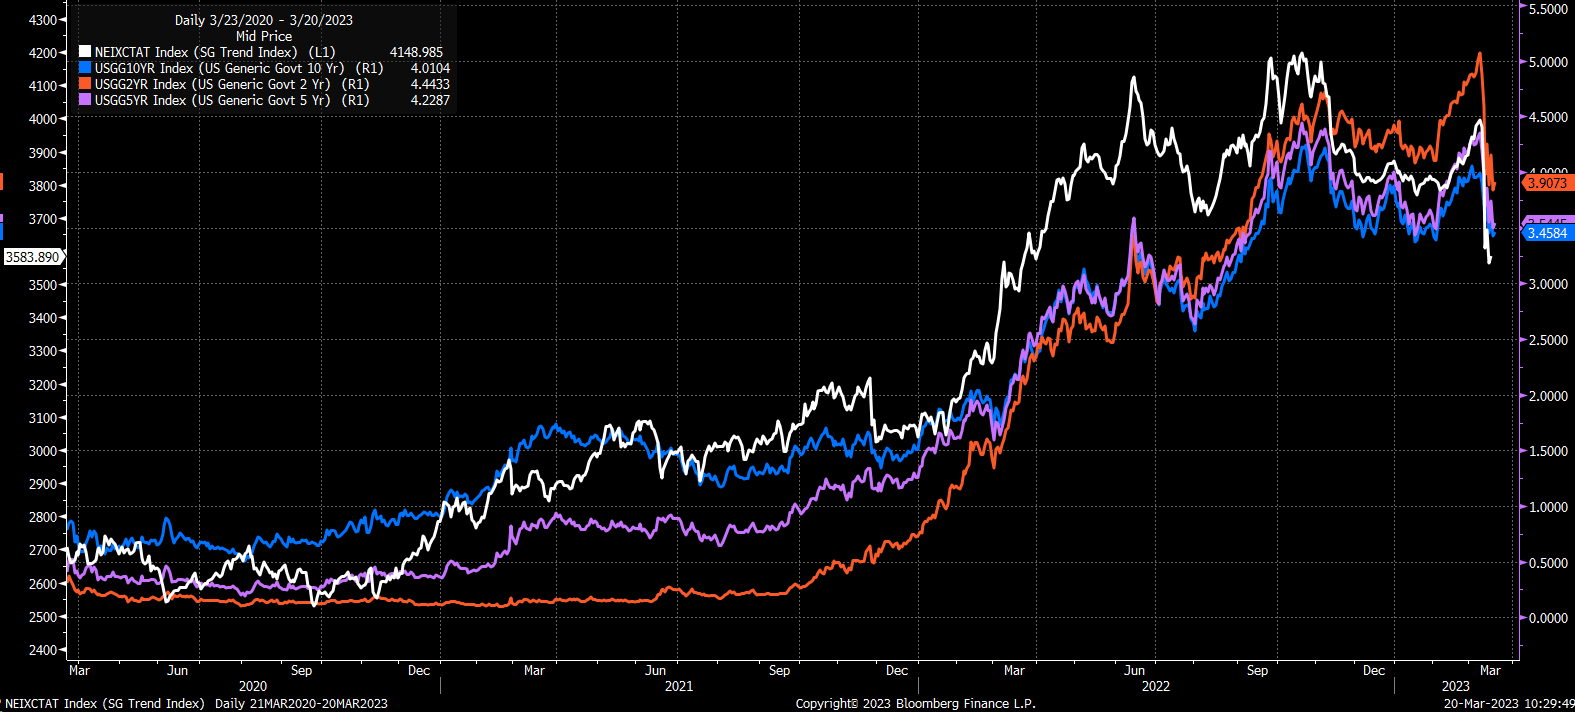
Bloomberg
Over the past several months, the big trade was shorting the yield curve among levered funds because the outlook was for the Fed to raise rates pushing nominal rates higher. This led to a significant build-up in the short positions for the 2-year, 5-year, and 10-year Treasury futures contracts.
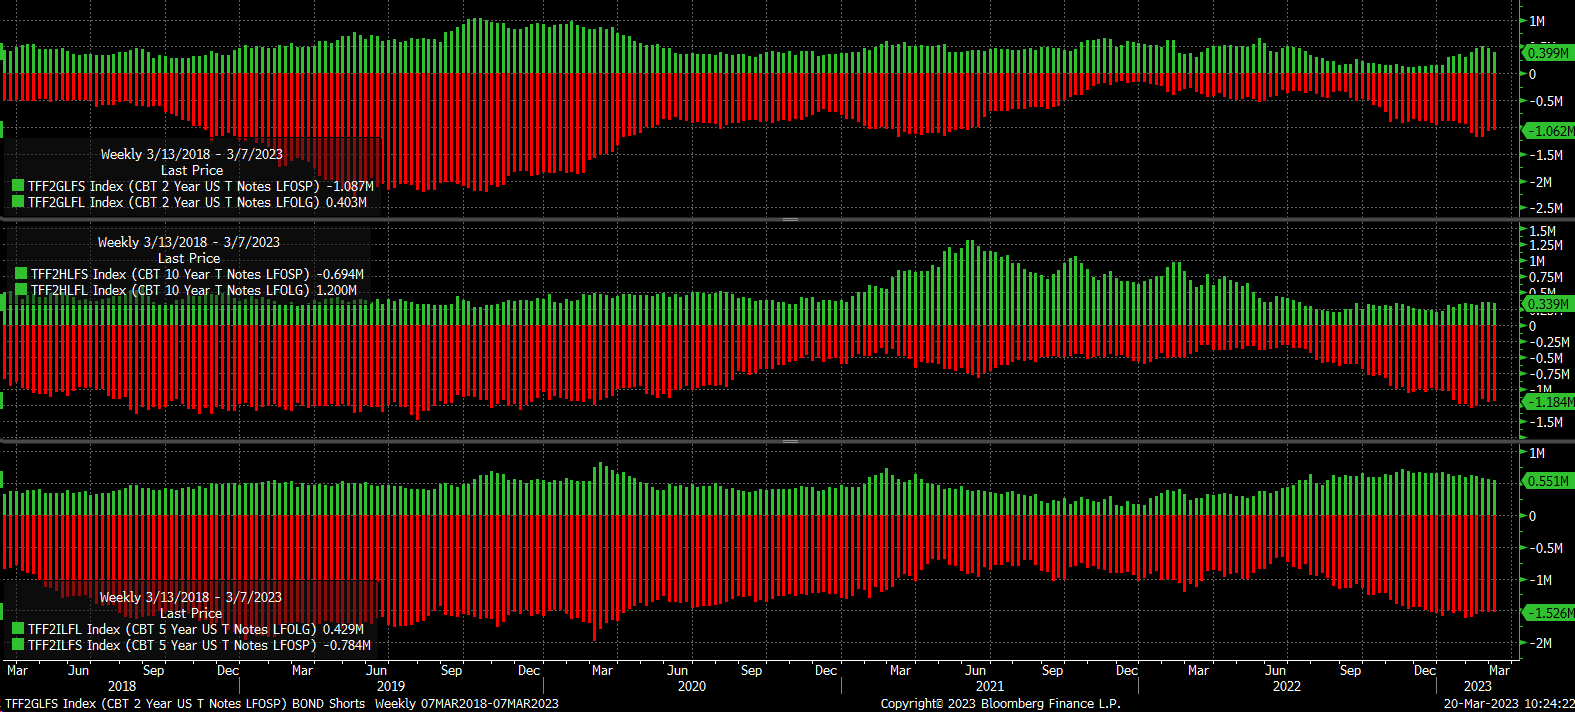
Bloomberg
However, with the recent market scare and flight to safety, the models have likely shifted from a short signal to a cover signal, as evidenced by the 20-day moving average flipping from rising to falling.
Bloomberg
Liquidity Has Evaporated
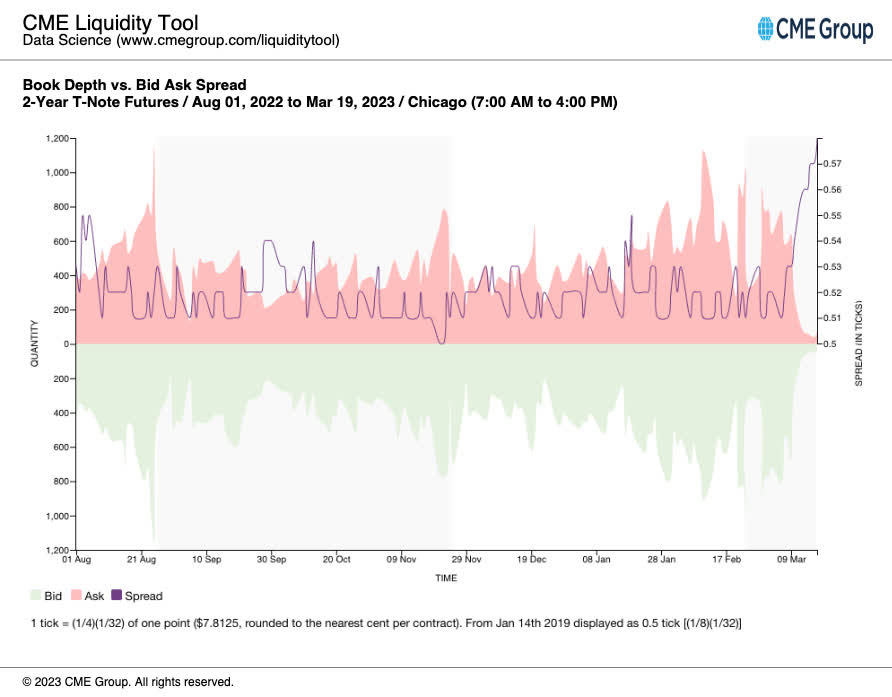
The primary problem is that liquidity in these futures contracts has dried up, and the bid-ask spread has widened, making it difficult to unwind bearish bets on the yield curve and exacerbating the move in rates.
When the depth of the book thins out, it means that there are not as many futures contracts available to buy or sell without significantly affecting the underlying contract. When the spread widens, it makes trading even more expensive. The wider the spreads become and the thinner the top of the book gets, the more challenging it is to execute transactions. The 2-year futures contract, for example, has experienced a significant decline in book depth and a significant widening of the bid-ask spread.
CME
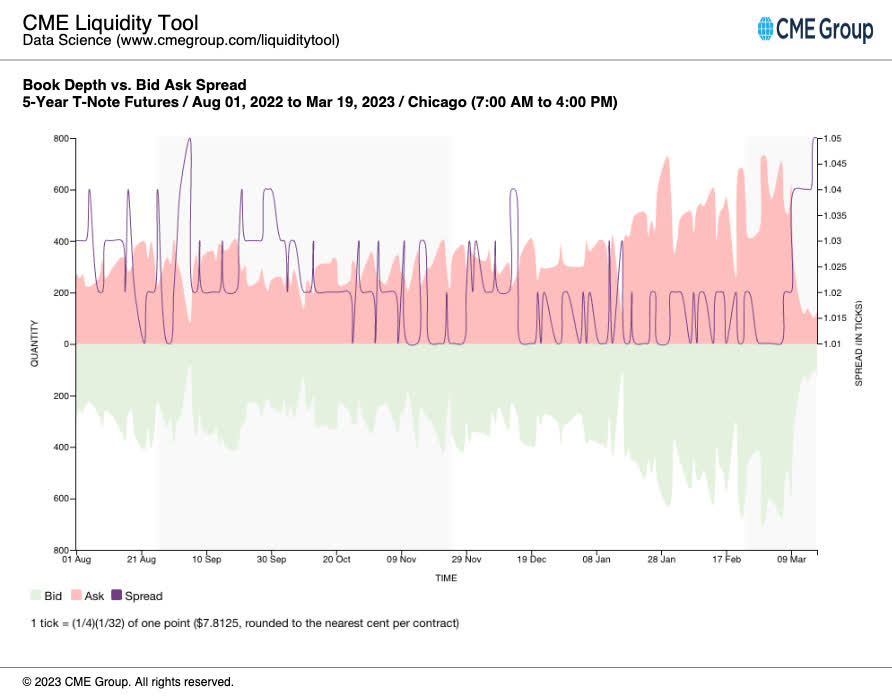
A similar situation is visible in the 5-year Treasury futures contract, with the bid-ask spread widening significantly and the book depth thinning out. This trend is also noticeable in the 10-year futures contracts.
CME
Consider that leveraged funds are struggling to unwind short positions. At the same time, liquidity in the market evaporates has probably caused rates to drop sharply and the violent moves that have been recently witnessed.
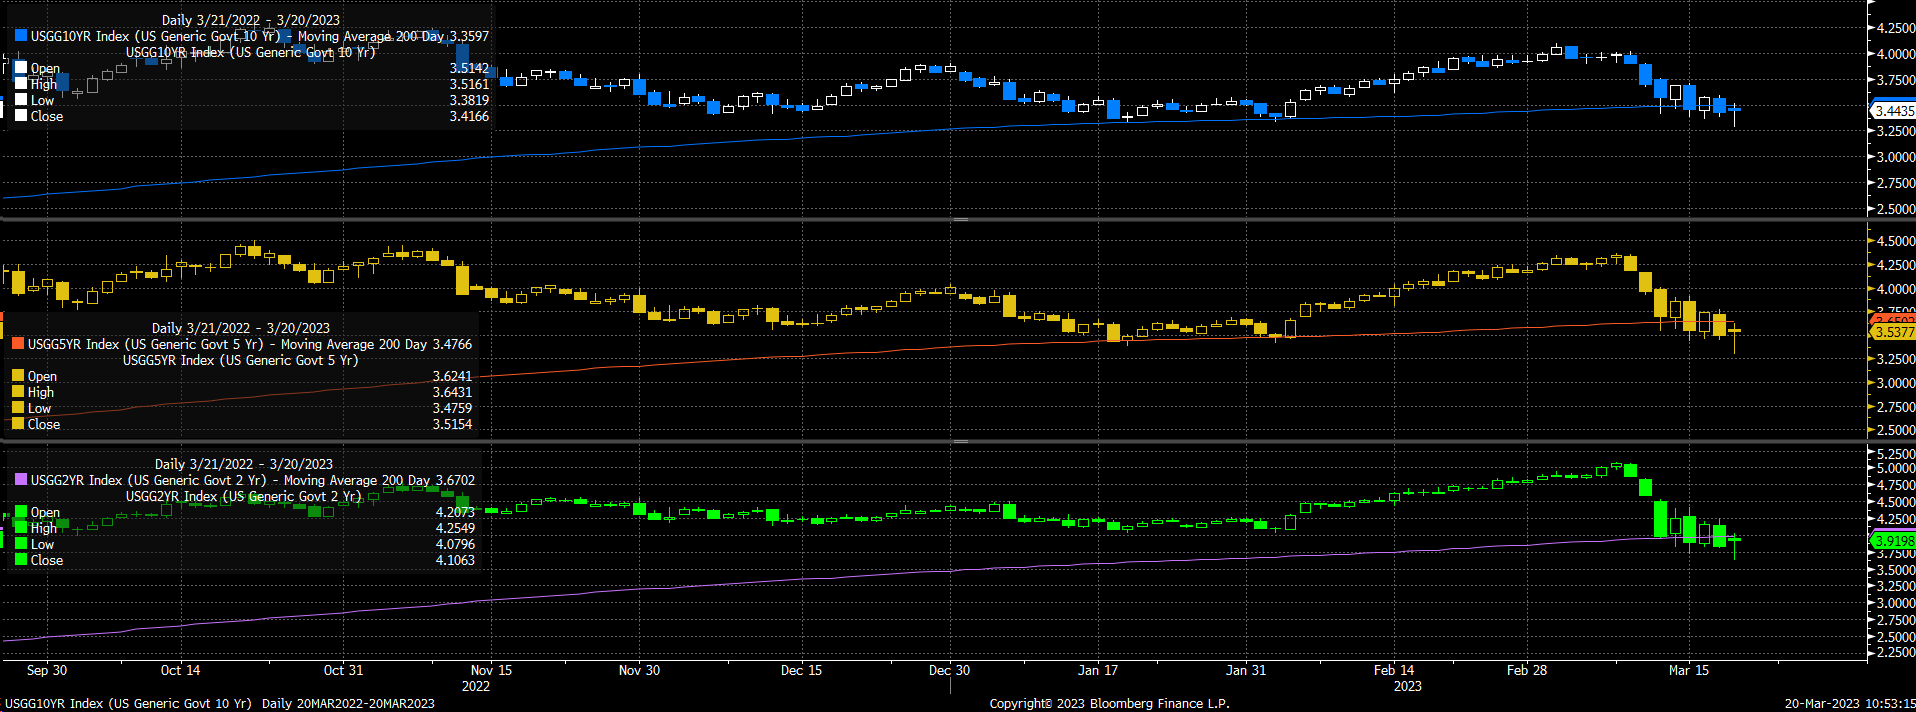
Interestingly, this is visible on the technical charts, as the 200-day moving average has provided crucial support for the 2-year, 5-year, and 10-year Treasury rates. This level of technical support is significant because it can indicate the long-term direction of the overall movement in rates. As long as this moving average holds, it seems to suggest that rates could see a significant rebound in the coming weeks.
Bloomberg
Rate Cuts?
At least on the surface, similar conditions seem to exist in the 3-month SOFR futures contracts, with substantial short positions built up over the past few months. If the race here is to cover short positions, it could be creating the impression that the markets are pricing in rate cuts when, in reality, it's just systematic short covering due to model signals.
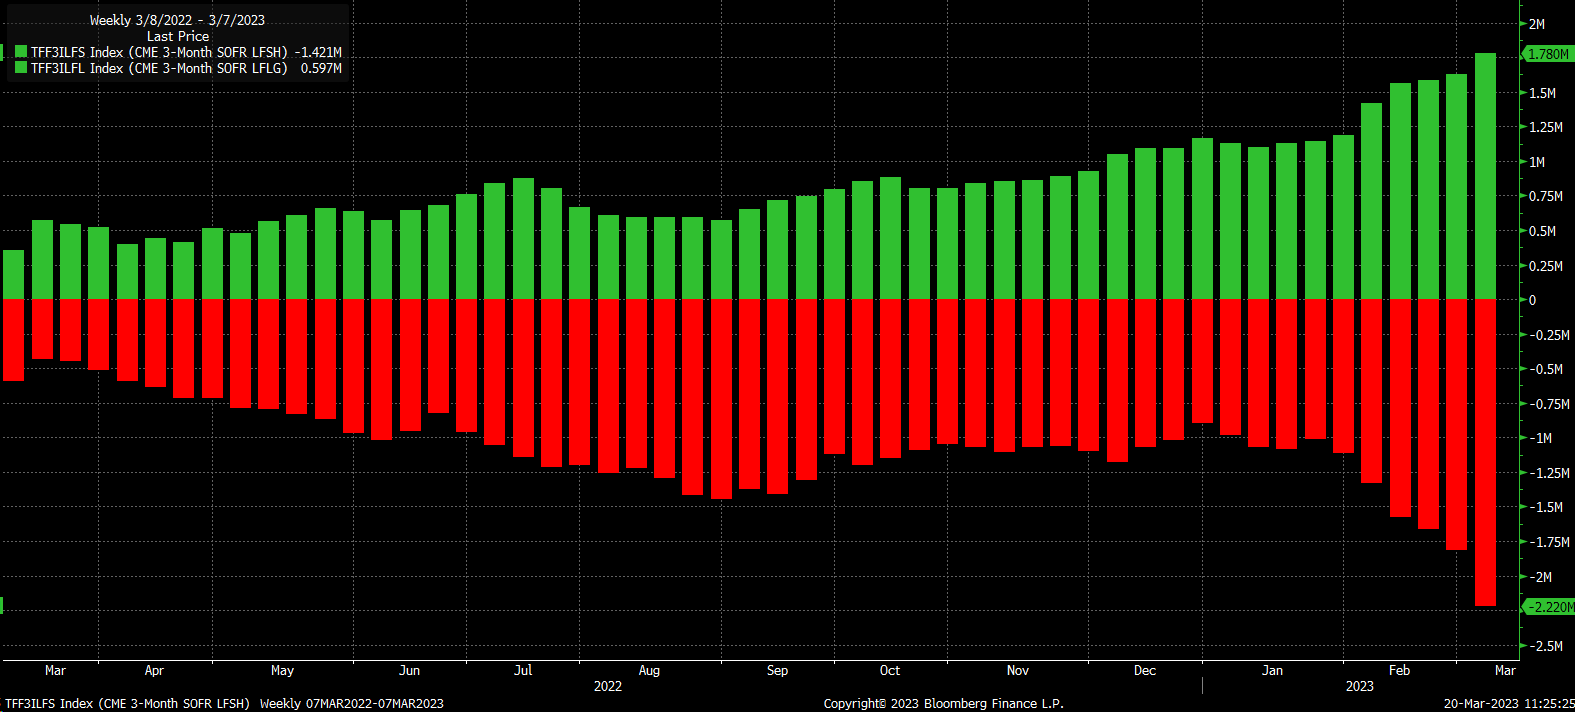
Bloomberg
As short covering eases and liquidity improves in the market, rates in the US will likely recover and rise significantly, especially if the Fed raises rates this week and signals for more rate hikes to come.
Join Reading The Markets Risk-Free With A Two-Week Trial!
(*The Free Trial offer is not available in the App store)
Find out why Reading The Markets was one of the fastest-growing SA marketplace services in 2022. Try it for free.
The market is more complex than ever, and Reading The Markets is here to help you cut through all the noise and to help you better understand what is driving trading and where the market is likely heading, both short and long-term.

This article was written by

I am Michael Kramer, the founder of Mott Capital Management and creator of Reading The Markets, an SA Marketplace service. I focus on long-only macro themes and trends, look for long-term thematic growth investments, and use options data to find unusual activity.
I use my over 25 years of experience as a buy-side trader, analyst, and portfolio manager, to explain the twists and turns of the stock market and where it may be heading next. Additionally, I use data from top vendors to formulate my analysis, including sell-side analyst estimates and research, newsfeeds, in-depth options data, and gamma levels.
Disclosure: I/we have no stock, option or similar derivative position in any of the companies mentioned, and no plans to initiate any such positions within the next 72 hours. I wrote this article myself, and it expresses my own opinions. I am not receiving compensation for it (other than from Seeking Alpha). I have no business relationship with any company whose stock is mentioned in this article.
Additional disclosure: Charts used with the permission of Bloomberg Finance LP. This report contains independent commentary to be used for informational and educational purposes only. Michael Kramer is a member and investment adviser representative with Mott Capital Management. Mr. Kramer is not affiliated with this company and does not serve on the board of any related company that issued this stock. All opinions and analyses presented by Michael Kramer in this analysis or market report are solely Michael Kramer's views. Readers should not treat any opinion, viewpoint, or prediction expressed by Michael Kramer as a specific solicitation or recommendation to buy or sell a particular security or follow a particular strategy. Michael Kramer's analyses are based upon information and independent research that he considers reliable, but neither Michael Kramer nor Mott Capital Management guarantees its completeness or accuracy, and it should not be relied upon as such. Michael Kramer is not under any obligation to update or correct any information presented in his analyses. Mr. Kramer's statements, guidance, and opinions are subject to change without notice. Past performance is not indicative of future results. Past performance of an index is not an indication or guarantee of future results. It is not possible to invest directly in an index. Exposure to an asset class represented by an index may be available through investable instruments based on that index. Neither Michael Kramer nor Mott Capital Management guarantees any specific outcome or profit. You should be aware of the real risk of loss in following any strategy or investment commentary presented in this analysis. Strategies or investments discussed may fluctuate in price or value. Investments or strategies mentioned in this analysis may not be suitable for you. This material does not consider your particular investment objectives, financial situation, or needs and is not intended as a recommendation appropriate for you. You must make an independent decision regarding investments or strategies in this analysis. Upon request, the advisor will provide a list of all recommendations made during the past twelve months. Before acting on information in this analysis, you should consider whether it is suitable for your circumstances and strongly consider seeking advice from your own financial or investment adviser to determine the suitability of any investment.