The State Of REITs: March 2023 Edition

Summary
- The REIT sector gave up most of January’s big gains in February with a -6.18% total return.
- Small cap (-7.42%) and mid cap (-6.05%) REITs fell the furthest in February, with micro caps (-5.15%) and large caps (-4.74%) seeing smaller declines.
- Only 13.04% of REIT securities had a positive total return in February.
- Self Storage (+5.16%) and Casino (-0.65%) REITs outperformed all other REIT property types in February. Infrastructure (-14.18%) and Land (-13.67%) REITs had the largest negative total returns.
- The average REIT NAV discount widened from -14.31% to -19.63% during February. The median NAV discount also widened from -13.35% to -17.59%.
- This idea was discussed in more depth with members of my private investing community, Portfolio Income Solutions. Learn More »
Maxxa_Satori
REIT Performance
The REIT sector started strong in 2023 with an +11.77% total return in January, but quickly gave up the majority of those gains in February with a disappointing -6.18% return in February. REITs underperformed the Dow Jones Industrial Average (-3.9%), S&P 500 (-2.4%) and NASDAQ (-1.0%). The market cap weighted Vanguard Real Estate ETF (VNQ) had a better total return than the average REIT in February (-5.86% vs. -6.18%), but is underperforming YTD (+3.93% vs. +4.88%). The spread between the 2023 FFO multiples of large cap REITs (17.5x) and small cap REITs (12.2x) narrowed in February as multiples contracted by 0.7 turns for large caps and 0.2 turns for small caps. Investors currently need to pay an average of 43.4% more for each dollar of FFO from large cap REITs relative to small cap REITs. In this monthly publication, I will provide REIT data on numerous metrics to help readers identify which property types and individual securities currently offer the best opportunities to achieve their investment goals.
Source: Graph by Simon Bowler of 2nd Market Capital, Data compiled from S&P Global Market Intelligence LLC. See important notes and disclosures at the end of this article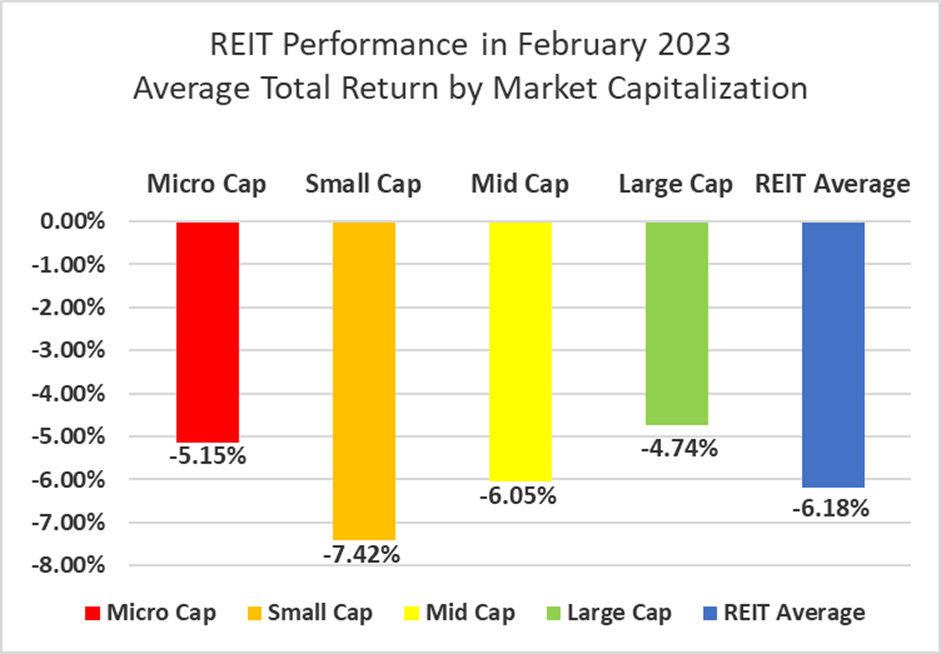
There was not a significant correlation between total return and market cap in February. Large cap (-4.74%), micro cap (-5.15%), mid cap (-6.05%) and small cap (-7.42%) REITs averaged mid single-digit negative returns. Large cap REITs (+4.88%) are outperforming small caps (+4.20%) by 68 basis points on YTD 2023 total return.
Source: Graph by Simon Bowler of 2nd Market Capital, Data compiled from S&P Global Market Intelligence LLC. See important notes and disclosures at the end of this article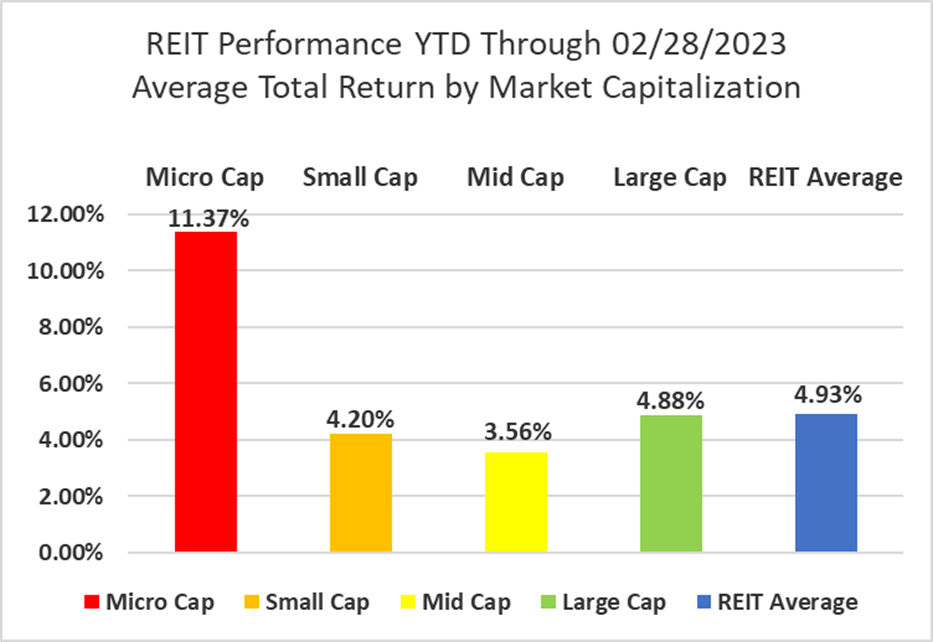
1 out of 18 Property Types Yielded Positive Total Returns in February
Only 5.56% percent of REIT property types averaged a positive total return in February, with a 19.34% total return spread between the best and worst performing property types. Self Storage (+5.16%) was the only property type in the black in February, led by Life Storage (LSI) and Global Self Storage (SELF), which achieved double digit total returns of +11.55% and +10.57% respectively.
Infrastructure (-14.18%), Land (-13.67%) and Office (-11.59%) REITs fell the furthest during a rough February for REITs. All 20 Office REITs finished February in negative territory and accounted for 4 of the worst 8 performing REITs in February. Franklin Street Properties (FSP) (-21.43%), Hudson Pacific Properties (HPP) (-18.96%), Vornado Realty Trust (VNO) (-18.90%) and Paramount Group (PGRE) (-18.29%) suffered particularly large share price declines.
Source: Table by Simon Bowler of 2nd Market Capital, Data compiled from S&P Global Market Intelligence LLC. See important notes and disclosures at the end of this article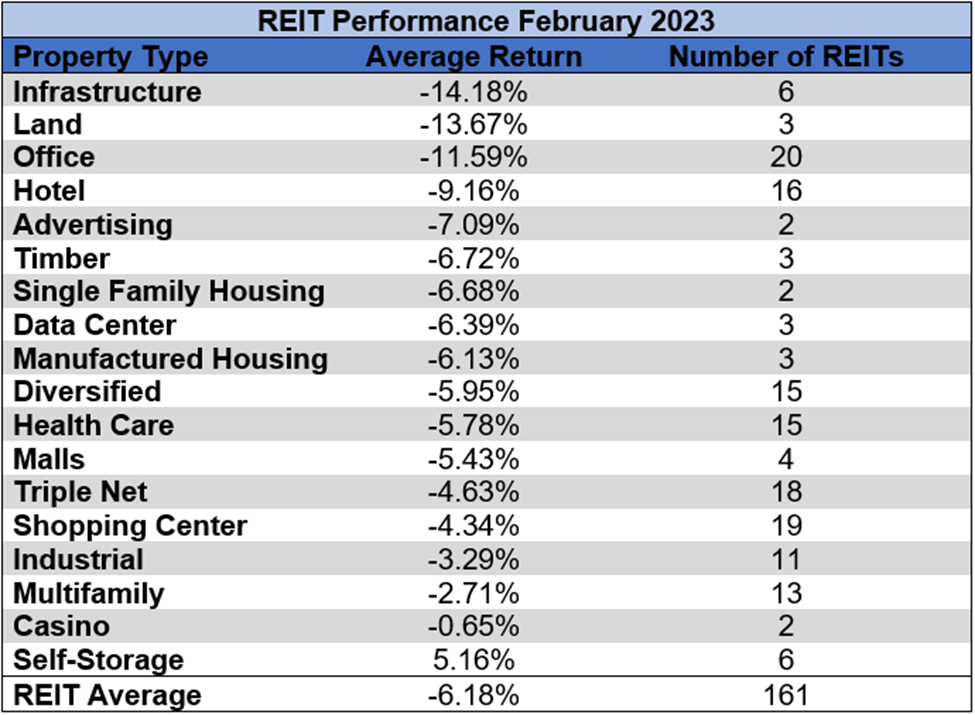
Infrastructure (-5.26%) and Land REITs (-4.47%) have significantly underperformed all other property types over the first two months of the year and are the only property types in the red YTD. All other REIT property types have averaged gains YTD led by Self Storage (+15.33%), Diversified (+8.47%), Malls (+8.32%), Industrial (+8.06%) and Advertising (+8.00%).
Source: Table by Simon Bowler of 2nd Market Capital, Data compiled from S&P Global Market Intelligence LLC. See important notes and disclosures at the end of this article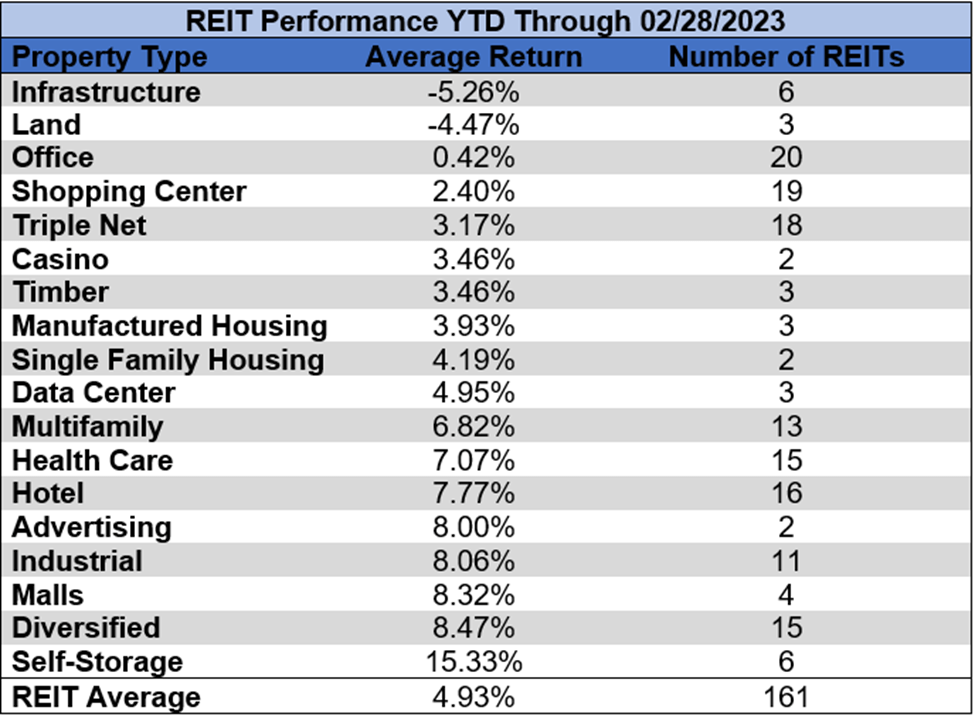
The REIT sector as a whole saw the average P/FFO (2023Y) decrease 0.3 turns in February (from 14.1x down to 13.8x). The average FFO multiple expanded for 25% of property types and contracted for 75%. There are no recent 2023 FFO/share estimates for any of the Timber REITs. Land (29.7x) Data Centers (21.9x), Industrial (21.1x) and Manufactured Housing (20.7x) continue to trade at the highest multiples among REIT property types. Mall (5.7x), Hotel (8.7x) and Office (8.8x) REITs are the only REITs currently trading at single digit multiples.
Source: Table by Simon Bowler of 2nd Market Capital, Data compiled from S&P Global Market Intelligence LLC. See important notes and disclosures at the end of this article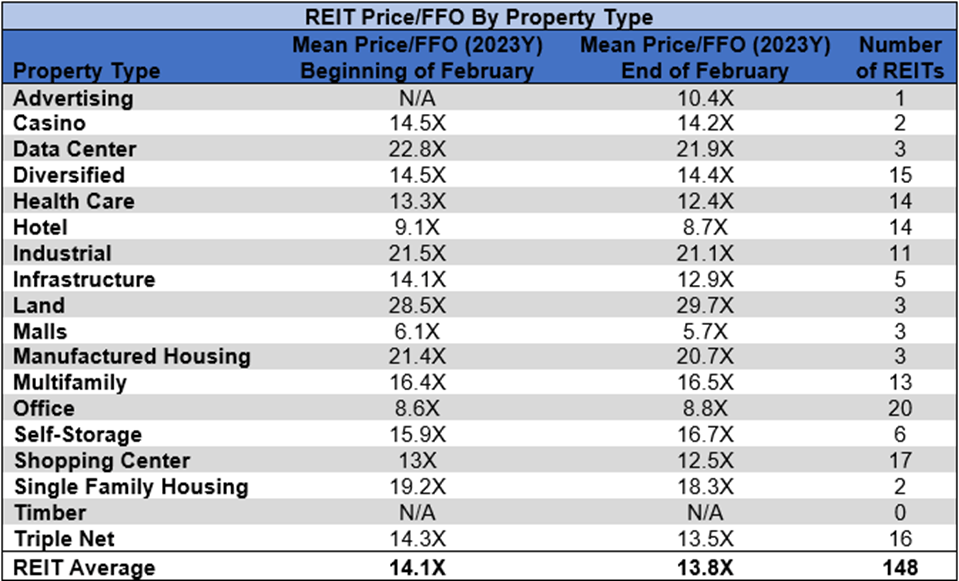
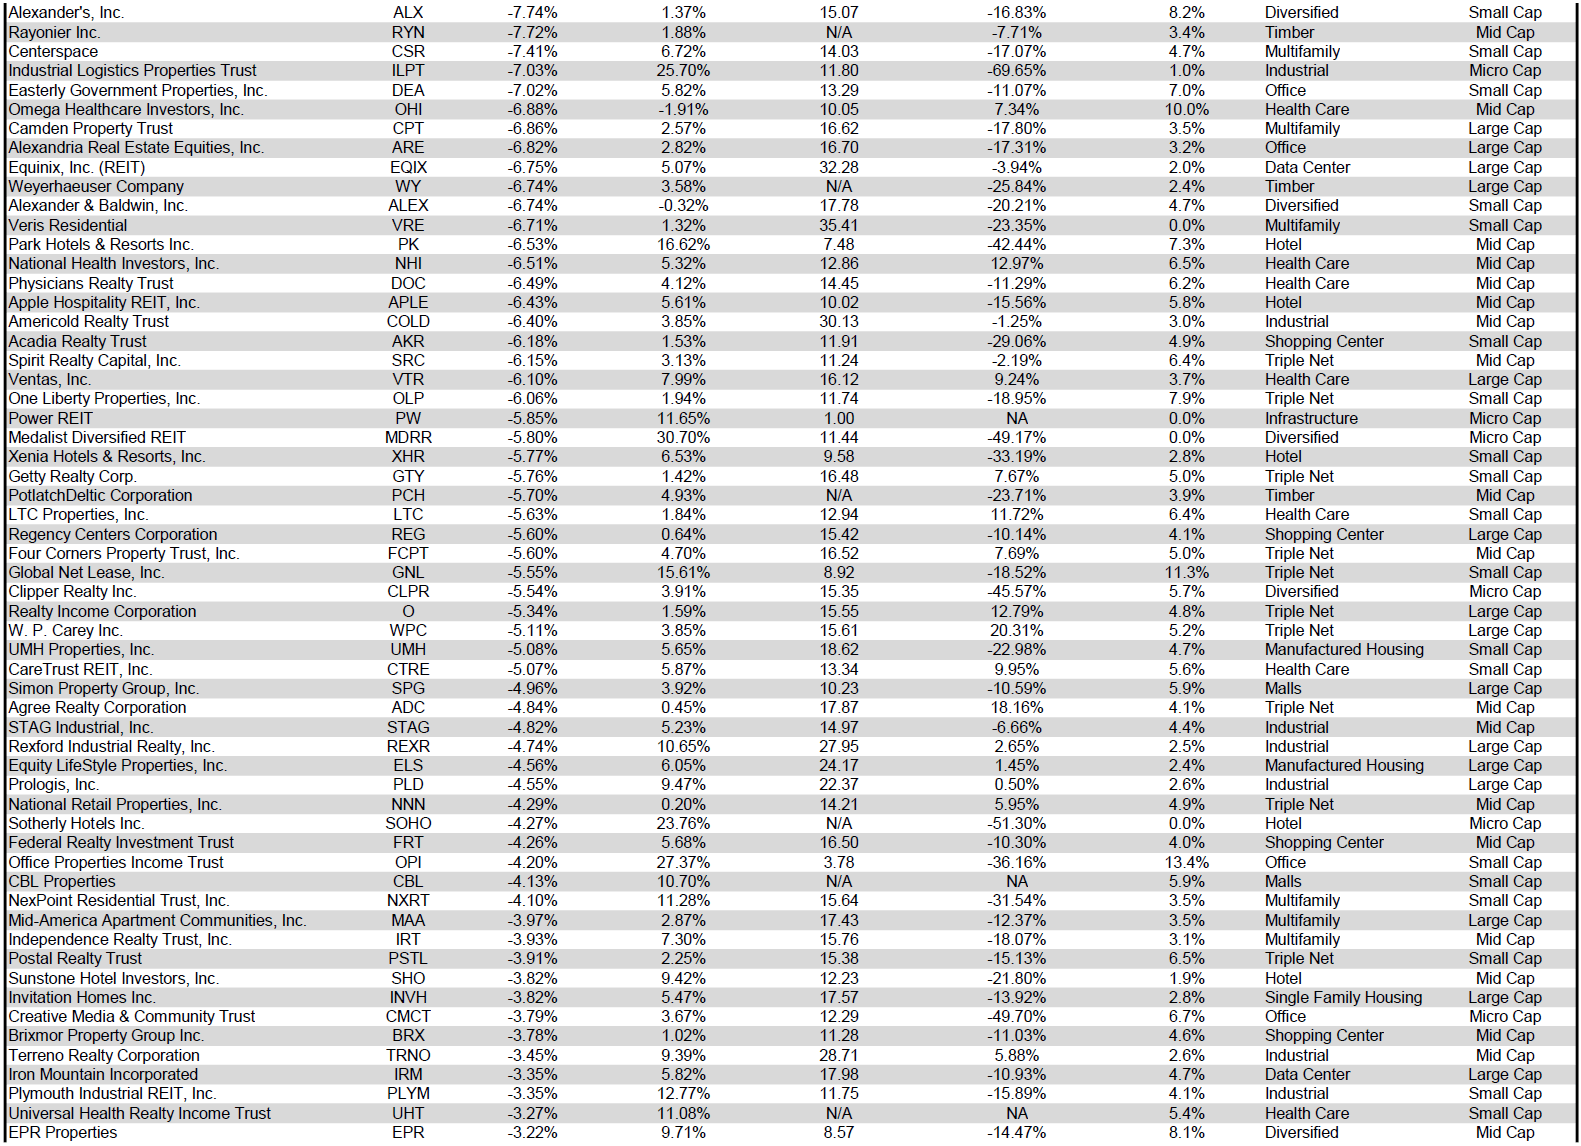
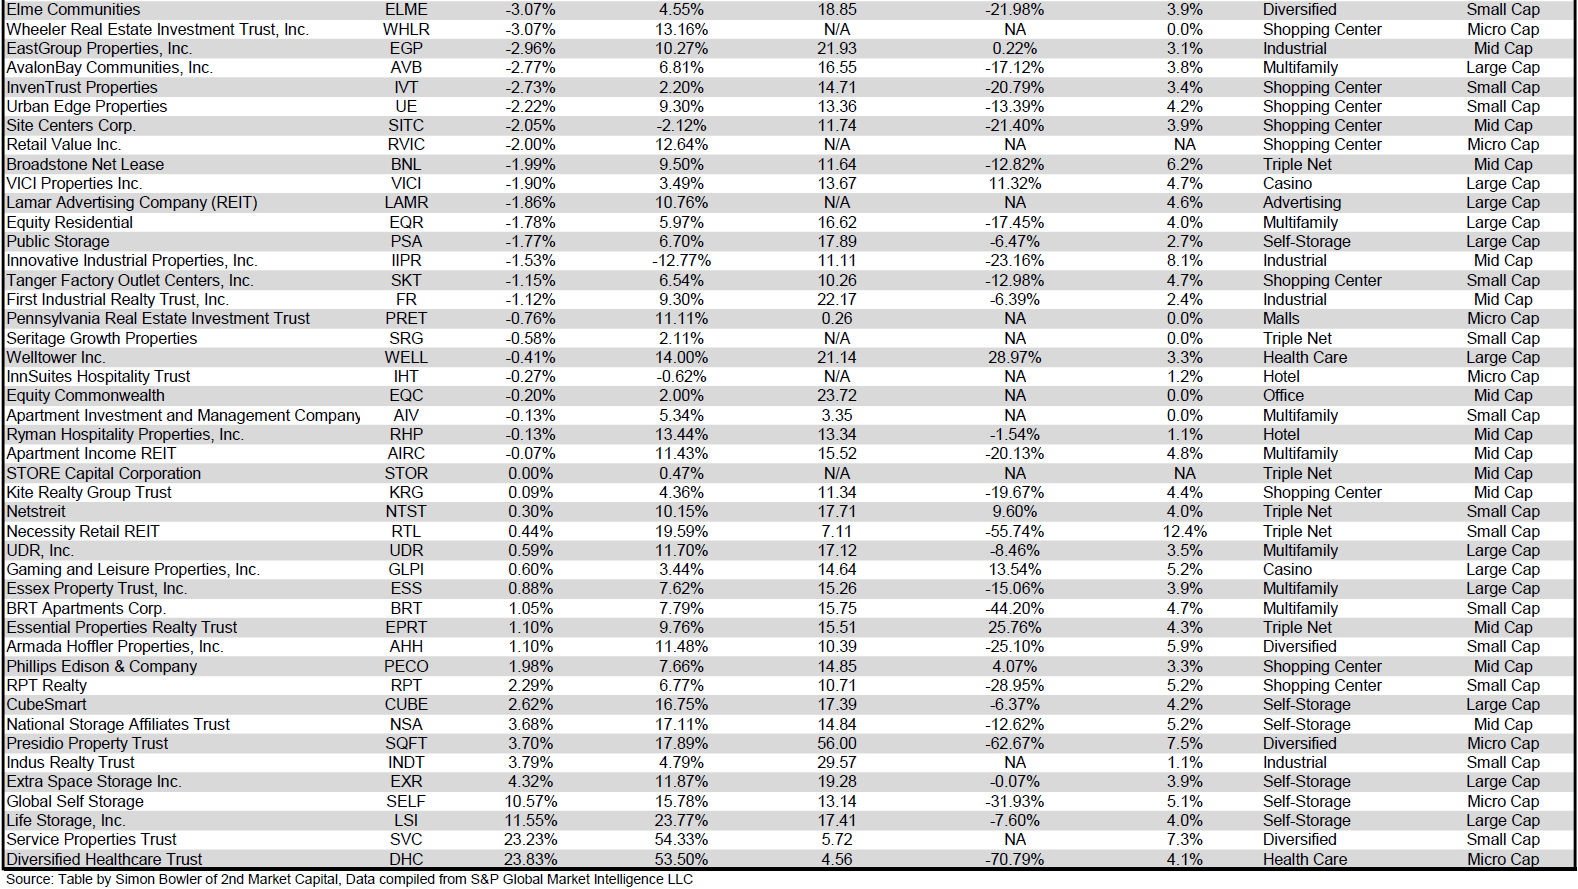
Performance of Individual Securities
STORE Capital (STOR) was acquired by GIC and Oak Street on February 3rd, at which time STOR was delisted. Shareholders of STOR received $32.25/share.
Diversified Healthcare Trust (DHC) (+23.83%) was a major beneficiary of ABP Acquisition’s purchase of AlerisLife (ALR). DHC owns 31.9% of ALR and stands to benefit from the substantial price premium at which ALR is being acquired. The transaction is expected to close by the end of the first half of 2023.
Ashford Hospitality Trust (AHT) (-28.16%) gave up most of January’s big gain in February. This marks a return to the longstanding downward share price trend for AHT which has left shareholders with total returns of less than -50% in each of the past 3 years.
Only 13.04% of REITs had a positive total return in February with 76.4% in the black year to date. During the first two months of last year the average REIT had a -5.83% return, whereas this year the average REIT has seen a +4.93% total return.
Source: Table by Simon Bowler of 2nd Market Capital, Data compiled from S&P Global Market Intelligence LLC. See important notes and disclosures at the end of this article Source: Table by Simon Bowler of 2nd Market Capital, Data compiled from S&P Global Market Intelligence LLC. See important notes and disclosures at the end of this article Source: Table by Simon Bowler of 2nd Market Capital, Data compiled from S&P Global Market Intelligence LLC. See important notes and disclosures at the end of this article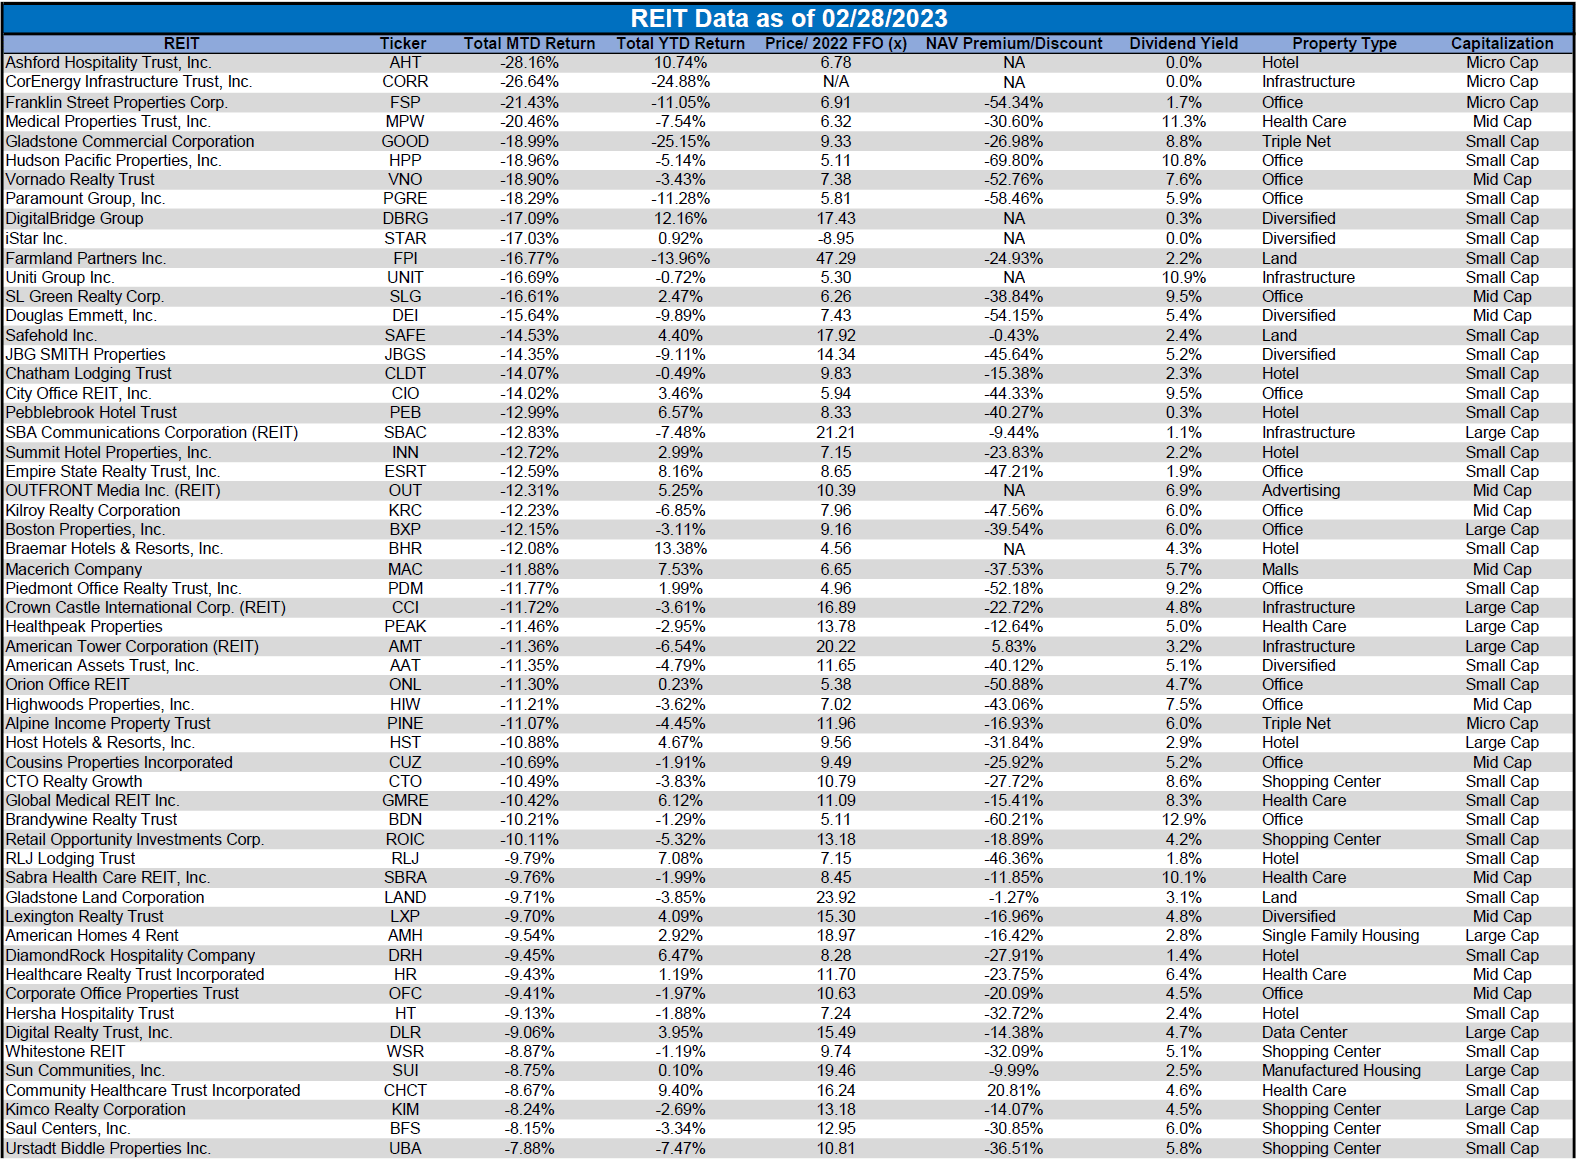
For the convenience of reading this table in a larger font, the table above is available as a PDF as well.
Dividend Yield
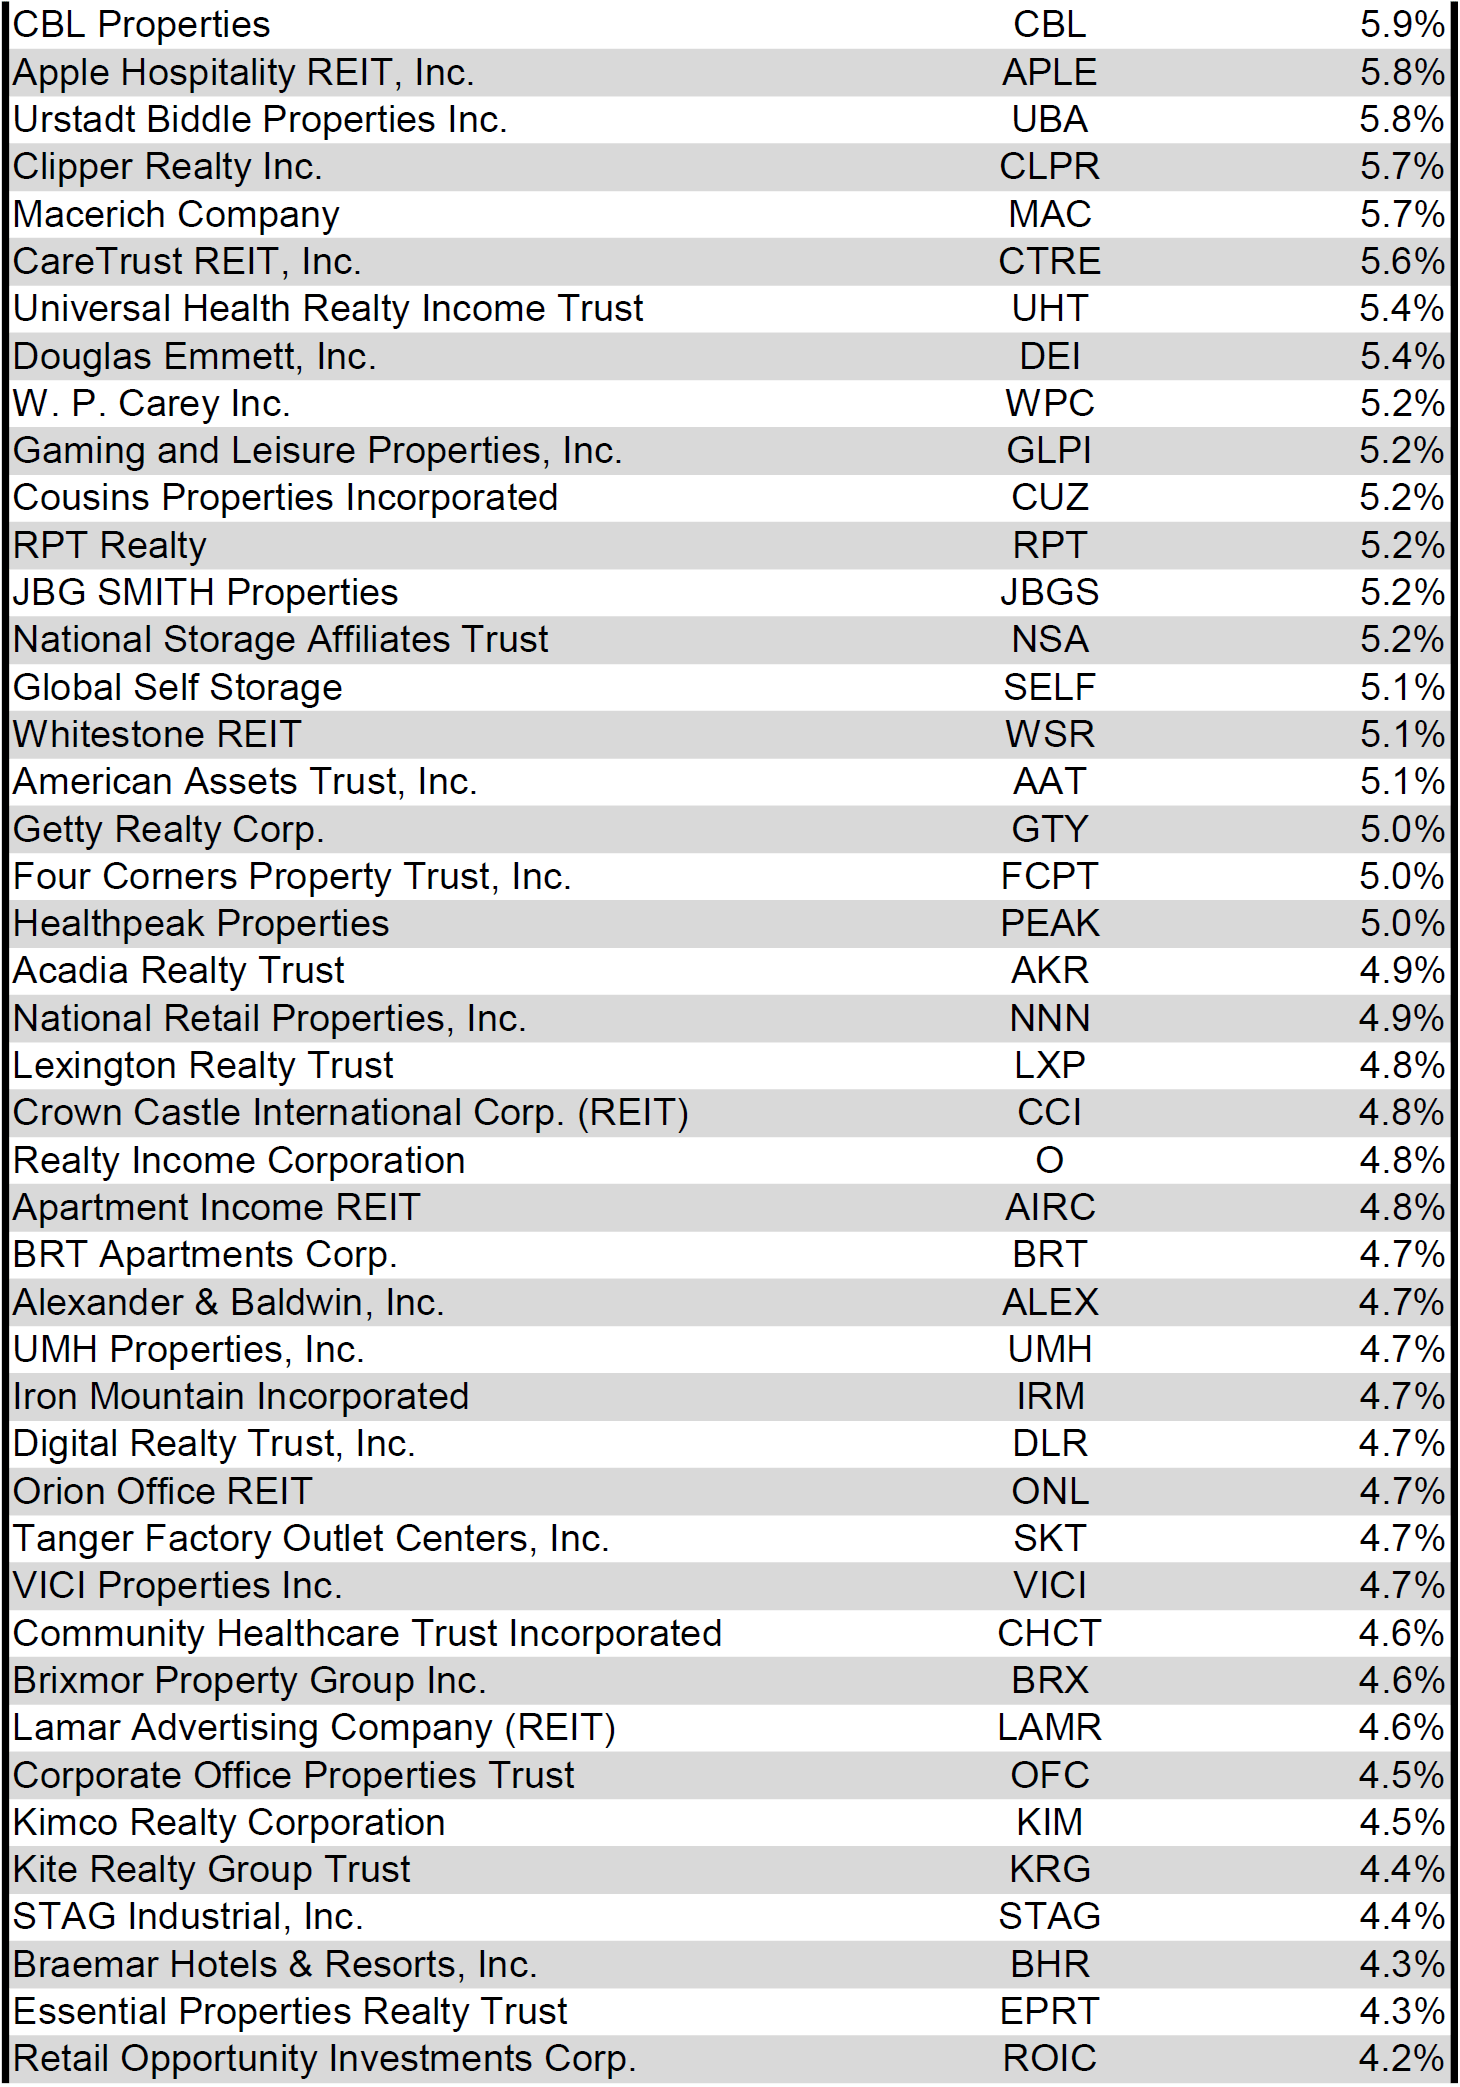
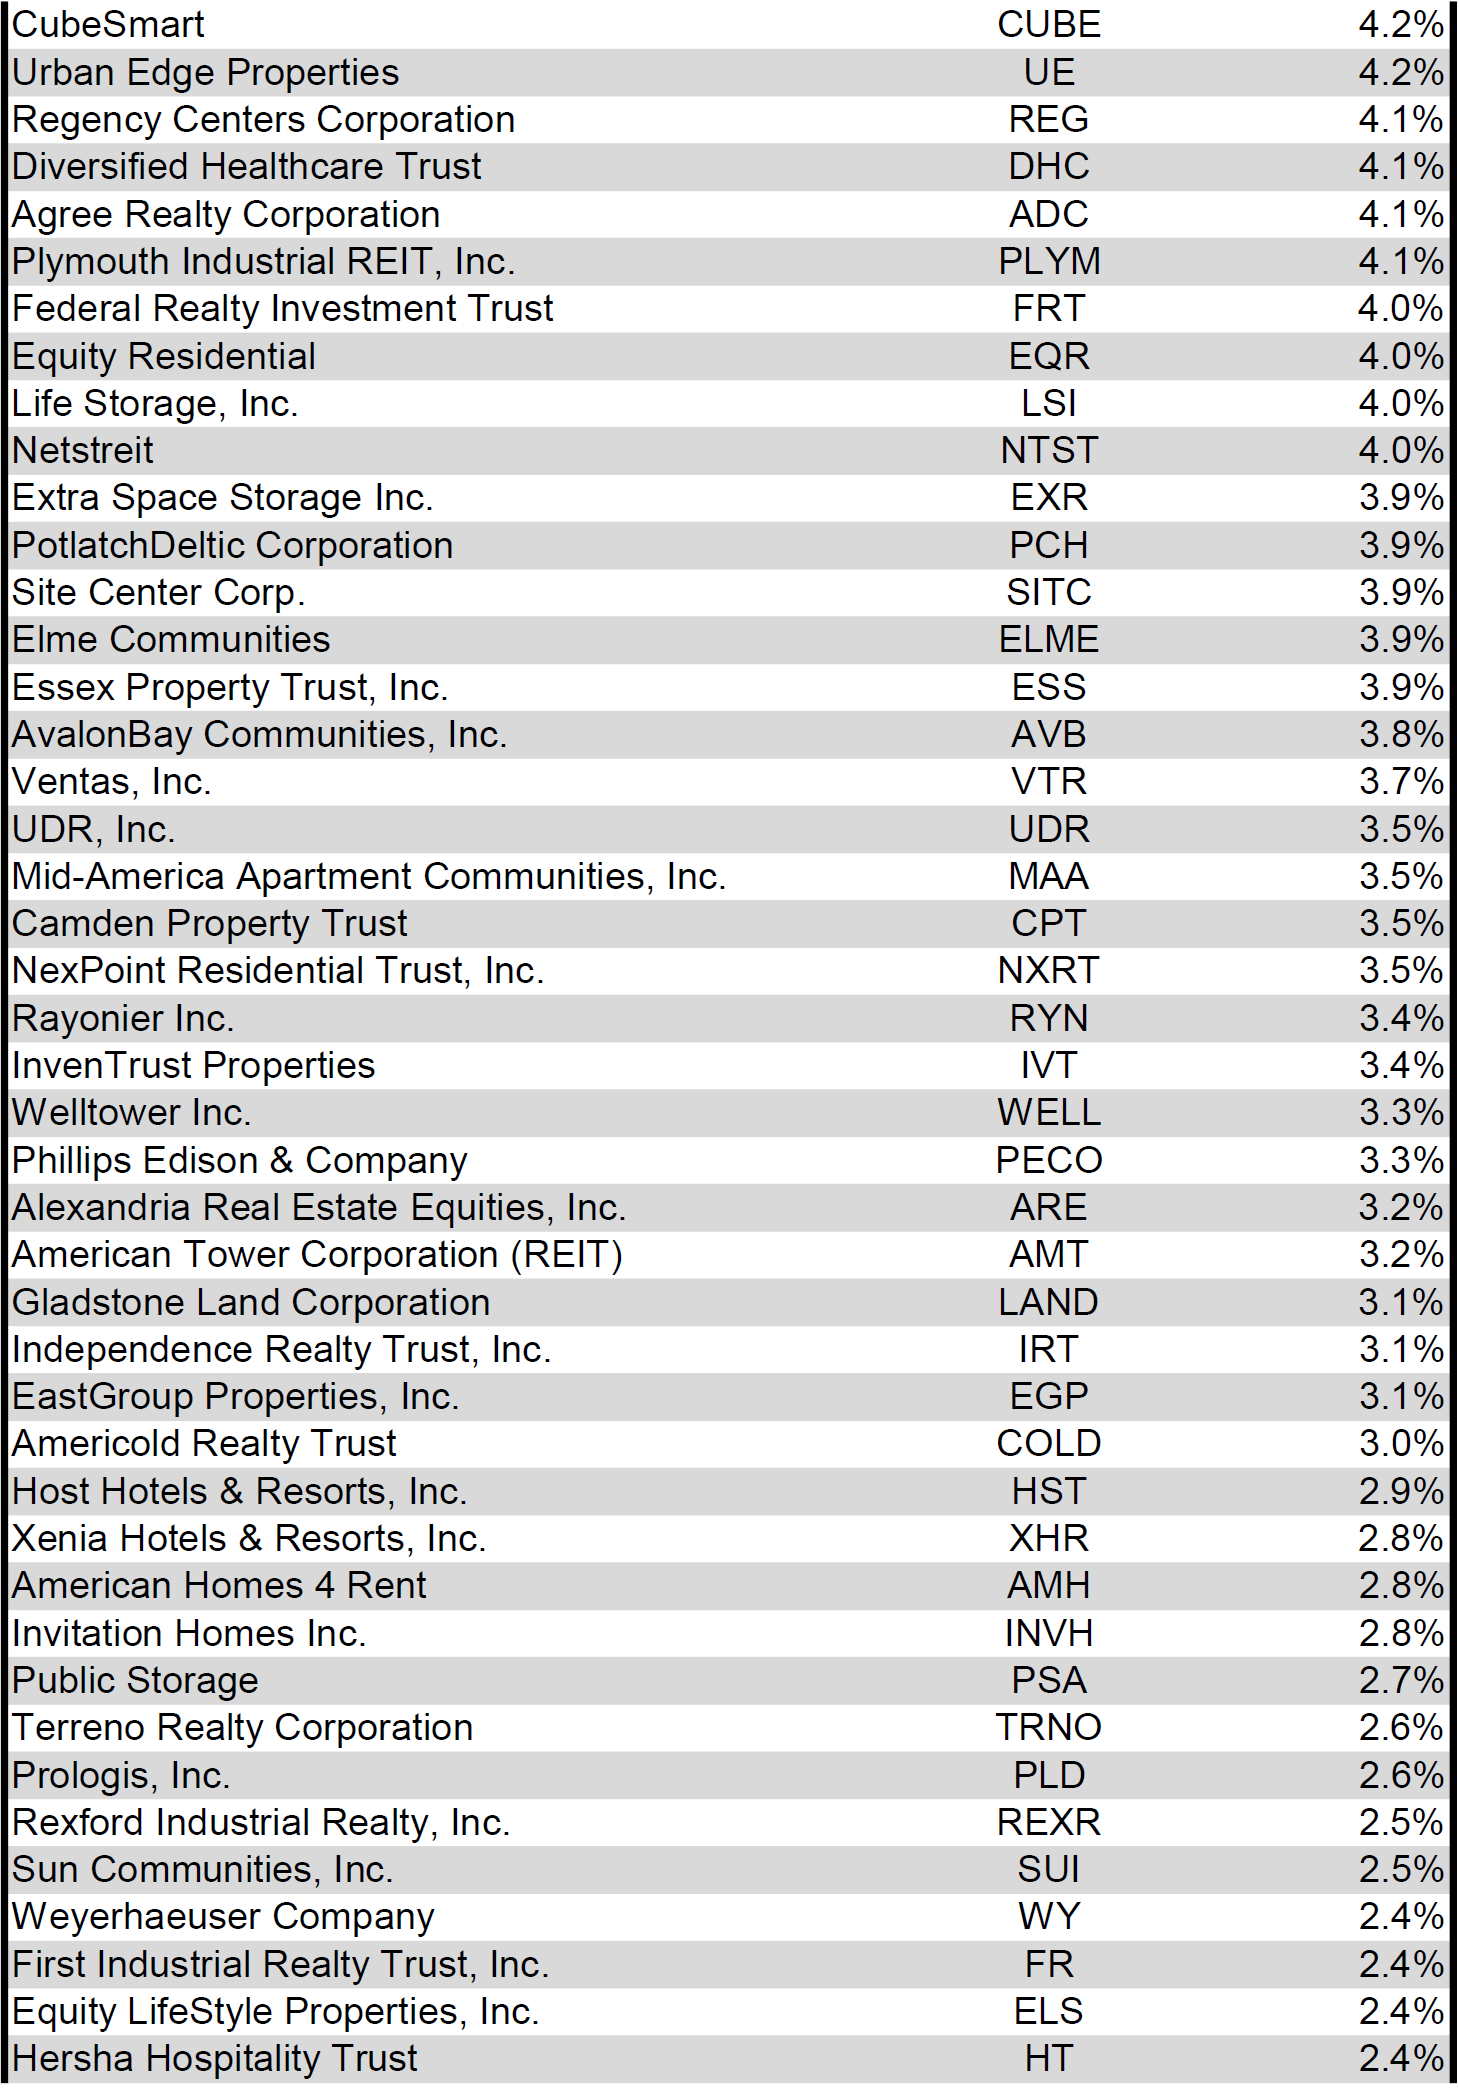
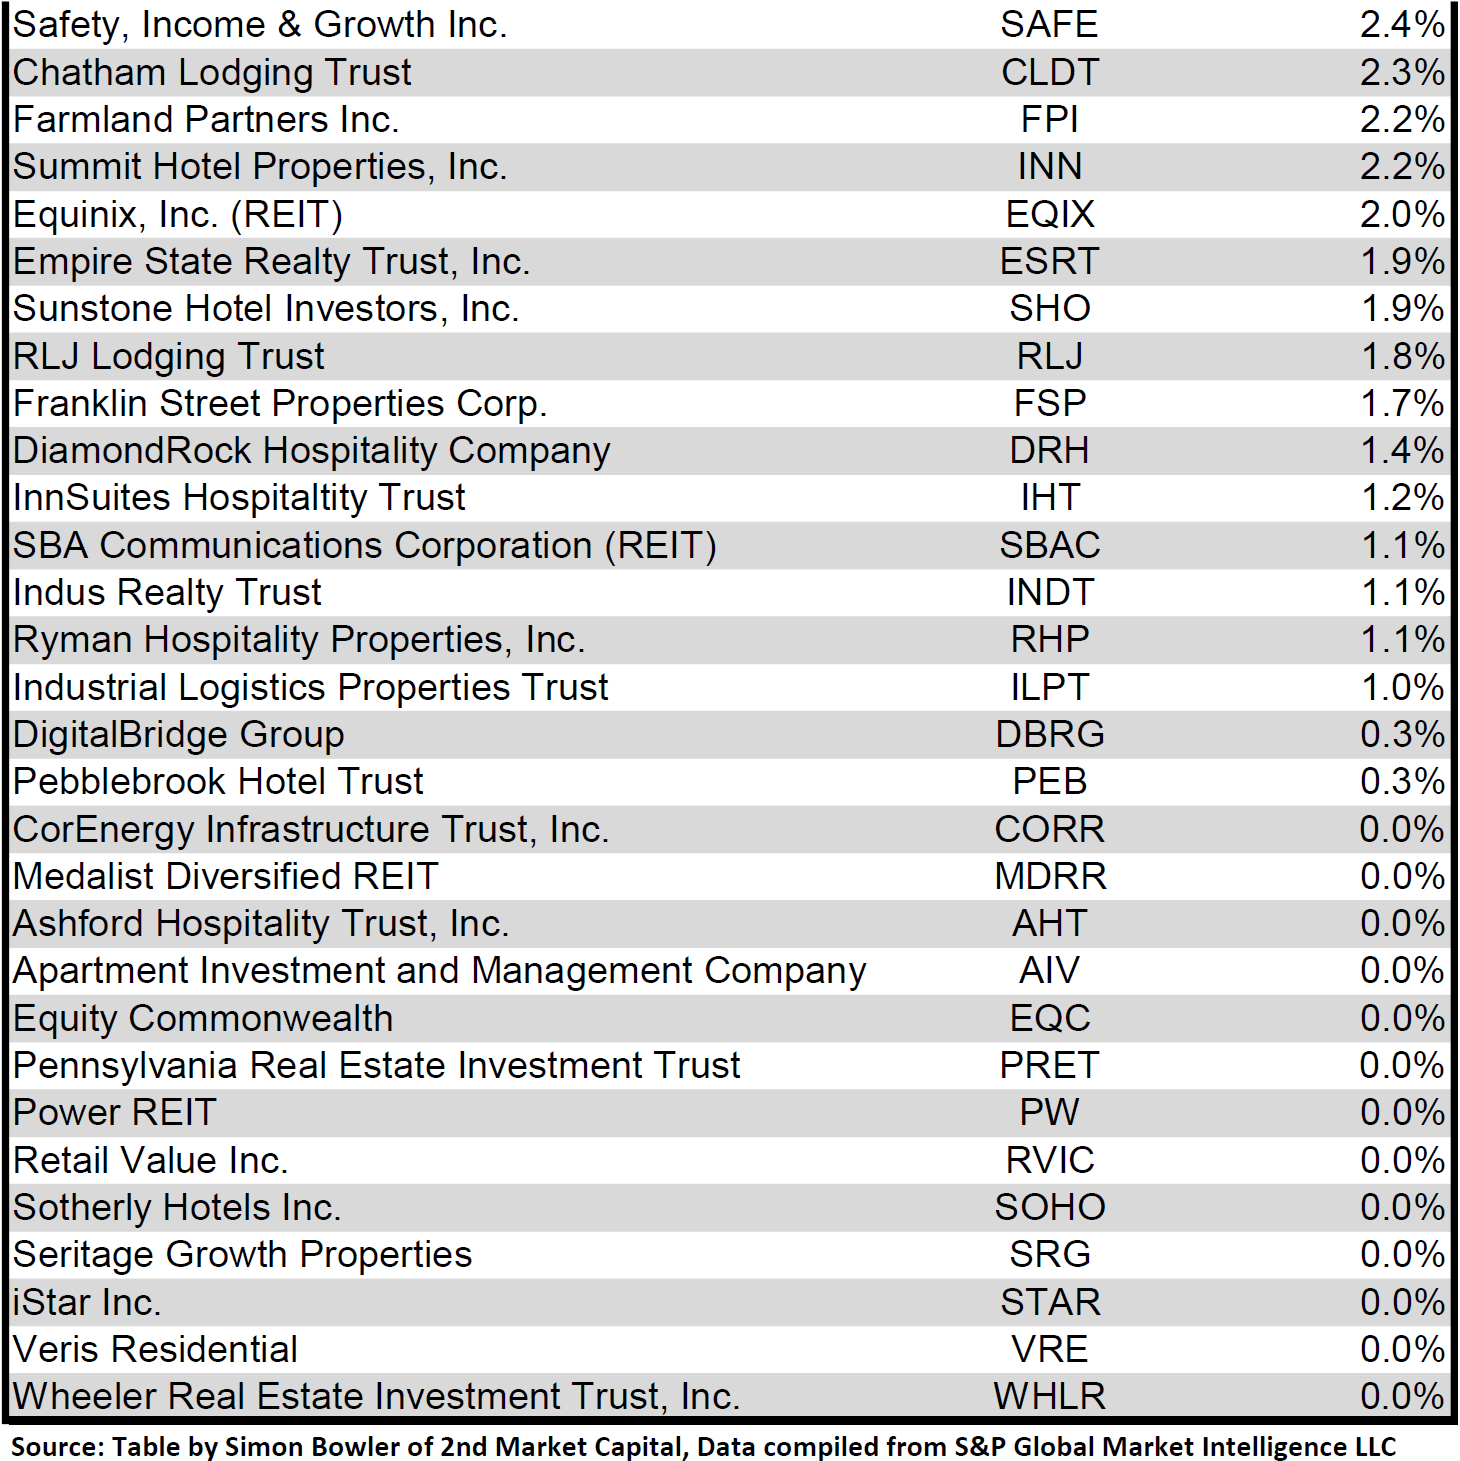
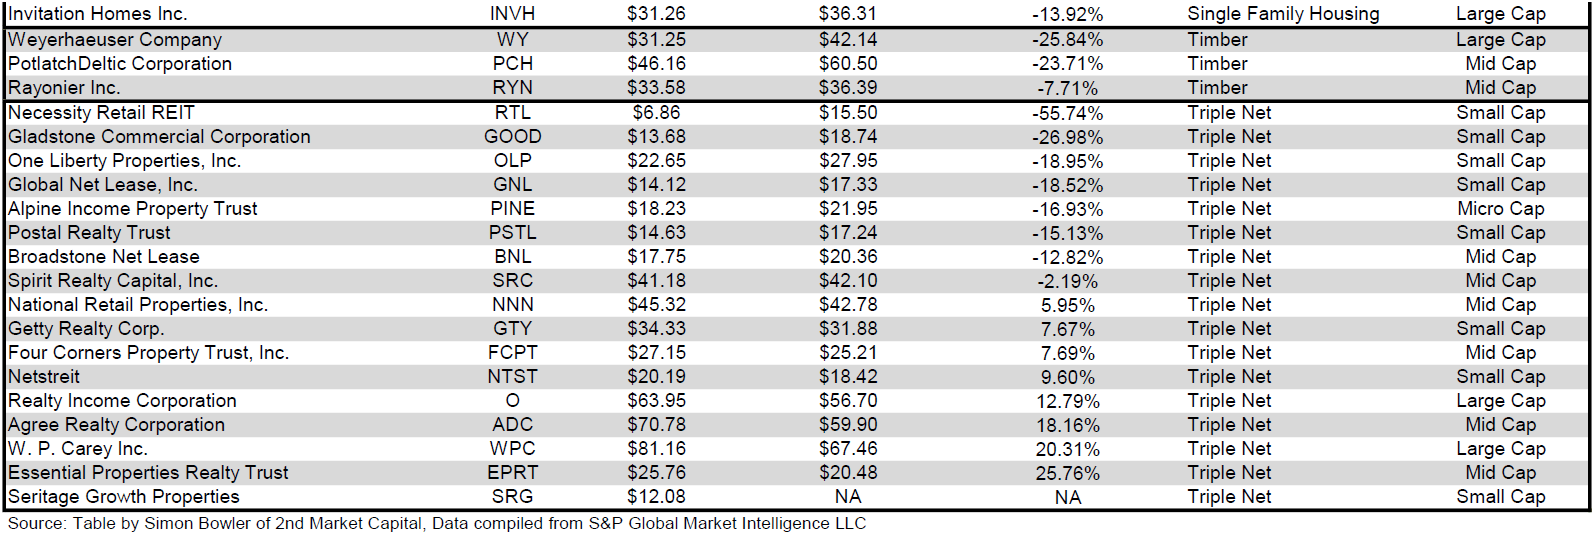
Dividend yield is an important component of a REIT's total return. The particularly high dividend yields of the REIT sector are, for many investors, the primary reason for investment in this sector. As many REITs are currently trading at share prices well below their NAV, yields are currently quite high for many REITs within the sector. Although a particularly high yield for a REIT may sometimes reflect a disproportionately high risk, there exist opportunities in some cases to capitalize on dividend yields that are sufficiently attractive to justify the underlying risks of the investment. I have included below a table ranking equity REITs from highest dividend yield (as of 02/28/2023) to lowest dividend yield.
Source: Table by Simon Bowler of 2nd Market Capital, Data compiled from S&P Global Market Intelligence LLC. See important notes and disclosures at the end of this article Source: Table by Simon Bowler of 2nd Market Capital, Data compiled from S&P Global Market Intelligence LLC. See important notes and disclosures at the end of this article Source: Table by Simon Bowler of 2nd Market Capital, Data compiled from S&P Global Market Intelligence LLC. See important notes and disclosures at the end of this article Source: Table by Simon Bowler of 2nd Market Capital, Data compiled from S&P Global Market Intelligence LLC. See important notes and disclosures at the end of this article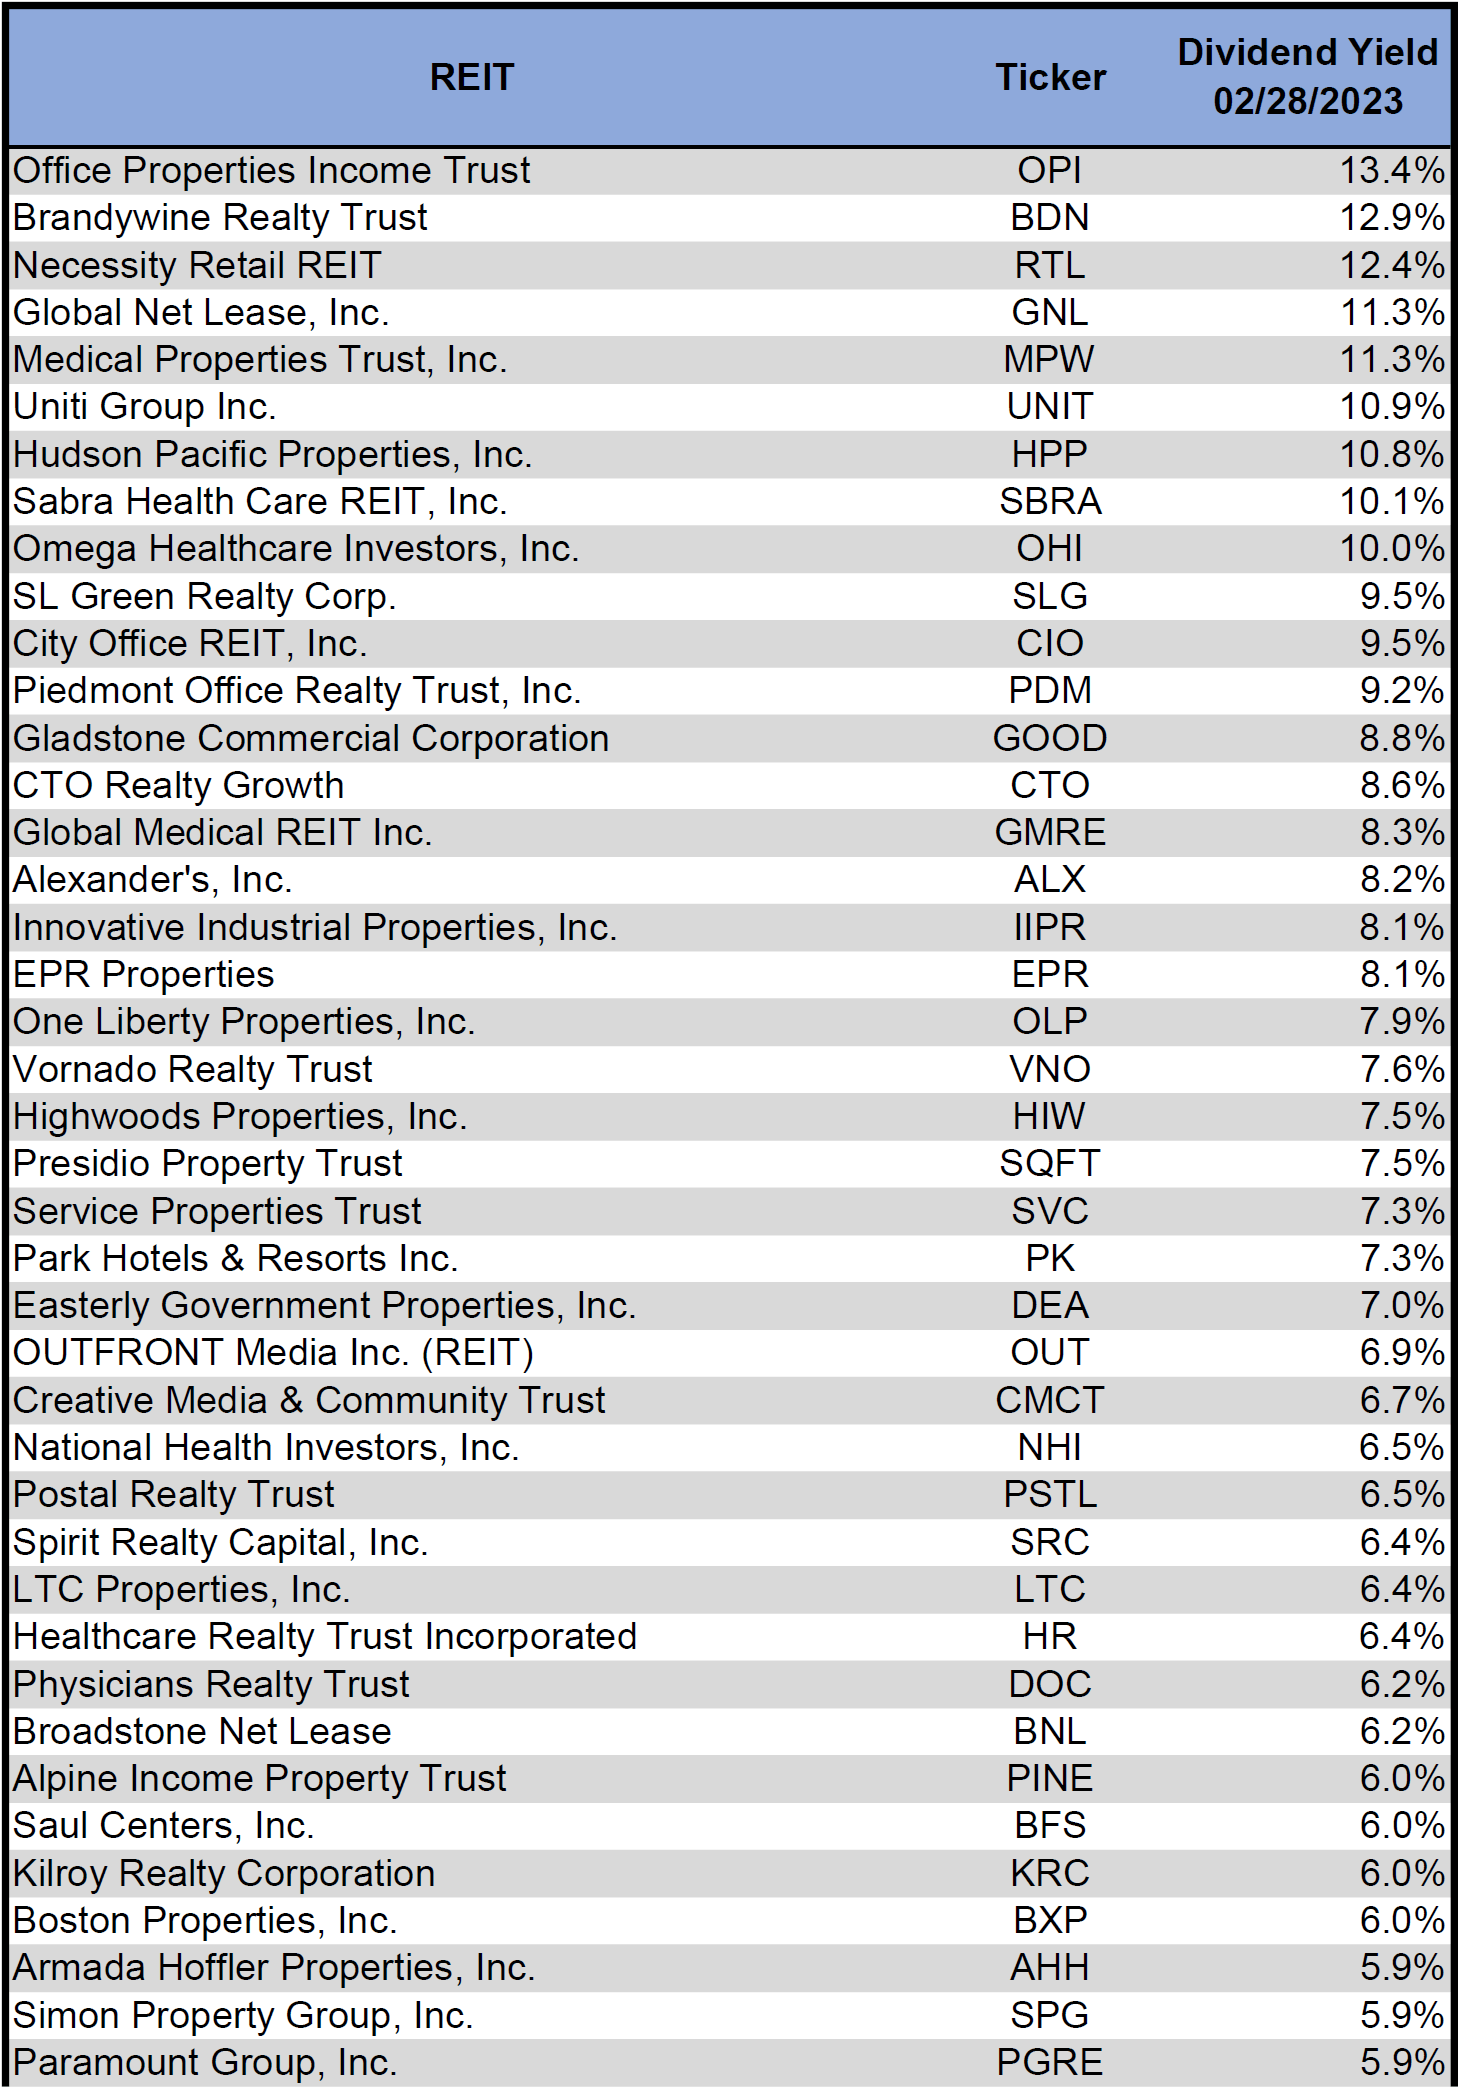
For the convenience of reading this table in a larger font, the table above is available as a PDF as well.
Although a REIT’s decision regarding whether to pay a quarterly dividend or a monthly dividend does not reflect on the quality of the company’s fundamentals or operations, a monthly dividend allows for a smoother cash flow to the investor. Below is a list of equity REITs that pay monthly dividends ranked from highest yield to lowest yield.
Source: Table by Simon Bowler of 2nd Market Capital, Data compiled from S&P Global Market Intelligence LLC. See important notes and disclosures at the end of this article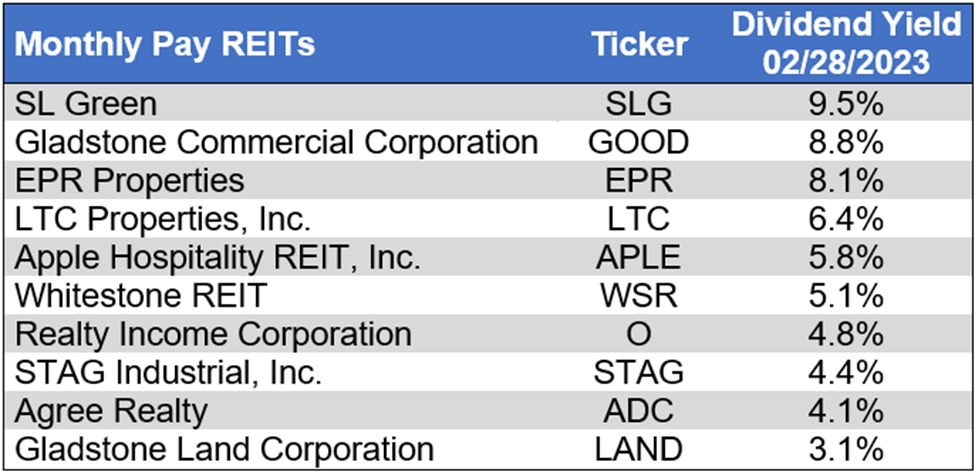
Valuation
REIT Premium/Discount to NAV by Property Type
Below is a downloadable data table, which ranks REITs within each property type from the largest discount to the largest premium to NAV. The consensus NAV used for this table is the average of analyst NAV estimates for each REIT. Both the NAV and the share price will change over time, so I will continue to include this table in upcoming issues of The State of REITs with updated consensus NAV estimates for each REIT for which such an estimate is available.
Source: Table by Simon Bowler of 2nd Market Capital, Data compiled from S&P Global Market Intelligence LLC. See important notes and disclosures at the end of this article Source: Table by Simon Bowler of 2nd Market Capital, Data compiled from S&P Global Market Intelligence LLC. See important notes and disclosures at the end of this article Source: Table by Simon Bowler of 2nd Market Capital, Data compiled from S&P Global Market Intelligence LLC. See important notes and disclosures at the end of this article Source: Table by Simon Bowler of 2nd Market Capital, Data compiled from S&P Global Market Intelligence LLC. See important notes and disclosures at the end of this article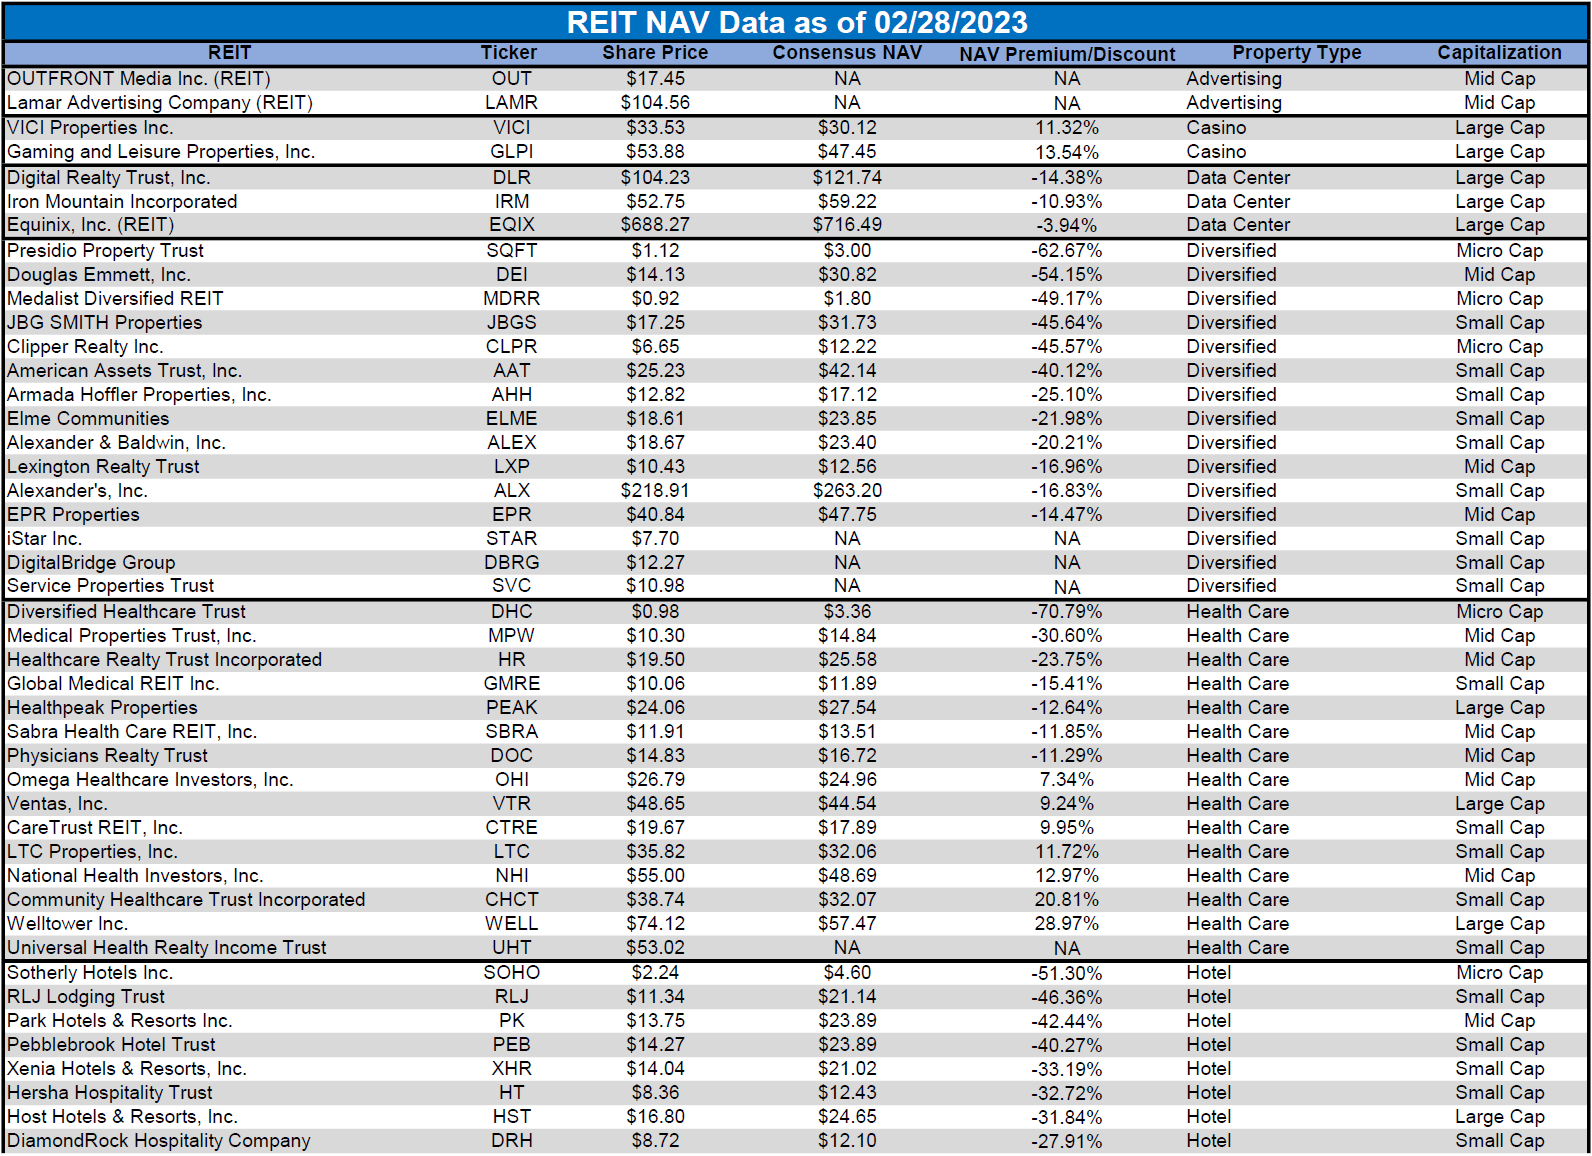
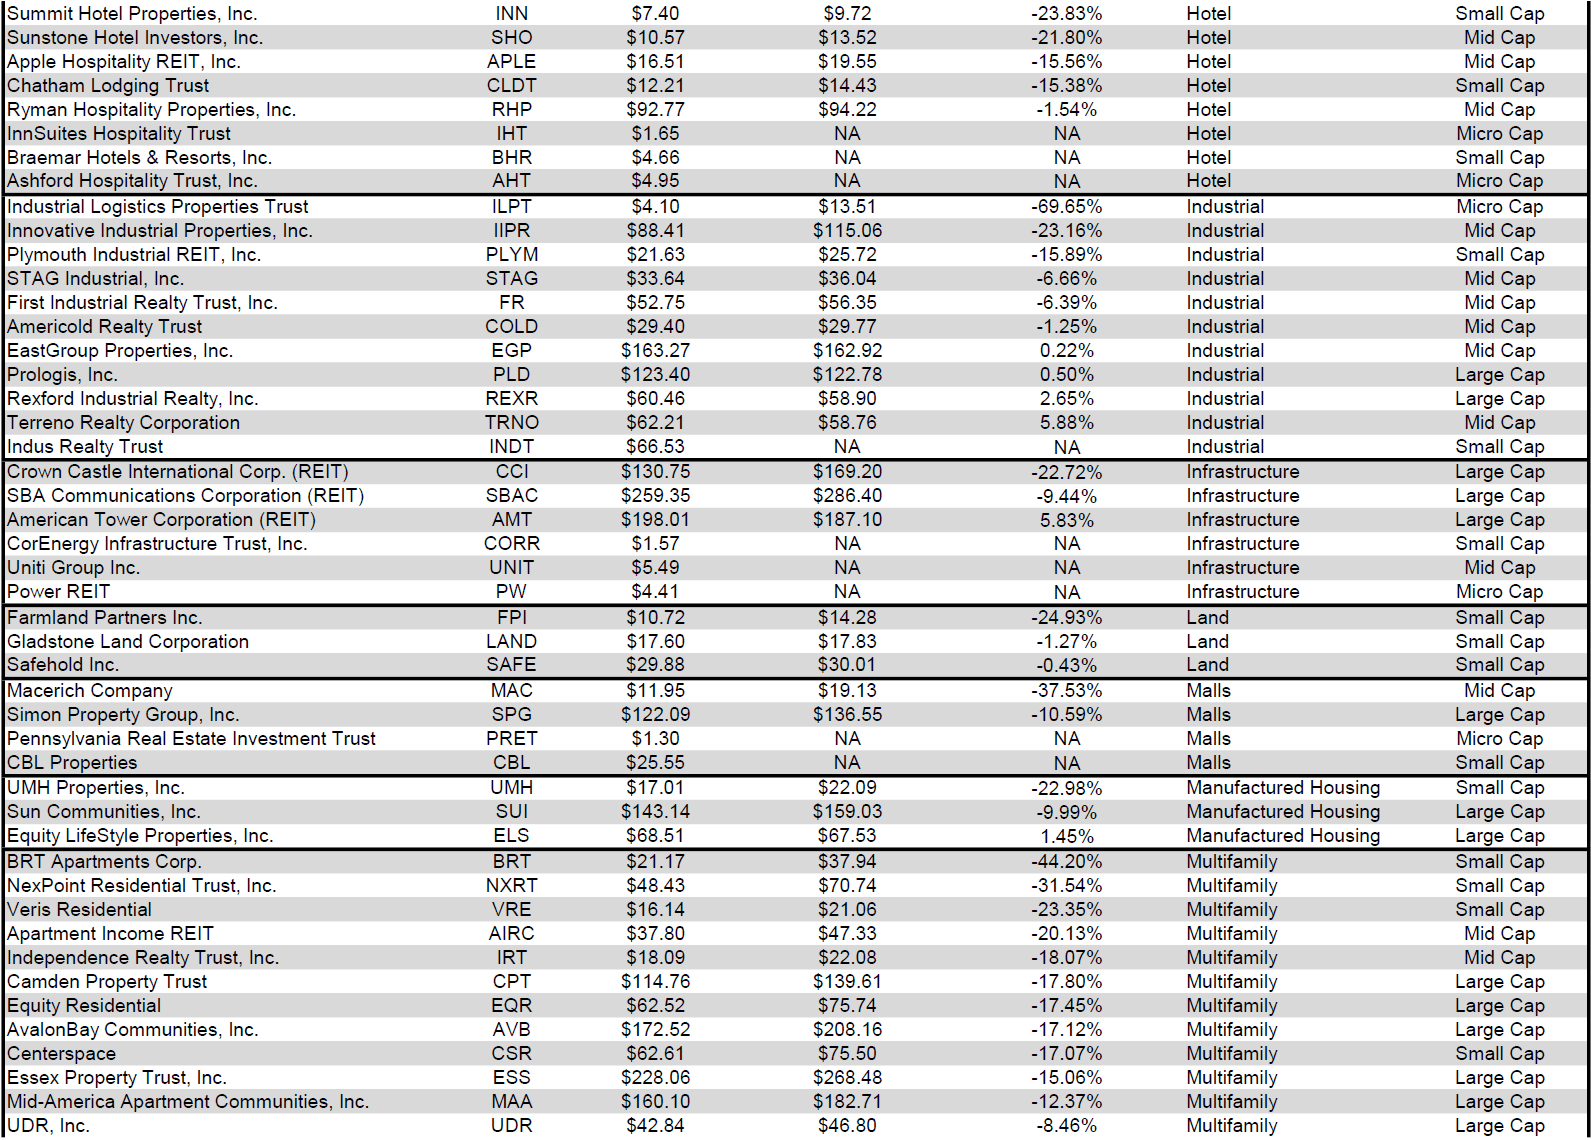
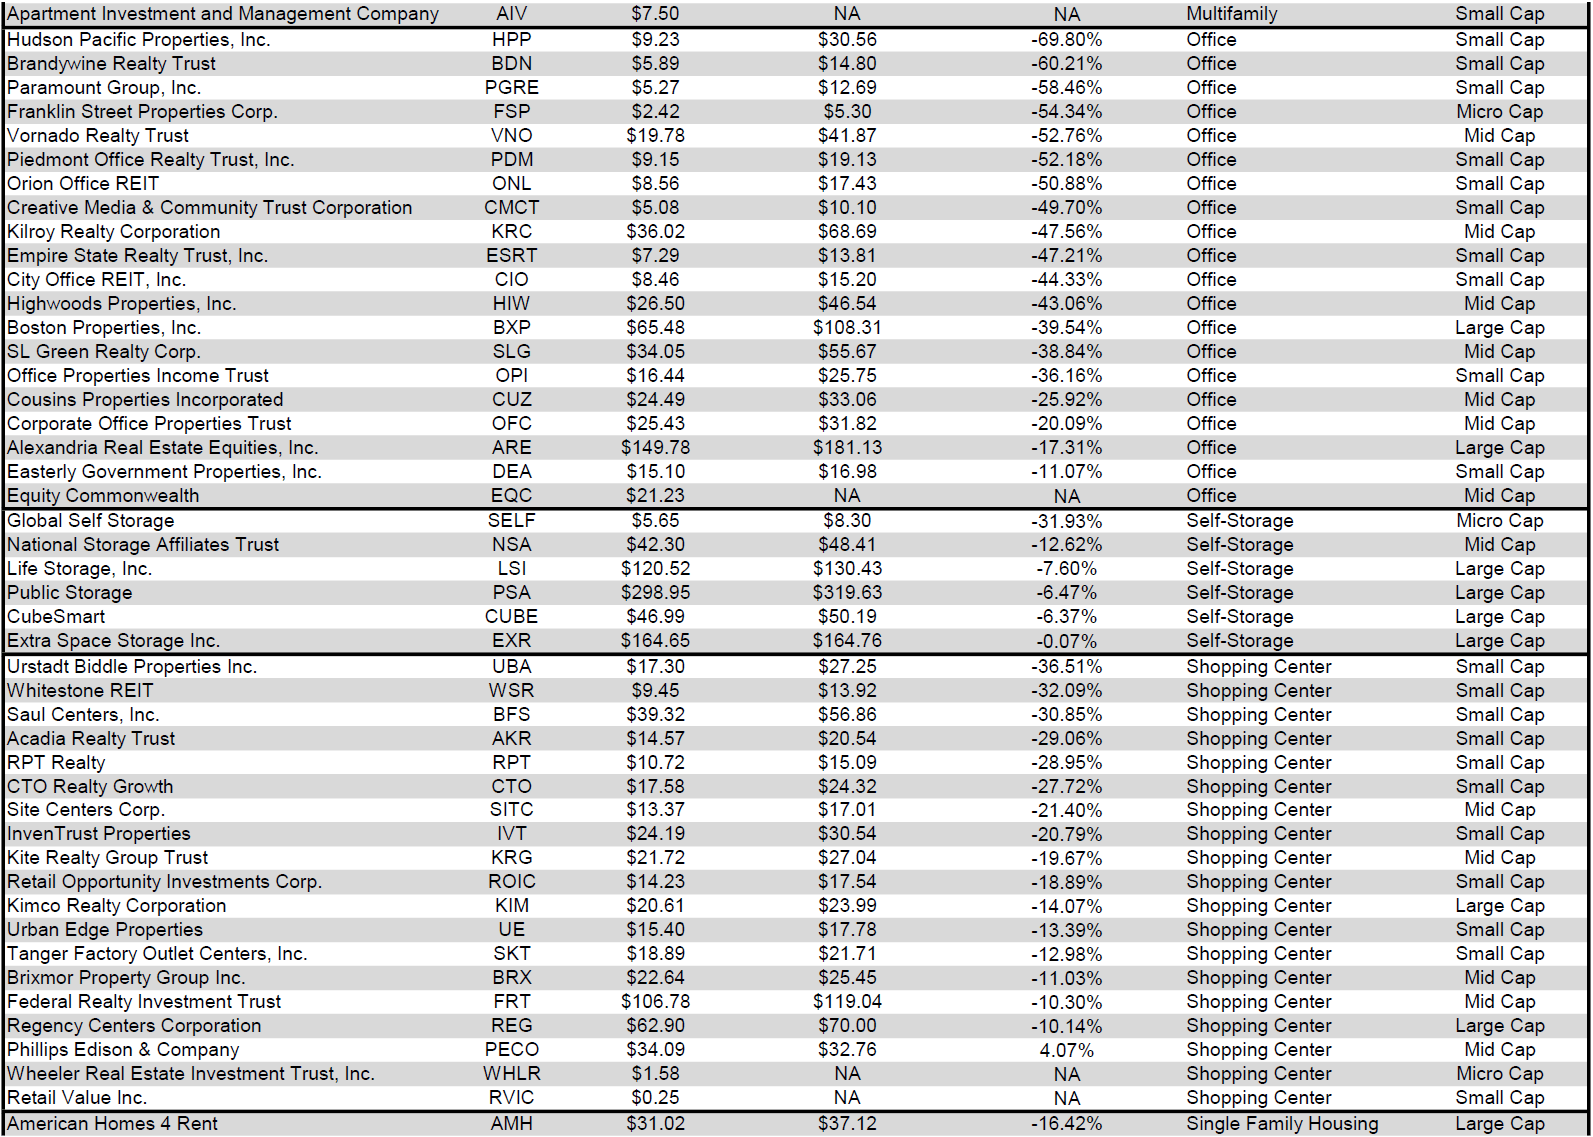
For the convenience of reading this table in a larger font, the table above is available as a PDF as well.
Takeaway
The large cap REIT premium (relative to small cap REITs) narrowed in February and investors are now paying on average about 43% more for each dollar of 2023 FFO/share to buy large cap REITs than small cap REITs (17.5x/12.2x - 1 = 43.4%). As can be seen in the table below, there is presently a strong positive correlation between market cap and FFO multiple.
Source: Table by Simon Bowler of 2nd Market Capital, Data compiled from S&P Global Market Intelligence LLC. See important notes and disclosures at the end of this article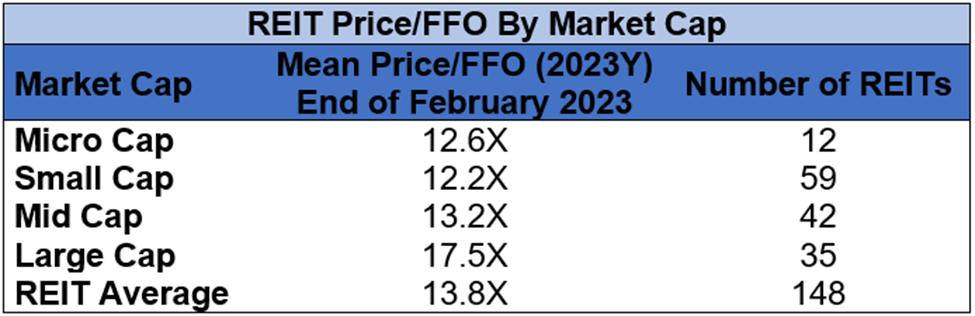
The table below shows the average premium/discount of REITs of each market cap bucket. This data, much like the data for price/FFO, shows a strong, positive correlation between market cap and Price/NAV. The average large cap REIT (-7.39%) trades at a single digit discount to NAV, while mid cap REITs (-14.74%) trade at a low double-digit discount to NAV. Small cap REITs (-25.84%) trade at about 3/4 of NAV. Micro caps on average trade at just under half of their respective NAVs (-50.20%).
Source: Table by Simon Bowler of 2nd Market Capital, Data compiled from S&P Global Market Intelligence LLC. See important notes and disclosures at the end of this article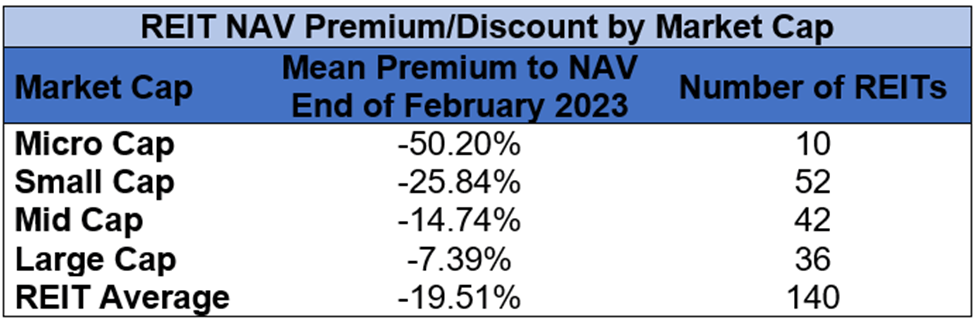
The sharp uptick in bankruptcies in December and January continued into February. The 111 bankruptcies in the first two months of 2023 is a massive increase over the 49 bankruptcies in the first two months of 2022. 2023 has seen more bankruptcies in the first two months of the year than any year since 2011. With the rapid increase in interest rates, this bankruptcy trend is likely to continue over upcoming months and may even continue to pick up speed.
Source: S&P Global Market Intelligence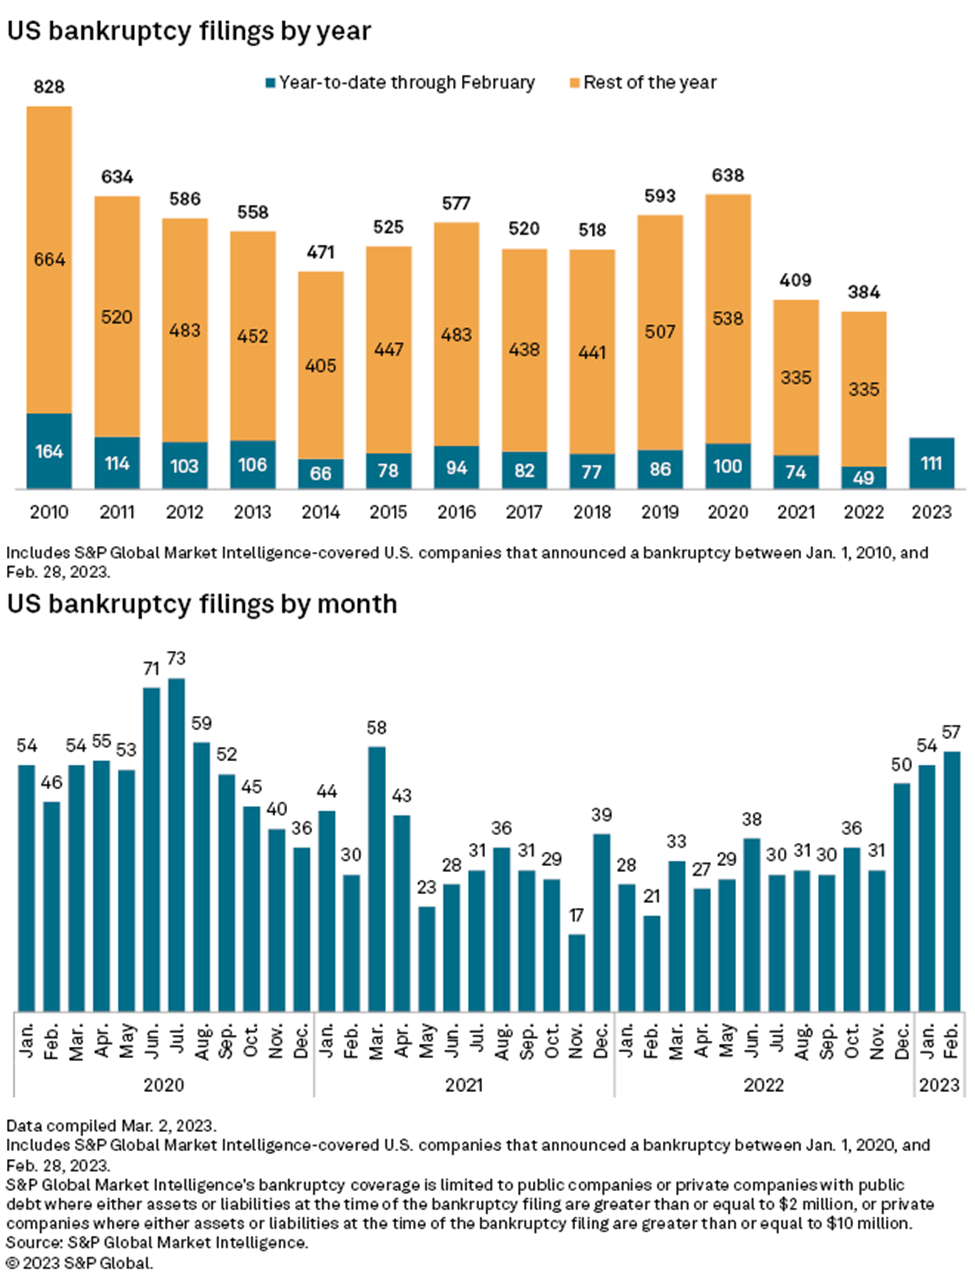
Compared to prior years, 2023 bankruptcies have been heavily skewed toward reorganizations rather than liquidations. Chapter 11 reorganizations have accounted for 78.4% of bankruptcies and Chapter 7 liquidations have only accounted for 21.6%.
Source: S&P Global Market Intelligence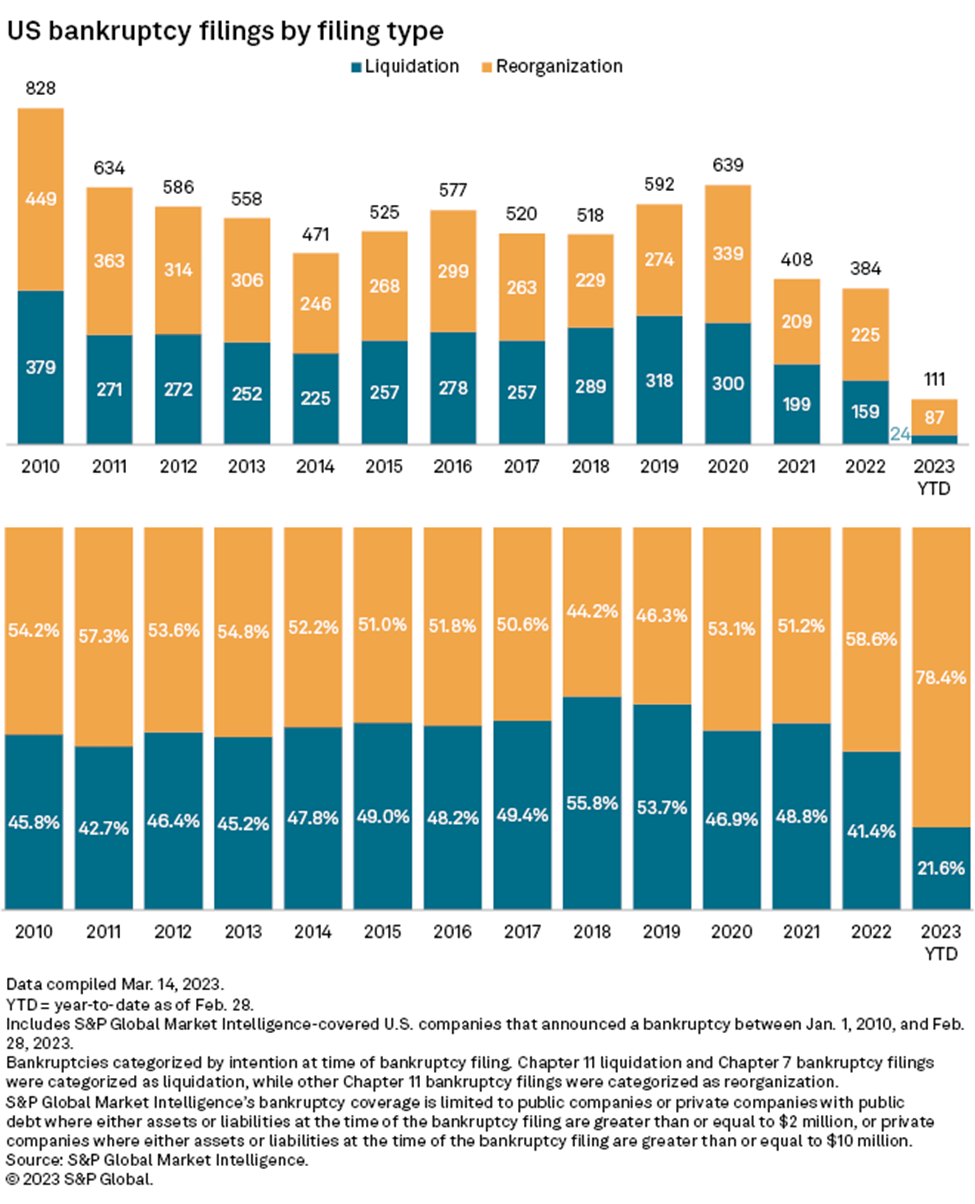
Below is the complete list of 57 companies within S&P Global Market Intelligence’s bankruptcy coverage that filed bankruptcy in February:
Source: S&P Global Market Intelligence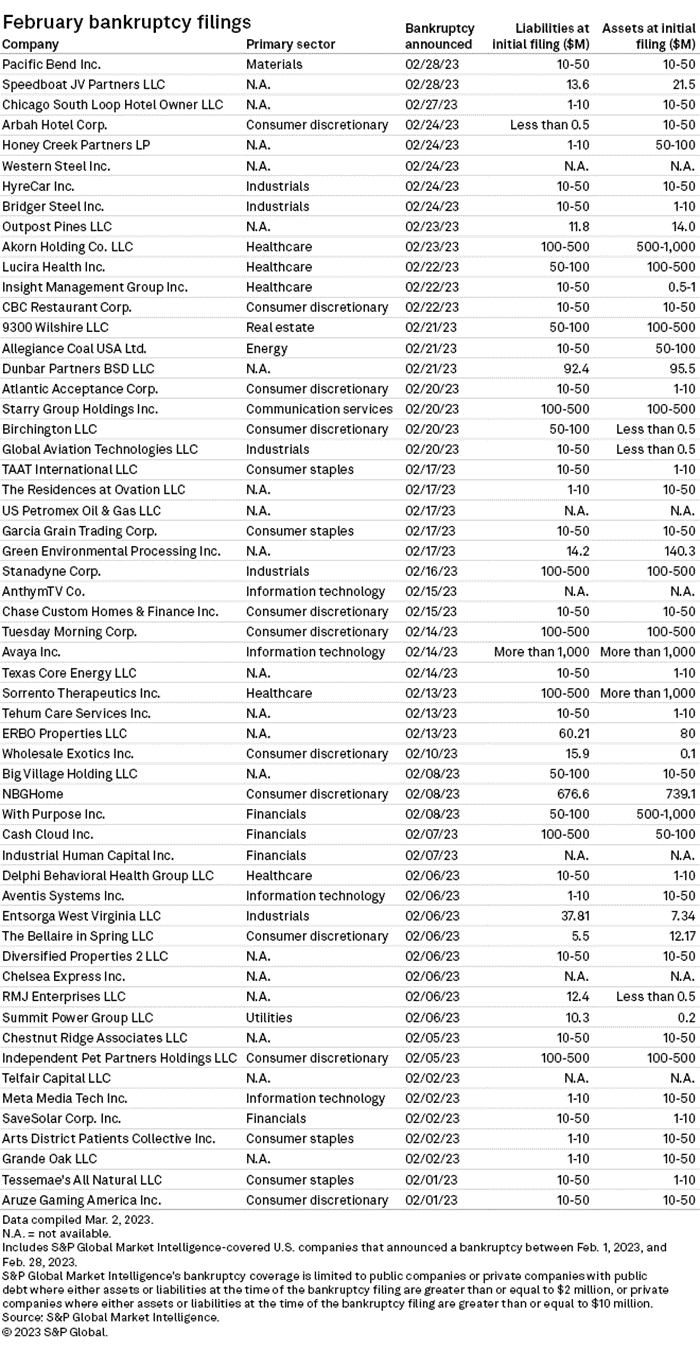
In addition to the lengthy list of February bankruptcies listed above, the recent collapse of Silicon Valley Bank has sent shockwaves through the financial sector and the total impact is still being determined. A recent analysis by S&P Global Market Intelligence identified that the equity REIT sector has limited direct exposure to Silicon Valley Bank (SIVB), which recently became the 2nd largest bank failure in the history of the US. The following REITs were found to have exposure:
- Cousins Properties (CUZ) is arguably the most impacted REIT with 204,751 square feet leased to SVB at Hayden Ferry property. As of the end of 2022, Silicon Valley Bank was Cousin’s 9th largest tenant accounting for about 1.2% of annualized rent.
- Boston Properties (BXP) is the landlord for SVB’s Seattle office, which is within the Madison Centre property that BXP acquired in May 2022. BXP has not yet reported what portion of that property is leased to SVB.
- Paramount Group (PGRE) is the landlord of SVB Securities LLC, which is a subsidiary of SVB Financial Group. SVB Securities LLC leases office space in PGRE’s 1301 Avenue of the America’s property.
- Alexandria Real Estate Equities (ARE) has a lease to an affiliate of SVB that accounts for only 0.08% of ARE’s total annual rental revenue. Additionally, however, ARE’s tenants have $108.3M of letters of credit from either SVB or affiliates of SVB. Alexandria is partnering with these tenants to get replacement security deposits.
- Hudson Pacific Properties (HPP) has no direct relationship with SVB, but 11 out of 900 tenants have letters of credit that were issued by SVB or affiliates of SVB. These leases account for about 2% of Hudson’s office square footage. Much like ARE, HPP is partnering with these tenants to replace the letters of credit with an alternate security deposit.
Bankruptcies and bank failures disproportionately impact certain companies over others, so there is tremendous opportunity to achieve alpha by closely tracking which REITs are impacted fundamentally vs. the REITs that are merely facing a share price impact due to a change in general market sentiment.
Dividends are scarce, we provide the solution

For everything you need to build a growing stream of dividend income, please consider joining Portfolio Income Solutions. As a member you will get:
- Access to a curated Real Money REIT Portfolio
- Continuous market and single stock analysis
- Data sets on every REIT
You will benefit from our team’s decades of collective experience in REIT investing. On Portfolio Income Solutions, we don’t only share our ideas, we also discuss best trading practices and help you become a better investor.
This article was written by

Simon Bowler is the Chief Communications Officer at 2nd Market Capital Advisory Corporation (2MCAC). 2MCAC specializes in the analysis and trading of real estate securities. Through a selective process and consideration of market dynamics, we aim to construct portfolios for rising streams of dividend income and capital appreciation.Our Portfolio Income Solutions Marketplace service provides stock picks, extensive analysis and data sheets to help enhance the returns of do-it-yourself investors.Investment Advisory Services
We now offer a way to directly invest in our Proprietary Investment Portfolio Strategy via REIT Total Return, which replicates our activity in client accounts. Total Return client’s brokerage accounts are automatically invested simultaneously and at the same price when we make a trade in the REIT Total Return Portfolio (also known as 2CHYP).
Learn more about our REIT Total Return Portfolio.Simon Bowler, along with fellow SA contributors Dane Bowler and Ross Bowler, is an investment advisory representative of 2nd Market Capital Advisory Corporation (2MCAC), a state-registered investment advisor.Full Disclosure. All content is published and provided as an information source for investors capable of making their own investment decisions. None of the information offered should be construed to be advice or a recommendation that any particular security, portfolio of securities, transaction, or investment strategy is suitable for any specific person. The information offered is impersonal and not tailored to the investment needs of the specific person. Please see our SA Disclosure Statement for our Full Disclaimer.
Disclosure: I/we have a beneficial long position in the shares of ARE either through stock ownership, options, or other derivatives. I wrote this article myself, and it expresses my own opinions. I am not receiving compensation for it. I have no business relationship with any company whose stock is mentioned in this article.
Additional disclosure: Important Notes and Disclosure
All articles are published and provided as an information source for investors capable of making their own investment decisions. None of the information offered should be construed to be advice or a recommendation that any particular security, portfolio of securities, transaction, or investment strategy is suitable for any specific person.
The information offered is impersonal and not tailored to the investment needs of any specific person. Readers should verify all claims and do their own due diligence before investing in any securities, including those mentioned in the article. NEVER make an investment decision based solely on the information provided in our articles.
It should not be assumed that any of the securities transactions or holdings discussed were profitable or will prove to be profitable. Past performance does not guarantee future results. Investing in publicly held securities is speculative and involves risk, including the possible loss of principal. Historical returns should not be used as the primary basis for investment decisions.
Commentary may contain forward-looking statements which are by definition uncertain. Actual results may differ materially from our forecasts or estimations, and 2MCAC and its affiliates cannot be held liable for the use of and reliance upon the opinions, estimates, forecasts, and findings in this article.
S&P Global Market Intelligence LLC. Contains copyrighted material distributed under license from S&P
2nd Market Capital Advisory Corporation (2MCAC) is a Wisconsin registered investment advisor. Simon Bowler is an investment advisor representative of 2nd Market Capital Advisory Corporation.