State Street: A SWAN Bank That Could Triple In 6 Years

Summary
- Fears of the collapse of Silicon Valley Bank have sent financial stocks crashing like crypto in 2022!
- The world's best banks are trading like they did during the Financial Crisis, even though there is no crisis looming.
- State Street Corporation is the world's 2nd largest custodial bank, with a business model that should be immune from the SVB crisis. It is one of the safest banks around.
- State Street Corporation is 30% undervalued and could double in three years, and more than triple in five years. Long-term analysts expect higher interest rates to drive 14% returns, similar to what it's delivered over the last 37 years.
- Looking for more investing ideas like this one? Get them exclusively at iREIT on Alpha. Learn More »
artisteer
This article was coproduced with Dividend Sensei.
The market has lost its darn mind! Maybe you've noticed how in the last few days, fears of the collapse of Silicon Valley Bank of SVB Financial Group (SIVB) sent financial stocks crashing like crypto in 2022!
I understand why many are terrified of bank failures. After all, we had almost 160 of them in 2008. That year, I lost half my life savings, and my good friend Brad Thomas lost his real estate empire. My family almost lost our house, and millions of lives were ruined.
I barely slept during the GFC, but in this "crisis," I'm not losing a wink of sleep. Why? Because there is no financial crisis! The Treasury, Fed, and FDIC have backstopped all banking deposits and have an efficient way to ensure that no bank has to become a forced seller of risk-free bonds, which is why Silver Gate, Signature, and SVB all failed.
But the market doesn't have to make sense in the short-term, and indeed it's not making a lick of sense.
So let me show you why one of the craziest markets in 35 years creates an incredible opportunity to potentially triple your money...or more, in the coming years.
Not with some speculative tech stock or crypto coin, but with one of the best banks on earth and my favorite SWAN bank buy right now.
Let me show you the three reasons why.
Reason One: A Hysterical Market Creating Insanely Great Opportunities In The Best Financials On Earth
As I just explained in two articles, we're NOT in a financial crisis.
We're seeing bond market craziness we haven't seen in 35 years!
The 2-year yield is down 1% in 3 days! The last time that happened was Black Monday, 1987 when the S&P fell 20%...in a single day!
Royal Bank of Canada, Morgan Stanley, and Mitsubishi think this bond rally is driven by algorithms and could reverse within days.
The 2-year yield could return to 5% by the end of the week.
Basically, this is the craziest financial market we've seen in years or even decades, and when the markets make no sense, that's an opportunity to profit.
State Street Corporation (NYSE:STT) is one of the safest banks on earth you can buy right now, yet it's down 13% in a week!
This bank's business model has no connection to SVB or other financially failed banks.
All of which have been crypto or VC related
“State Street Corporation provides financial services to institutional investors, including investment servicing, investment management, and investment research and trading. The company's clients include asset managers and owners, insurance companies, official institutions, and central banks." - Morningstar.
State Street's customers are the world's largest banks, investment companies, and long-term investing institutions.
They include the likes of BlackRock, Vanguard, Fidelity, pension funds, endowments, and sovereign wealth funds.
Its customers are also family office billionaires and ultra-high-net-worth individuals.
This is what State Street does:
Maintaining custody of assets
fund administration
investment record-keeping
securities lending
foreign-exchange trading services
data services to institutional asset owners and asset managers.
Does this sound like SBV or Silvergate, or Signature Bank? It's nothing like those failed banks.
State Street Credit Ratings
Rating Agency | Credit Rating | 30-Year Default/Bankruptcy Risk | Chance of Losing 100% Of Your Investment 1 In |
S&P | A stable | 0.66% | 151.5 |
Fitch | AA- Stable Outlook | 0.55% | 181.8 |
Moody's | A1 (A+ Equivalent) Stable Outlook | 0.60% | 166.7 |
DBRS | AA+ Stable | 0.29% | 344.8 |
Consensus | AA- Stable Outlook | 0.5% | 190.5 |
(Sources: S&P, Fitch, Moody's, DBRS.)
This is one of the safest banks in the world, and its business model is relatively recession resistant and totally immune from SVB's issues.
During the Pandemic, its earnings fell by 0%.
State Street is working on becoming a one-stop-shop solution for its institutional clients, offering everything from fund administration to risk management for clients.
The company also has a $3 trillion asset management business representing 15% of the revenue it's considering selling or spinning off into a joint venture with another company.
The point is that State Street is one of the most diversified and strongest financials on earth. That should be no surprise as it was founded in 1792 and has thrived and survived through:
41 recessions
13 depressions
the Great Depression
two world wars
six killer pandemics
including the Spanish Flu pandemic that killed 5% of humanity
over 23 bear markets
including an 86% market crash
inflation as high as 22%
interest rates as high as 20%.
If you're worried about State Street surviving this recession or SVB banking crisis, don't be. This bank will almost certainly outlive us all, and probably our grandchildren too!
If rates stay high, STT benefits from much higher net interest income, which grew 20% just in the last quarter and 63% year-over-year. STT's net interest margin is expected to remain 50% higher by 2024 than it was in 2021.
But this bank's growth levers are far beyond mere high-interest rates. In fact, about 75% of its revenue is stable fee-based sales with just 25% rate-sensitive NIM.
In fact, when rates were zero, they grew at 8%.
Reason Two: The Best Growth Outlook In 15 Years
Interest rate uncertainty is the highest in 35 years, and the recession could be just months away. Yet, look at how stable STT's business is expected to be.
Metric | 2022 Growth | 2023 Growth Consensus (potential recession year) | 2024 Growth Consensus (potential recession year) | 2025 Growth Consensus |
Sales | 10% | 6% | 3% | 3% |
Dividend | 10% | 11% | 8% | 5% |
Earnings | 0% | 17% | 11% | 12% |
Book Value | -4% | 7% | 7% | 4% |
(Source: FAST Graphs, FactSet.)
Does this look like a stock that should be trading at 8.5X earnings, priced for zero growth?
Does it look like a broken company that should be down 12% in less than a week?
Thanks to higher for longer interest rates, including the bond market pricing in the Fed staying at 3% once the recession is over and inflation is beaten, STT's growth outlook is at the best it's been in 15 years!
It's 10.8% long-term growth consensus is the best of the custodial banking giants and creates incredible long-term return potential.
Historical Returns Since 1986
Since 1986 STT's rolling returns have been between 10% and 15% and it's consistently beaten the S&P. What about the future?
Consensus Long-Term Return Potential
Investment Strategy | Yield | LT Consensus Growth | LT Consensus Total Return Potential | Long-Term Risk-Adjusted Expected Return |
State Street | 3.3% | 10.8% | 14.1% | 9.8% |
Bank of New York Mellon | 3.1% | 10.1% | 13.2% | 9.2% |
Schwab US Dividend Equity ETF | 3.6% | 9.4% | 13.0% | 9.1% |
Northern Trust | 3.5% | 9.2% | 12.7% | 8.9% |
Vanguard Dividend Appreciation ETF | 2.2% | 10.0% | 12.2% | 8.5% |
Nasdaq | 0.8% | 10.9% | 11.7% | 8.2% |
Dividend Aristocrats | 1.9% | 8.5% | 10.4% | 7.3% |
S&P 500 | 1.7% | 8.5% | 10.2% | 7.1% |
REITs | 3.9% | 6.1% | 10.0% | 7.0% |
60/40 Retirement Portfolio | 2.1% | 5.1% | 7.2% | 5.0% |
(Source: DK Research Terminal, FactSet, Morningstar.)
State Street is expected to deliver about 14% long-term returns, similar to what it's done for the last 37 years.
Inflation-Adjusted Consensus Return Potential Per $1,000 Investment
Time Frame (Years) | 7.9% CAGR Inflation-Adjusted S&P 500 Consensus | 5.4% Inflation-Adjusted BNS Consensus | 11.8% CAGR Inflation-Adjusted STT Consensus | Difference Between Inflation-Adjusted STT Consensus And S&P Consensus |
5 | $1,465.25 | $1,298.31 | $1,747.44 | $282.19 |
10 | $2,146.96 | $1,685.61 | $3,053.56 | $906.60 |
15 | $3,145.84 | $2,188.45 | $5,335.92 | $2,190.09 |
20 | $4,609.44 | $2,841.29 | $9,324.23 | $4,714.79 |
25 | $6,753.99 | $3,688.88 | $16,293.57 | $9,539.58 |
30 | $9,896.29 | $4,789.31 | $28,472.10 | $18,575.81 |
(Source: DK Research Terminal, FactSet.)
STT offers nearly 30X long-term return potential, far more than the lower yielding and far more overvalued S&P.
Time Frame (Years) | Ratio Inflation-Adjusted STT Consensus vs. S&P consensus |
5 | 1.19 |
10 | 1.42 |
15 | 1.70 |
20 | 2.02 |
25 | 2.41 |
30 | 2.88 |
(Source: DK Research Terminal, FactSet.)
2X the safe yield of the S&P and 3X the long-term return potential. But you don't have to wait decades to make incredible returns on STT.
State Street 2025 Consensus Return Potential
FAST Graphs, FactSet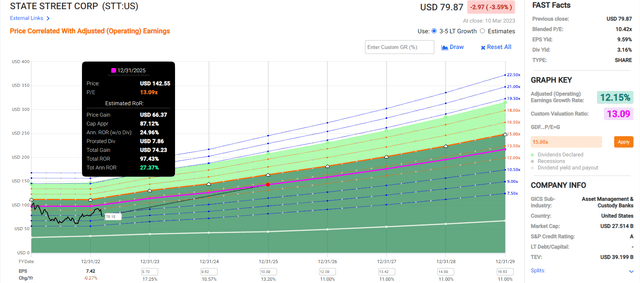
STT has the potential to double in the next three years, generating Buffett-like 27% annual returns.
State Street 2029 Consensus Return Potential
FAST Graphs, FactSet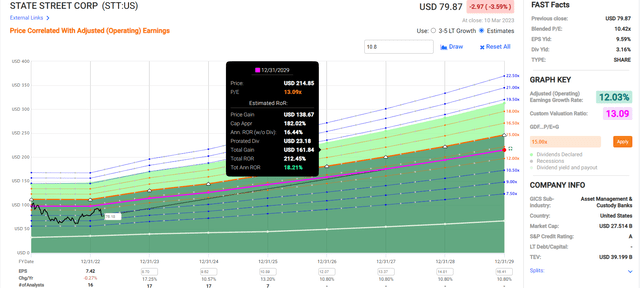
If STT grows as expected and returns to historical market-determined fair value in six years, it could more than triple, generating 18% annual returns.
Why? Because State Street is dirt cheap for no good reason!
Reason Three: A Wonderful Company At A Wonderful Price
Millions of income investors have paid between 12.5 and 13.3X earnings for STT, after the Great Recession, in a chronically low-rate world.
The bond market thinks rates will be permanently higher in the future, helping STT grow faster than it has during the last 15 years.
Metric | Historical Fair Value Multiples (13-Years) | 2022 | 2023 | 2024 | 2025 | FAST Graphs, FactSet Fair Value |
5-Year Average Yield | 2.81% | $85.41 | $89.68 | $89.68 | $104.63 | |
13-year median yield | 2.01% | $119.40 | $125.37 | $125.37 | $146.27 | |
PE | 13.09 | $97.13 | $113.23 | $125.27 | $128.67 | |
Average | $98.75 | $107.30 | $110.66 | $124.14 | $108.01 | |
Current Price | $76.93 | |||||
Discount To Fair Value | 22.10% | 28.30% | 30.48% | 38.03% | 28.78% | |
Upside To Fair Value (including dividend) | 28.37% | 39.48% | 43.85% | 61.37% | 43.68% | |
2023 EPS | 2024 EPS | 2023 Weighted FFO | 2024 Weighted FFO | 12-Month Forward FFO | Historical Average Fair Value Forward PE | Current Forward PE |
$8.65 | $9.57 | $6.82 | $2.02 | $8.84 | 12.2 | 8.7 |
STT is conservatively worth 12.2X earnings and today trades at an almost anti-bubble 8.7 that prices in about 0.4% long-term growth.
For a company that's growing at double-digits.
Rating | Margin Of Safety For Very Low-Risk 11/13 SWAN | 2023 Fair Value Price | 2024 Fair Value Price | 12-Month Forward Fair Value |
Potentially Reasonable Buy | 0% | $107.30 | $110.66 | $108.01 |
Potentially Good Buy | 15% | $91.21 | $94.06 | $91.81 |
Potentially Strong Buy | 25% | $80.48 | $83.00 | $81.01 |
Potentially Very Strong Buy | 35% | $59.28 | $71.93 | $70.21 |
Potentially Ultra-Value Buy | 45% | $59.02 | $60.86 | $59.41 |
Currently | $76.36 | 28.84% | 31.00% | 29.30% |
Upside To Fair Value (Including Dividends) | 43.82% | 48.22% | 44.75% |
State Street is a potentially strong buy for anyone comfortable with its risk profile.
Risk Profile: Why State Street Isn't Right For Everyone
There are no risk-free companies, and no company is right for everyone. You have to be comfortable with the fundamental risk profile.
State Street Risk Profile
“State Street’s revenue is roughly 75% fee-based, with the remainder primarily net interest income. We do believe the firm’s fee revenue tends to be relatively stable, but it is affected by market levels, foreign-exchange volume, and securities lending volume. About 55% of State Street’s servicing fees (45% of firmwide revenue) are asset-based and 55%-60% of State Street’s assets under custody or administration are equity-based. State Street’s investment-management unit (approximately 15% of revenue) is affected by market levels and flows. State Street has lost ETF market share to BlackRock and Vanguard, and we expect this to continue. Overall, we estimate a 10% change in equity markets would result in about a 2% change to firmwide revenue.
The level of net interest income is more uncertain, as net interest margin and balance sheet size can be difficult to forecast. State Street's NIM increased in 2018 as interest rates rose, but declined in 2019 and 2020 and 2021. Given the sharp rise in rates in 2022, net interest income increased by 34%.
From an environmental, social, and governance perspective, we expect the largest risks to occur around product governance. If product pricing is not perceived as fair, that can create headline risks. One example is foreign-exchange trading services. In October 2009, the attorney general of California (then Jerry Brown) filed a complaint against State Street regarding the rates at which indirect trades were executed. California was one of many states that sued. In 2016, the company mostly settled its claims, paying $575 million. As another example, the firm identified it incorrectly invoiced clients in 2015 and then discovered another billing problem in 2017. It also settled with the Securities and Exchange Commission in 2019 for undisclosed markups for sending messages through the Swift network. We believe if incidents like these continue, State Street’s reputation would suffer and its ability to garner new clients would diminish." - Morningstar.
State Street's Risk Profile Includes
modest economic cyclicality risk
regulatory risk (mostly capital requirements from the Fed and international banking authorities)
asset management market share risk: losing market share to BlackRock and Vanguard
interest rate risk (25% of sales are net interest income)
reputational risk: several scandals and lawsuits surrounding the pricing of some of its services
litigation risk: settling lawsuits has cost STT up to $575 million in the past
currency risk: 43% of sales from overseas.
How do we quantify, monitor, and track such a complex risk profile? By doing what big institutions do.
Long-Term Risk Management Analysis: How Large Institutions Measure Total Risk Management
DK uses S&P Global's global long-term risk-management ratings for our risk rating.
S&P has spent over 20 years perfecting their risk model
which is based on over 30 major risk categories, over 130 subcategories, and 1,000 individual metrics
50% of metrics are industry specific
this risk rating has been included in every credit rating for decades.
The DK risk rating is based on the global percentile of a company's risk management compared to 8,000 S&P-rated companies covering 90% of the world's market cap.
STT scores 95th Percentile On Global Long-Term Risk Management
S&P's risk management scores factor in things like:
supply chain management
crisis management
cyber-security
privacy protection
efficiency
R&D efficiency
innovation management
labor relations
talent retention
worker training/skills improvement
occupational health & safety
customer relationship management
business ethics
climate strategy adaptation
sustainable agricultural practices
corporate governance
brand management.
STT's Long-Term Risk Management Is The 46th Best In The Master List, 91st Percentile In The Master List)
Classification | S&P LT Risk-Management Global Percentile | Risk-Management Interpretation | Risk-Management Rating |
BTI, ILMN, SIEGY, SPGI, WM, CI, CSCO, WMB, SAP, CL | 100 | Exceptional (Top 80 companies in the world) | Very Low Risk |
State Street | 95 | Exceptional | Very Low Risk |
Strong ESG Stocks | 86 | Very Good | Very Low Risk |
Foreign Dividend Stocks | 77 | Good, Bordering On Very Good | Low Risk |
Ultra SWANs | 74 | Good | Low Risk |
Dividend Aristocrats | 67 | Above-Average (Bordering On Good) | Low Risk |
Low Volatility Stocks | 65 | Above-Average | Low Risk |
Master List average | 61 | Above-Average | Low Risk |
Dividend Kings | 60 | Above-Average | Low Risk |
Hyper-Growth stocks | 59 | Average, Bordering On Above-Average | Medium Risk |
Dividend Champions | 55 | Average | Medium Risk |
Monthly Dividend Stocks | 41 | Average | Medium Risk |
(Source: DK Research Terminal.)
STT's risk-management consensus is in the top 9% of the world's best blue chips and is similar to:
Prologis (PLD): Ultra SWAN
Hershey (HSY): Ultra SWAN
Cummins (CMI): Ultra SWAN
Toronto-Dominion Bank (TD): Ultra SWAN
Enbridge (ENB): Ultra SWAN dividend aristocrat.
The bottom line is that all companies have risks, and STT is exceptional, at managing theirs, according to S&P.
How We Monitor STT's Risk Profile
20 analysts,
four credit rating agencies
24 experts who collectively know this business better than anyone other than management.
“When the facts change, I change my mind. What do you do, sir?"
- John Maynard Keynes.
There are no sacred cows at iREIT or Dividend Kings. Wherever the fundamentals lead, we always follow. That's the essence of disciplined financial science, the math behind retiring rich and staying rich in retirement.
Bottom Line: Cash In On Market Craziness With State Street And Potentially Triple Your Money In 6 Years
Let me be clear: I'm NOT calling the bottom in STT (I'm not a market-timer).
Fundamentals are all that determine safety and quality, and my recommendations.
over 30+ years, 97% of stock returns are a function of pure fundamentals, not luck
in the short term; luck is 25X as powerful as fundamentals
in the long term, fundamentals are 33X as powerful as luck.
While I can't predict the market in the short term, here's what I can tell you about STT.
The industry growth leader in custodial banks
a highly diversified business and funding sources
immune from the SVB crisis
safe 3.3% yield (growing at high single digits)
14.1% long-term return potential Vs. 10.2% S&P
historically 30% undervalued (44% upside to fair value)
8.7X earnings vs. 12.5 to 13.3 historical
212% consensus return potential over the next five years, 18% to annually, 5X more than the S&P 500
2X the consensus income return potential of S&P over the next 5 years.
Dividend Kings Automated Investment Decision Score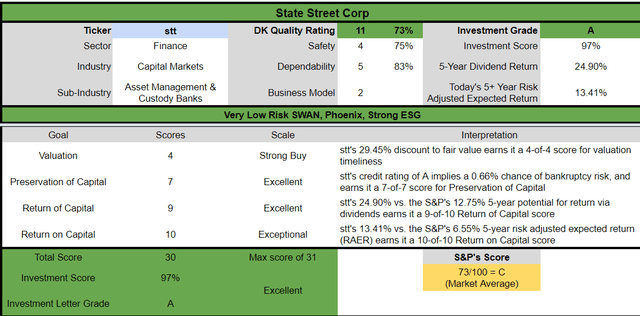
In the short term, the market is often irrational. Today, it's lost its darn mind!
The craziest bond market in 35 years is acting as if the world is ending and the world's best financials are trading as if it were the Great Recession.
But there is no financial crisis. Your bank deposits should be safe. Your company's bank deposits should be safe.
The only ones losing their shirts right now are shareholders, bond holders, and management at failed crypto and VC banks!
Is that a logical reason for a global custody titan like State Street, who is immune from the SVB crisis, to trade at a 30% discount?
Should a company growing at double-digits, potentially through a recession, be priced for zero growth?
Should one of the world's most trusted financial institutions, which has survived, and thrived and enriched investors for 231 years and is protected by an AA-balance sheet and 95th percentile risk management trade as if it were on death's door?
Obviously not, and that makes State Street one of the best Buffett-like high-yield "fat pitch" buys you can make right now.
Get My New Book For Free!
Join iREIT on Alpha today to get the most in-depth research that includes REITs, mREIT, Preferreds, BDCs, MLPs, ETFs, and we recently added Prop Tech SPACs to the lineup. Nothing to lose with our FREE 2-week trial.
And this offer includes a 2-Week FREE TRIAL plus my FREE book.
This article was written by

Brad Thomas is the CEO of Wide Moat Research ("WMR"), a subscription-based publisher of financial information, serving over 15,000 investors around the world. WMR has a team of experienced multi-disciplined analysts covering all dividend categories, including REITs, MLPs, BDCs, and traditional C-Corps.
The WMR brands include: (1) iREIT on Alpha (Seeking Alpha), and (2) The Dividend Kings (Seeking Alpha), and (3) Wide Moat Research. He is also the editor of The Forbes Real Estate Investor.
Thomas has also been featured in Barron's, Forbes Magazine, Kiplinger’s, US News & World Report, Money, NPR, Institutional Investor, GlobeStreet, CNN, Newsmax, and Fox.
He is the #1 contributing analyst on Seeking Alpha in 2014, 2015, 2016, 2017, 2018, 2019, 2020, 2021, and 2022 (based on page views) and has over 108,000 followers (on Seeking Alpha). Thomas is also the author of The Intelligent REIT Investor Guide (Wiley) and is writing a new book, REITs For Dummies.
Thomas received a Bachelor of Science degree in Business/Economics from Presbyterian College and he is married with 5 wonderful kids. He has over 30 years of real estate investing experience and is one of the most prolific writers on Seeking Alpha. To learn more about Brad visit HERE.Disclosure: I/we have no stock, option or similar derivative position in any of the companies mentioned, and no plans to initiate any such positions within the next 72 hours. I wrote this article myself, and it expresses my own opinions. I am not receiving compensation for it (other than from Seeking Alpha). I have no business relationship with any company whose stock is mentioned in this article.
Additional disclosure: Author's note: Brad Thomas is a Wall Street writer, which means he's not always right with his predictions or recommendations. Since that also applies to his grammar, please excuse any typos you may find. Also, this article is free: Written and distributed only to assist in research while providing a forum for second-level thinking.