Hindalco Industries
Hindalco Industries shares corrected 5 percent on March 16 after a decisive breakdown of the consolidation range and fall below the February low, indicating bearishness.
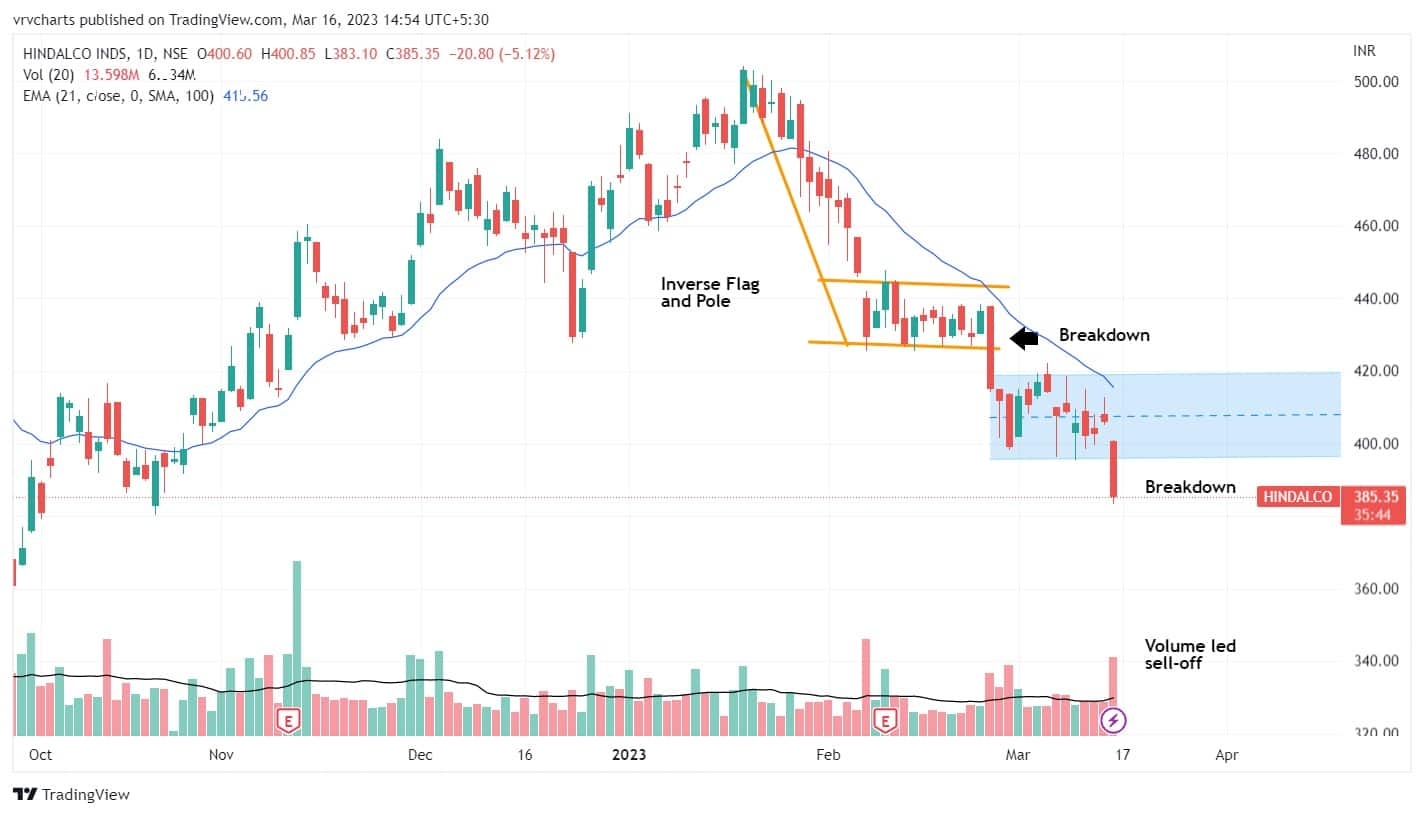
The stock has been falling since it touched a nine-month high of Rs 504 on January 18. In mid-February, the counter saw consolidation or sideways trade for several sessions following a decisive breakout of a bearish Flag and Pole pattern on the downside on February 24. It again entered consolidation mode, forming another small Flag and Pole pattern since the start of March, which also has been broken decisively on the downside on March 16.
Hence, there could be a possibility of the stock falling up to the low of September 2022, which is around Rs 359, or another 6-odd percent correction from current levels.
The aluminium major closed the day at Rs 385 on the NSE, down 5.22 percent. It has fallen around 24 percent since the January high.
The stock has seen a gap-down opening and formed a long bearish candlestick pattern on the daily charts with robust volumes while on the monthly scale, it has seen the formation of a bearish candle with lower highs and lower lows formation.
"Hindalco has been in a corrective mode since January 2023 and formed a bearish Flag and Pole pattern. After the initial breakdown that was observed on February 24, the stock started trading sideways and broke below the consolidation once again with massive volumes," Viraj Vyas, Technical & Derivatives Analyst - Institutional Equity at Ashika Stock Broking said.
Lower highs, lower lows
He feels the current structure is also depicting lower highs and lower lows, inferring that the stock remains a ‘sell on rise’ until it can move past the Rs 420 level, around the high of March.
Further, the stock has also given upward sloping support trendline breakout adjoining lows of September 28, 2022, and February 28, 2023, which also may be giving a possibility of further downside.
Another negative signal comes from moving averages. The stock currently traded below all key moving averages whether SMA or EMA (5, 9, 21, 50, and 100-day).
"Hindalco has seen falling off from a rising channel; this channel was formed when the stock found its bottom near Rs 310-312 and started a gradual up move while forming higher tops and higher bottoms. The recent corrective decline has seen the stock slipping below the 50-, 100-, and 200-DMA," Foram Chheda, Technical Research Analyst and Founder of ChartAnalytics.co.in, said.
She said today's price has seen a downward breach of this rising channel; the price can find support near the previous lows formed near Rs 360-365 from where a rebound can be expected.
PSAR (parabolic stop and reverse) continues to remain in a continuous sell mode. A close above Rs 400 will turn the stock bullish again, Chheda said.
Disclaimer: The views and investment tips expressed by investment experts on Moneycontrol.com are their own and not those of the website or its management. Moneycontrol.com advises users to check with certified experts before taking any investment decisions.