HDV: High Dividends Lead Me To Take A Second Look At This ETF

Summary
- I last did a full review of iShares Core High Dividend ETF all the way back in 2016. Based on recent results at the time, I reviewed it quite favorably.
- Since then, however, a lot has changed with ETF investing. As an example, most major brokerages offer commission-free trading, so competition is wide open.
- In this review, I will return for a second look. This time, however, I will be taking a longer-term view.
- The challenge, I find, is to incorporate what I may believe important in the near term with a longer-term outlook. I will do my best to summarize both to help readers form their own view.
- I do much more than just articles at Hoya Capital Income Builder: Members get access to model portfolios, regular updates, a chat room, and more. Learn More »
Daenin Arnee/iStock via Getty Images
(This article was co-produced with Hoya Capital Real Estate.)
Man, how time flies!
It's been a full 7 years since I took my last detailed look at iShares Core High Dividend ETF (NYSEARCA:HDV). I wrote my last full review of this exchange-traded fund, or ETF, back in 2016, shortly after introducing The ETF Monkey 2016 Model Portfolio. At the time, commission-free trading in ETFs other than those offered by the provider themselves was not nearly as common as it is today. And so, recognizing that commissions quickly eat into results-particularly for investors who invest in regular increments-I built specific implementations for Vanguard, Fidelity, and Charles Schwab.
Since that time, the benefits of competition have been such that all of these brokerages, as well as several others, offer commission-free trading in ETFs. This opens the doors for investors to focus on the question of which ETFs truly best serve their needs, as opposed to what the commission structure is at their particular broker.
In terms of dividend-focused ETFs, in my personal portfolio I currently hold iShares Core Dividend Growth ETF (DGRO), Schwab U.S. Dividend Equity ETF (SCHD), Vanguard Dividend Appreciation ETF (VIG) and Vanguard High Dividend Yield ETF (VYM). While I like all 4 of these ETFs for various reasons, I find it good to always keep an open mind. With that in mind, let's take a look at HDV to see how it stands up to current competition.
HDV - Examining iShares' Approach To Seeking High Dividends While Reducing Risk
In my most recent article, I reviewed WisdomTree U.S. High Dividend Fund (DHS). I was intrigued because this ETF uses a unique methodology to seek high dividends while keeping risk in check. At some level, HDV does basically the same thing, albeit with a slightly different approach. At the same time, while DHS charges an expense ratio of .38%, HDV boasts a much lower expense ratio of only .08%, putting it much more in line with competitive ETFs such as those I currently hold in my portfolio.
HDV seeks to track the investment results of the Morningstar Dividend Yield Focus Index, which offers exposure to high quality U.S.-domiciled companies that have had strong financial health and an ability to sustain above average dividend payouts. In turn, this is a subset of the Morningstar US Market Index, a broad market index that represents approximately 97% of the market capitalization of publicly-traded U.S. stocks.
According to HDV's prospectus, these are the screens involved:
- The Morningstar Economic MoatTM rating system. Stocks in the index are designated as having a rating of either "narrow" or "wide" based on the strength of the company's competitive advantage.
- Morningstar's Distance to Default measure. This is a quantitative option pricing approach that estimates a company's probability of default.
Morningstar uncertainty rating. This additional screen reduces exposure to companies with lower margins of safety.
- All dividends must be qualified income. The goal here is to increase after-tax yield.
From there, 75 stocks are selected, weighted by the total dollar amount of dividends paid rather than yield. It is perhaps this last step that gives the fund it bias towards larger firms, while the sum total of all the steps produces unique sector biases. The index undergoes quarterly rebalance and reconstitution.
What sorts of stocks survive this set of filters? Here, from a product brief, is how iShares features HDV two heaviest-weighted holdings.
HDV - Characteristics of Top 2 Holdings (iShares Product Brief)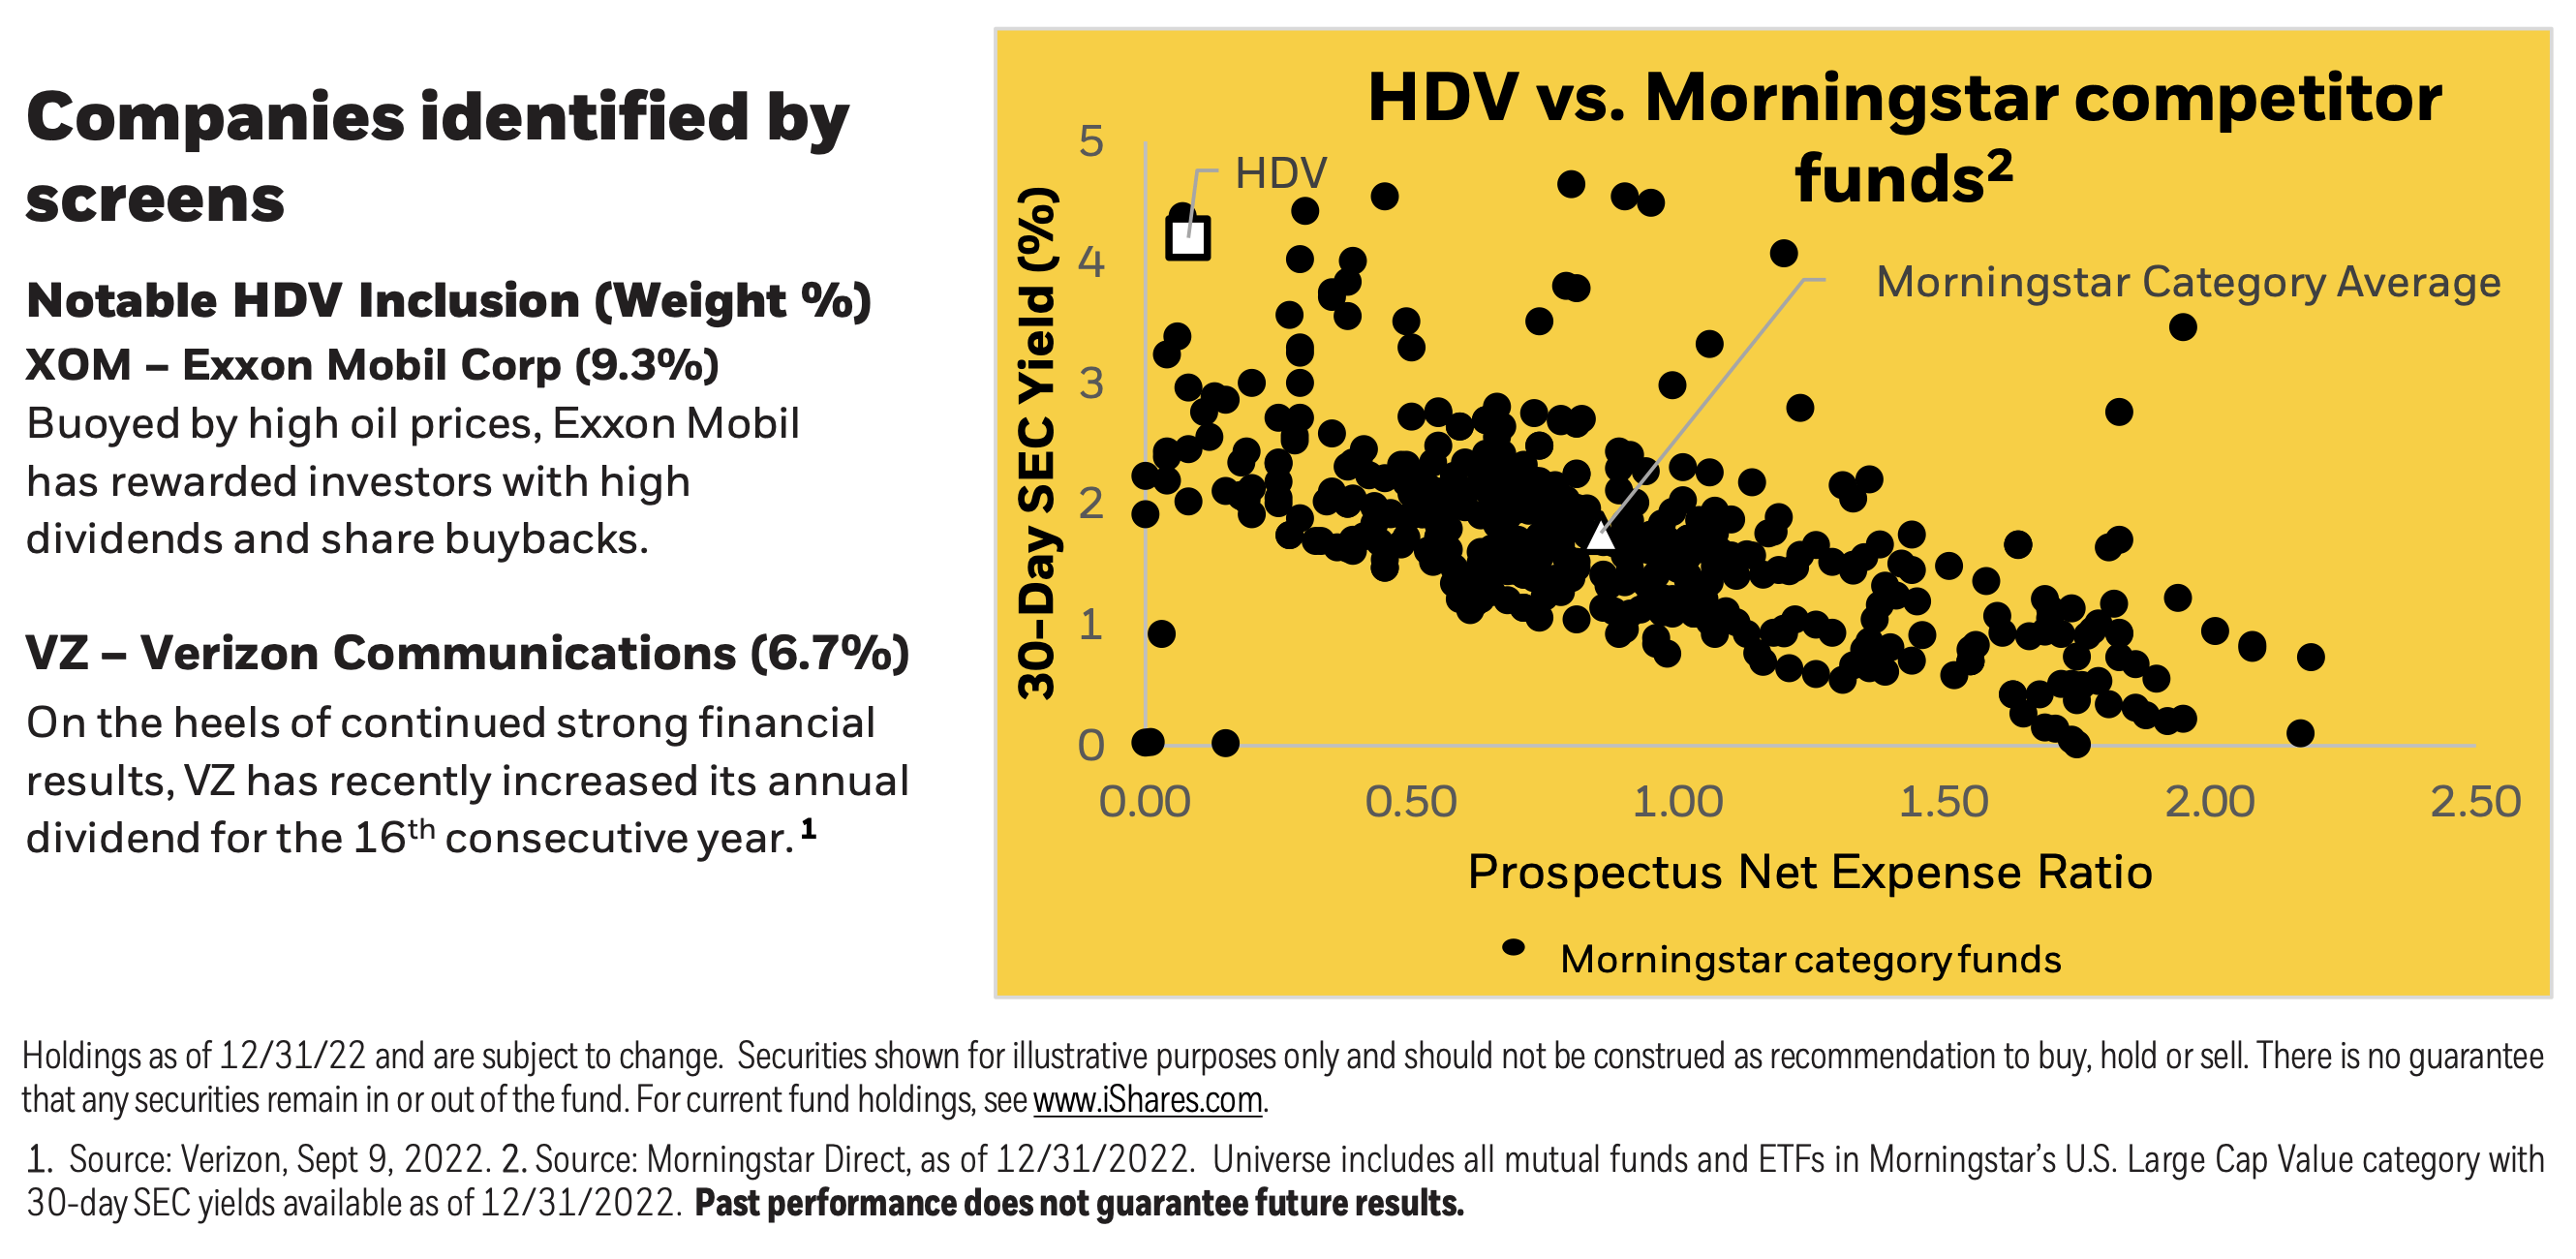
Looking beyond the Top 2 holdings, how does HDV's methodology play out in practice? Let's take a look a very nice combo graphic here on Seeking Alpha.
HDV: Portfolio Characteristics (Seeking Alpha)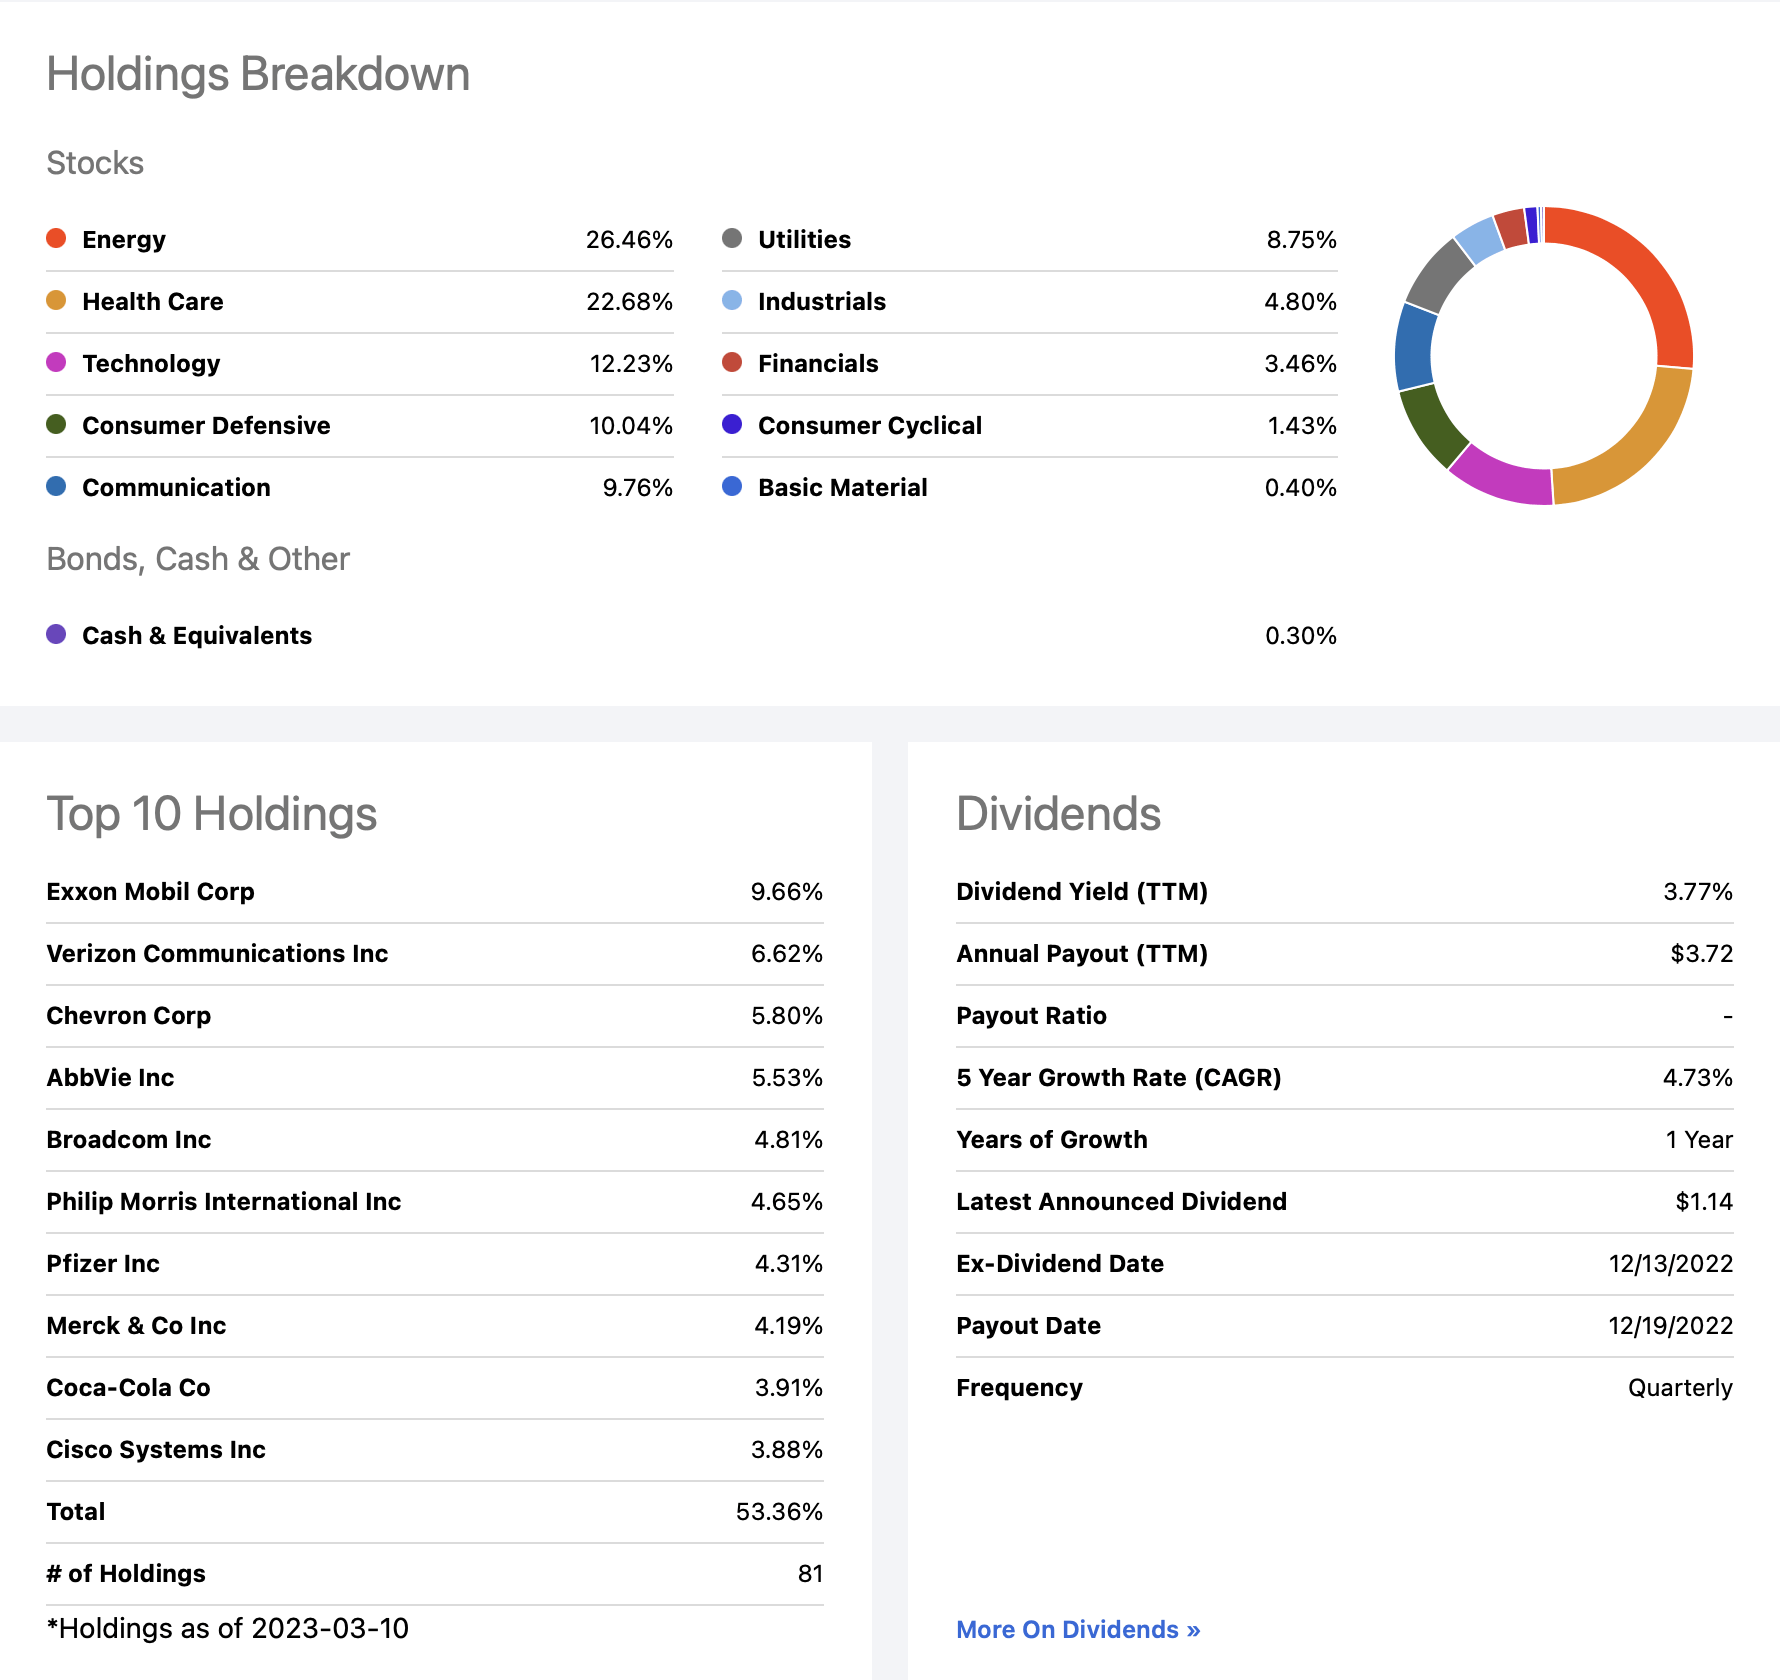
Let's focus first on the top 2 sectors; Energy and Health Care. A recent Fidelity Sector Outlook document I reviewed posits that, with the possible exception of a severe COVID outbreak or severe global recession, Energy should continue to hold up well in 2023. With respect to Health Care, in a recent review featuring two quality ETFs in this sector, I shared a positive outlook with respect to this sector as well.
Next, let's take a quick look at HDV's Top 10 holdings. As featured above, the fact that HDV weights holdings by the total dollar amount of dividends paid rather than yield gives it a bias towards larger firms. It also results in a fund that, at 53.36%, is more heavily concentrated at the top than other ETFs in the space. As just two examples, VYM's inclusion of over 400 holdings leaves it with only 23.29% in its Top 10, and SCHD, which includes just over 100 holdings in all, has a concentration of 41.40% in its Top 10.
At the same time, as I look closely at the 10 companies represented, I feel that they form a nice cross-section as we face perhaps a rather challenging year ahead.
Examining HDV's Performance - Where The Rubber Meets The Road
In terms of analyzing how well HDV has fared, similar to what I did with DHS, I decided to compare it against SCHD and VYM, referenced earlier. As a last "bonus" of sorts, I left DHS in as well. For this particular exercise, I chose to focus in on just the current year-to-date. I realize this is a fairly short frame of reference but, in terms of thinking about HDV right this minute, it may have some relevance. I might note, though, that if you were to expand this to consider the past full year, the comparative results are actually quite similar, with both HDV and DHS holding up relatively well.
HDV/VYM/SCHD/DHS: YTD Performance Comparison (Seeking Alpha)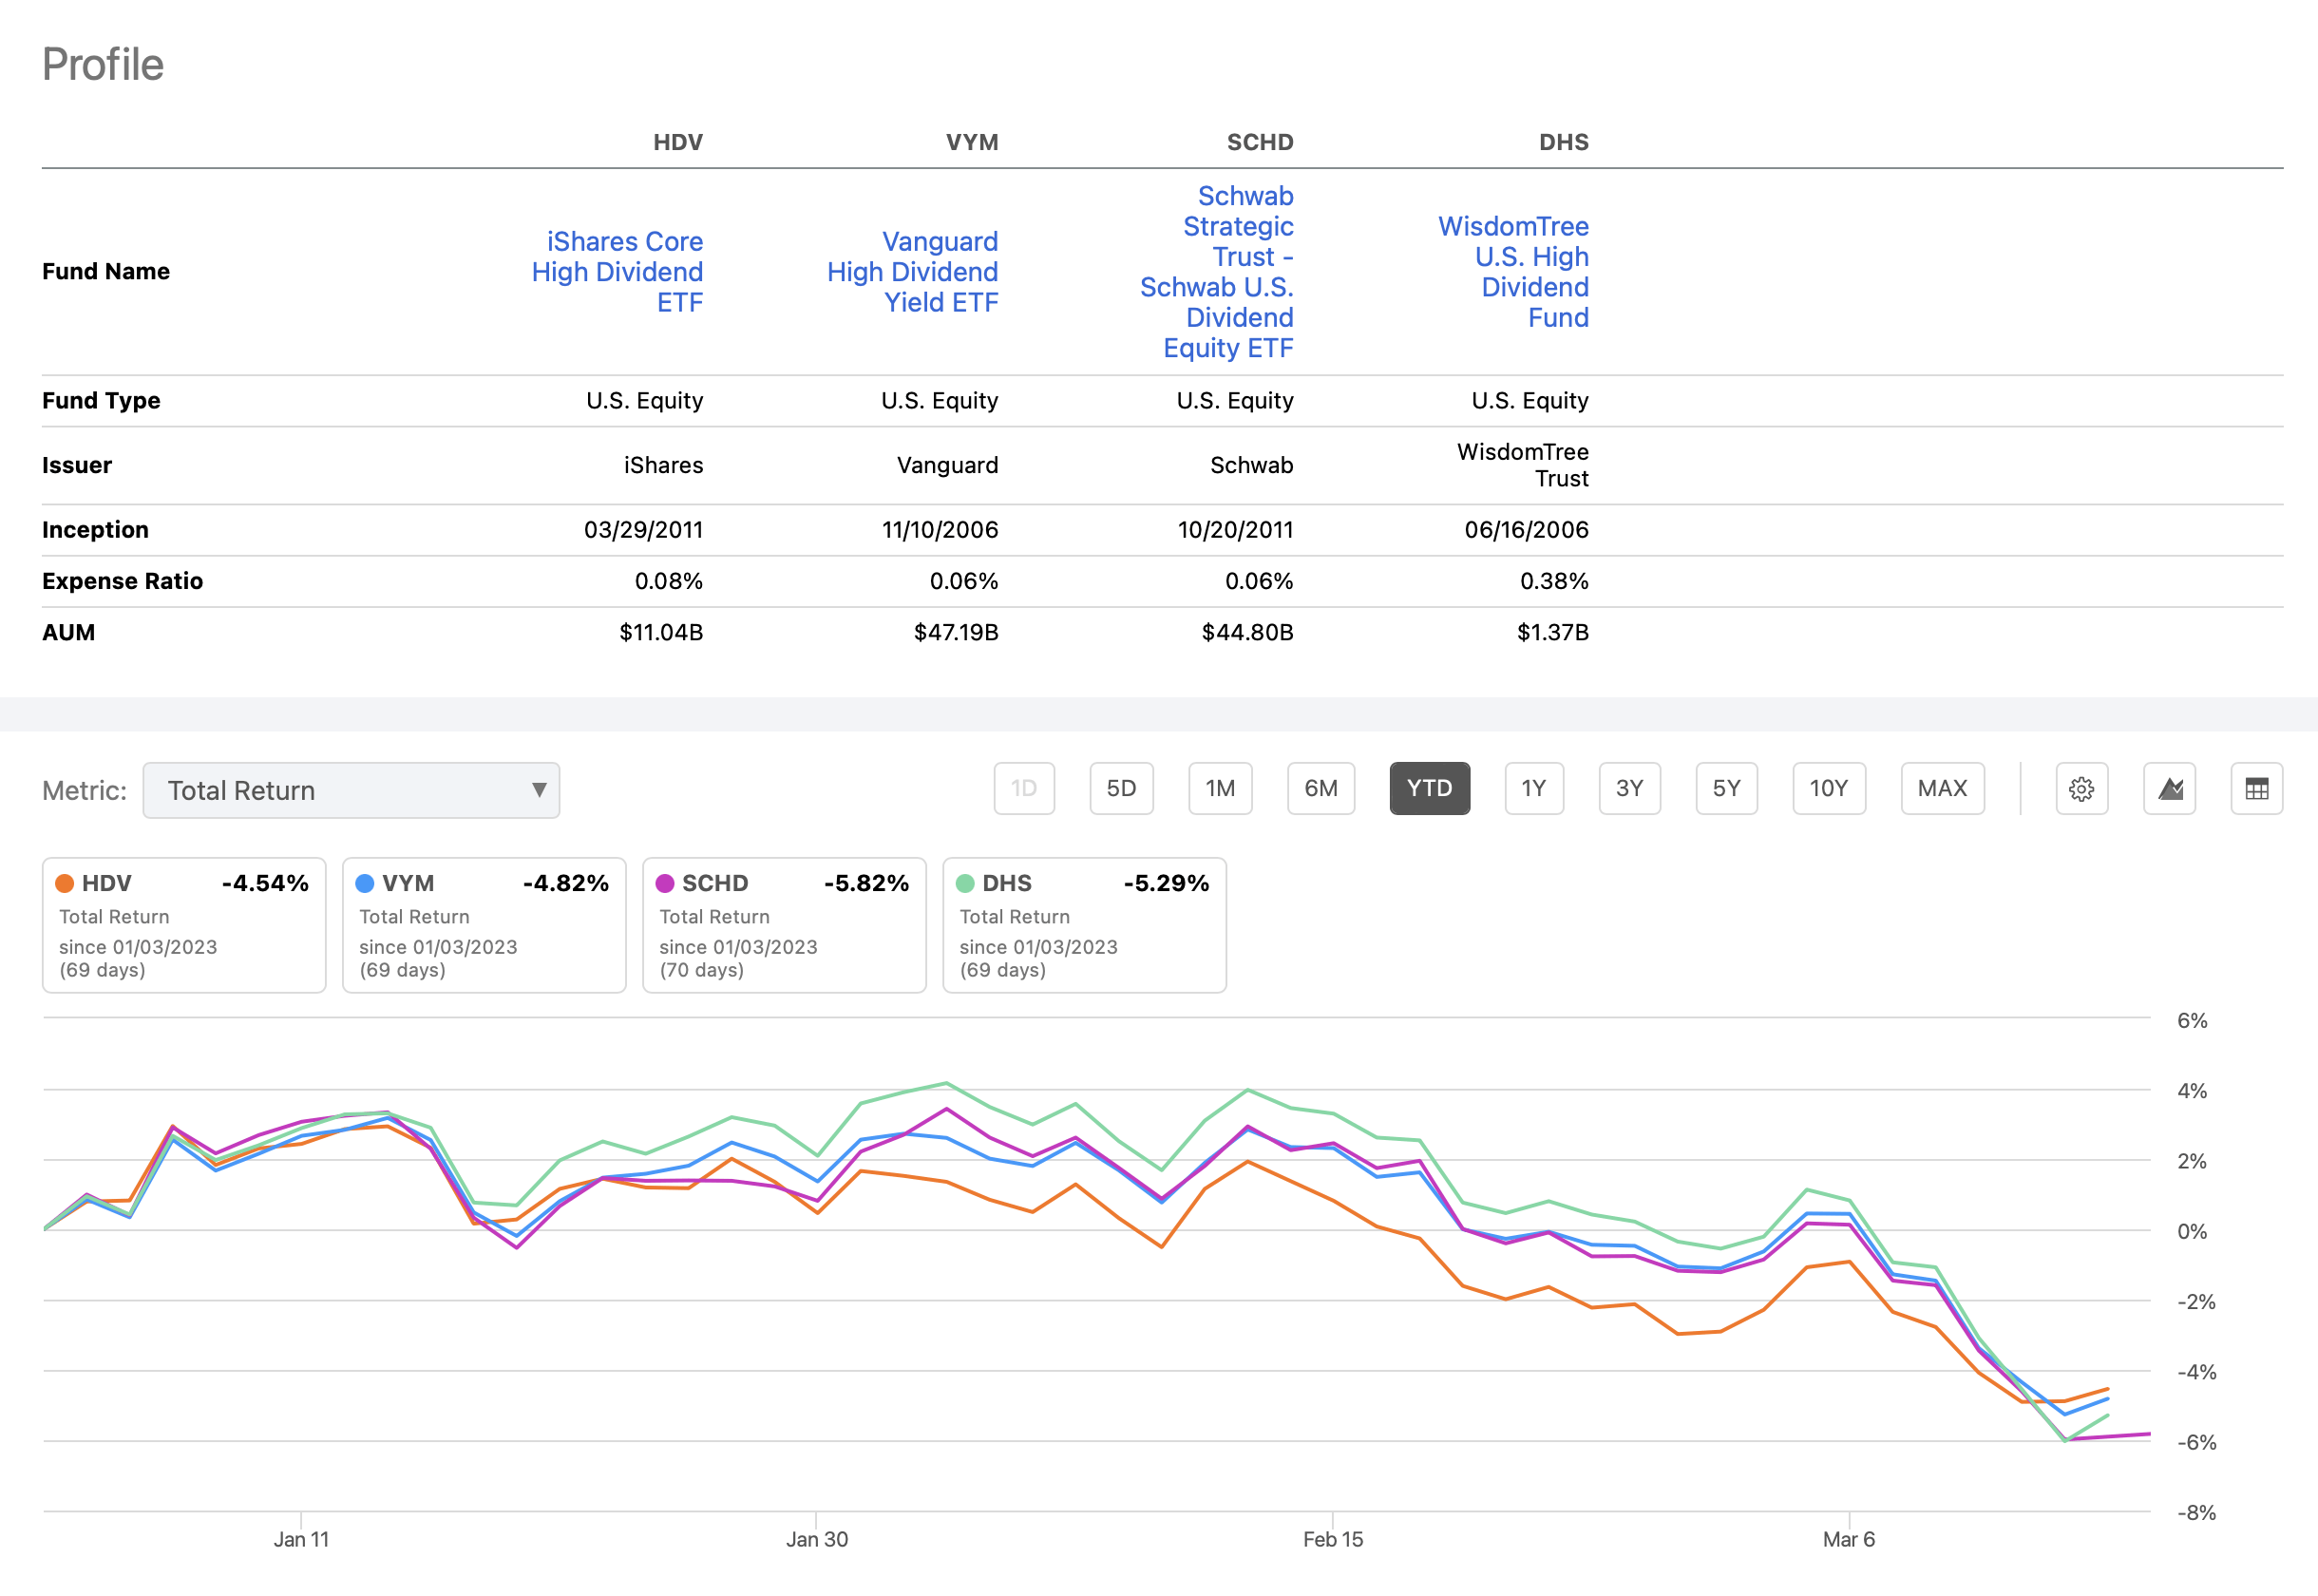
At the same time-and I found this to be the case with DHS as well-if you open up the comparison to include a longer time frame, HDV doesn't stack up quite as well against the competition.
Here's the same comparison as I performed above, but this time over the past 3 years.
HDV/VYM/SCHD/DHS: 3-Year Performance Comparison (Seeking Alpha)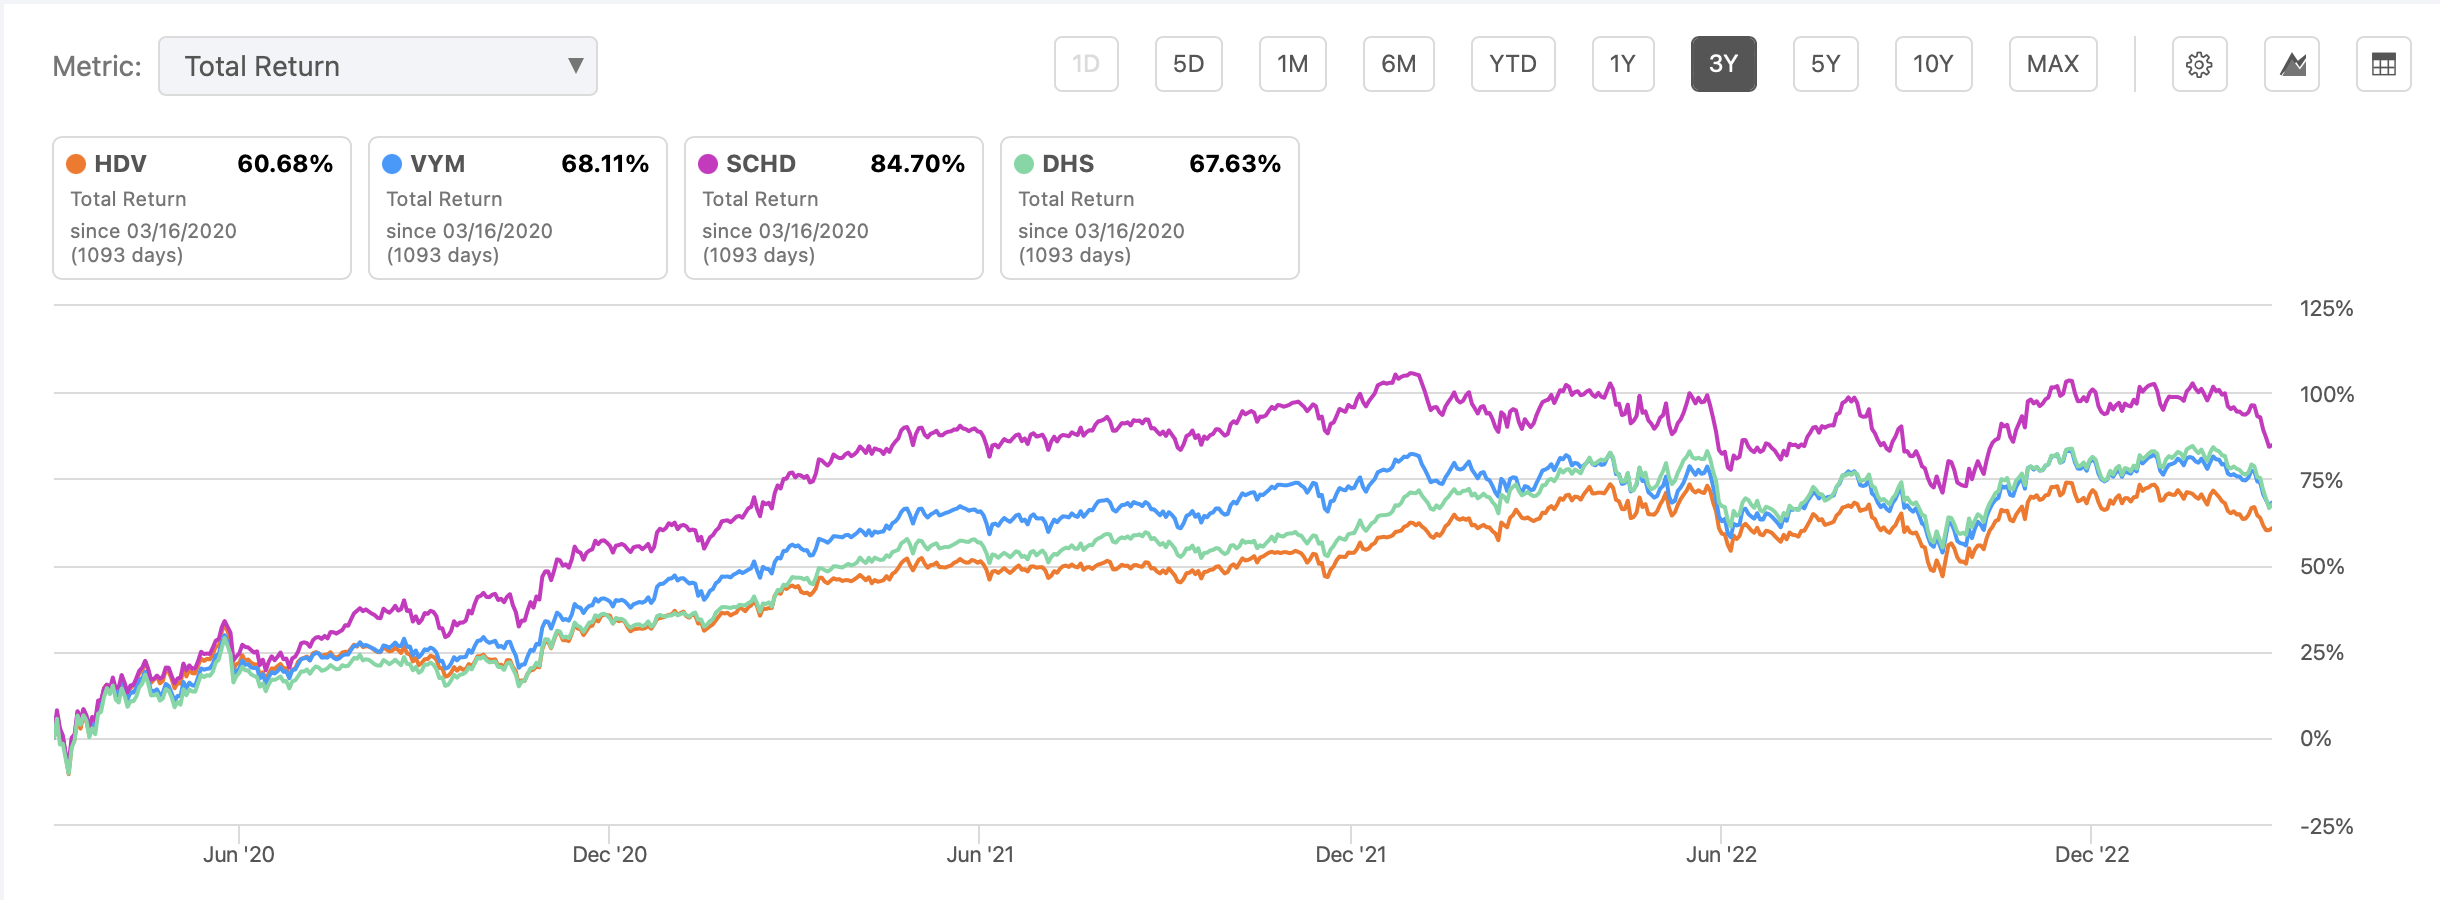
As can be seen, over this time frame, HDV trails the 3 other ETFs, including DHS. Going just a step further, if you were to look at the 5-year version of the above, you would see the same thing. Finally, while I won't link the comparison here because I don't feel the need to belabor the point, a similar examination on Portfolio Visualizer reveals that HDV's risk/reward ratio, as measured by its Sharpe and Sortino ratios, falls far short of other choices over any reasonably long measurement period.
Summary And Conclusion
So where does all of this leave us?
If you were to go back and look at my 2016 review of HDV, you will note that I spoke quite favorably of this ETF. Why? Because, for the most recent quarter, it had actually outperformed some of its competitors from Fidelity and Schwab.
As time went on, however, I began to notice that this outperformance was somewhat of a rare event. As I wrote further performance updates on the 3 versions of my model portfolio, iShares Core High Dividend ETF quickly began to fall behind.
It's that same dilemma I am pondering moving forward. Given where we are right this minute, it could be that HDV outperforms in the short run. I featured the fact that its two most heavily weighted sectors appear solid at the present time, and further that the companies in its top-heavy Top 10 offer some good defensive characteristics.
At the same time, if you choose to move forward with iShares Core High Dividend ETF at the present time, I suspect you will at some point be faced with the question of where you exit the fund and possibly look to other ETFs that may offer potential in the longer term.
So there you have my summary. What do you think? Whether you agree, or disagree, I'd love to hear from you in the comments section below.
ETF Monkey Teams Up With Income Builder
ETF Monkey has teamed up with Hoya Capital to offer the premier income-focused investing service on Seeking Alpha. Members receive complete early access to our articles along with exclusive income-focused model portfolios and a comprehensive suite of tools and models to help build sustainable portfolio income targeting premium dividend yields of up to 10%.

Whether your focus is High Yield or Dividend Growth, we’ve got you covered with actionable investment research focusing on real income-producing asset classes that offer potential diversification, monthly income, capital appreciation, and inflation hedging. Start A Free 2-Week Trial Today!

This article was written by

Disclosure: I/we have a beneficial long position in the shares of DGRO, SCHD, VIG, VYM either through stock ownership, options, or other derivatives. I wrote this article myself, and it expresses my own opinions. I am not receiving compensation for it (other than from Seeking Alpha). I have no business relationship with any company whose stock is mentioned in this article.
Additional disclosure: I am not a registered investment advisor or broker/dealer. Readers are advised that the material contained herein should be used solely for informational purposes, and to consult with their personal tax or financial advisors as to its applicability to their circumstances. Investing involves risk, including the loss of principal.