AOR: Global 60/40 Attractive On Valuation And Yield With One Key Technical Price Level

Summary
- The U.S. 60/40 endured its 2nd-worst annual real loss since 1950 last year.
- Today, valuations are better across the global equity and fixed-income landscape, and I see AOR as a buy.
- But the $51 price point is key for the bulls and bears to watch.
iQoncept
The U.S. 60/40 stock/bond portfolio returned a dreadful –16% last year. It was the worst annual performance since 2008’s -20% total return. Making the decline worse was a high 7% inflation rate which puts 2022’s loss worse on a real basis compared to that of 2008, and the second-worst annual dip since at least 1950 after inflation.
The global 60/40 did not fare much better. The AOR ETF tracks the global stock and bond markets with an allocation approach, and I see improving technical trends.
What's more, much more reasonable current forward P/E ratios, around 15 for a broad global stock fund, and higher starting bond yields, above 4% for aggregate fixed income, make the global 60/40 allocation much more attractive today. So, 2022's pain should lead to 2023 (and beyond) gain for a fund such as AOR.
U.S. 60/40: 2022's Stock/Bond Rout
J.P. Morgan Asset Management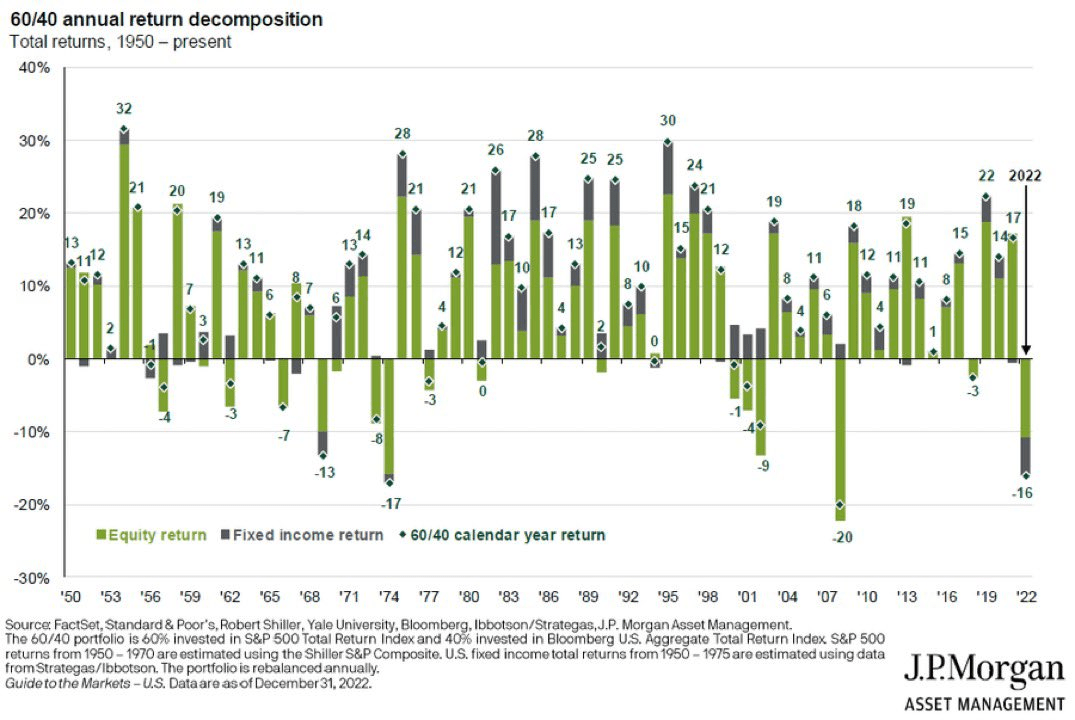
According to the issuer, the iShares Core Growth Allocation ETF (NYSEARCA:AOR) is meant to help investors build a diversified core portfolio focused on growth using one low-cost fund. AOR uses iShares ETFs to construct a portfolio that tracks a 60/40 stock/bond asset allocation strategy with a focus on growth and a target risk level.
AOR carries a 0.15% annual net expense ratio which is low compared to many other funds, and attractive considering the diversification with some often higher-cost areas like international fixed income and emerging markets. AOR has net assets of nearly $2 billion with a 30-day median bid/ask spread of just two basis points. The 30-day average volume is decent at more than 200,000 total shares, so overall tradeability is strong in my opinion.
The ETF holds just 7 positions while its 12-month trailing yield is not particularly impressive at 2.06% as of February 28, 2023. With a standard deviation of under 14%, volatility is much less than a traditional equity ETF even with recent turmoil and wild swings compared to history in the U.S. and foreign bond markets. The equity beta is 0.63, which is a useful gauge for risk-conscious investors and current AOR holders to compare daily movements in AOR versus the broad stock market.
Digging into the portfolio, Morningstar’s x-ray finds that 35% of AOR is comprised of U.S. equities with 27% spread across the non-U.S. market. The balance of the fund is in bonds with 33% in the domestic fixed-income market, and 6% in foreign fixed income with just a small allocation to cash. The equity slice of AOR is in the large-cap blend part of the Style Box and its P/E ratio is attractive at just 15 compared with long-term earnings growth north of 10%. Given the balance across market caps and regions, the fund is not as expensive compared to the S&P 500, which I like.
AOR Equity Portfolio Profile
Morningstar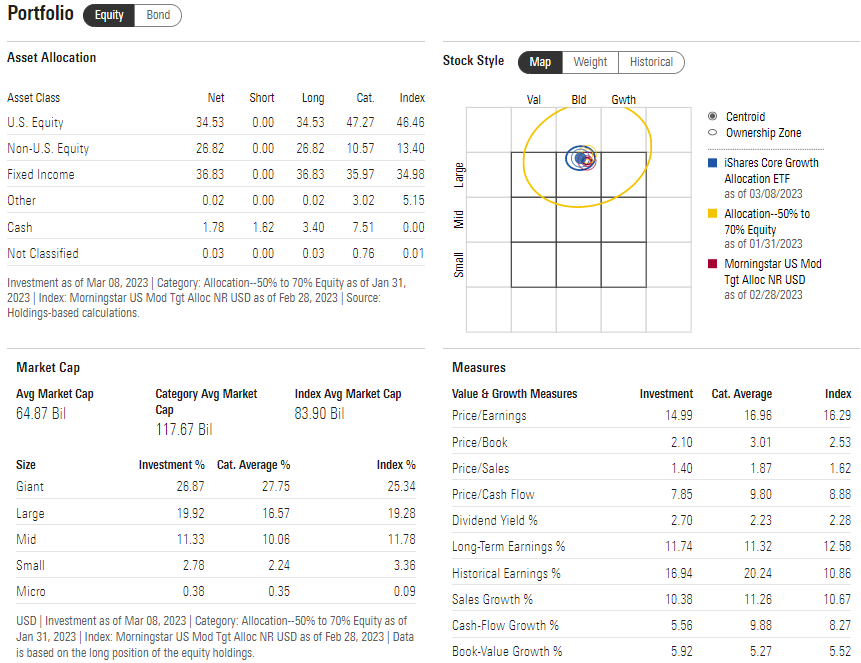
AOR: Top Holdings
iShares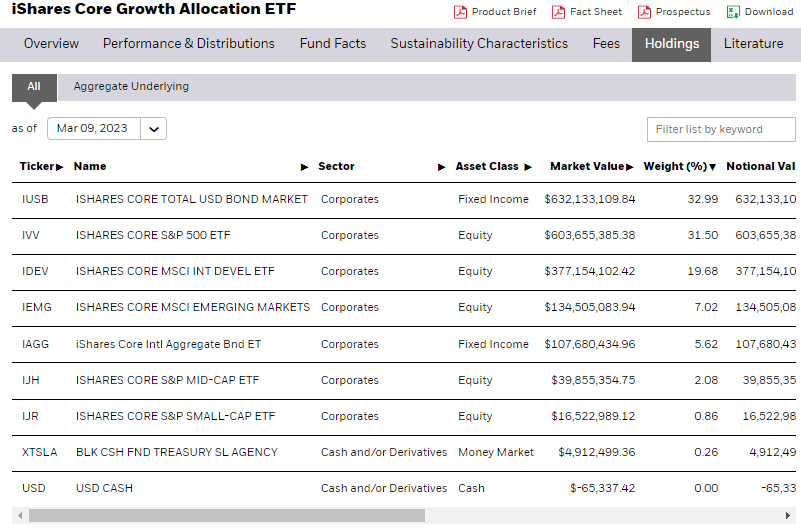
In its 14-year history, AOR tends to rally starting in mid-March through April before consolidating in May and June, according to data from Equity Clock. So, the trend currently is bullish.
AOR: Bullish Seasonal Trends
Equity Clock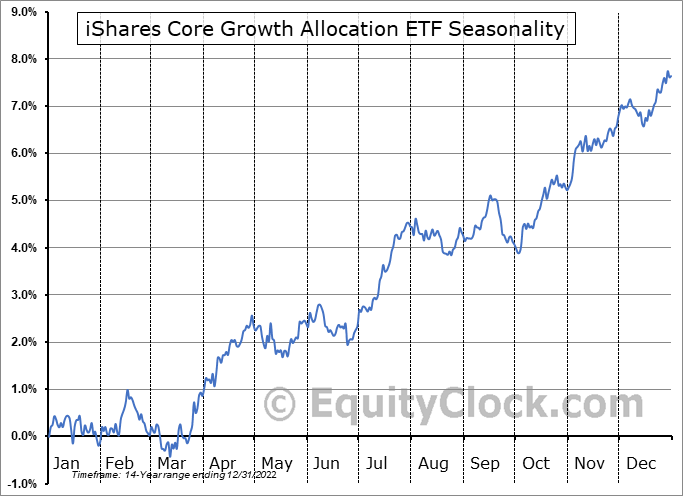
The Technical Take
With a good long-term valuation and better yields in the fixed-income market, does the chart suggest now is a good time to buy? I see some green shoots, but also a key resistance area. Notice in the chart below that AOR paused at $51 in early February – that's where the ETF met sellers in June and August last year. A rally above $51 would yield a measured move price objective to $58.50 based on a potential bullish inverse head and shoulders bottom. It is key for AOR to hold the $46 to $47 zone during this current pullback. Also, the 200-day moving average has flattened out after declining, and the latest share price rests right on that line – AOR failed initially at rallying above the 200dma in December. Overall, the technical picture is encouraging to me given the break of the downtrend, but more work is needed to confirm a breakout.
AOR: 2022 Downtrend Broken, Eyeing $51 Resistance
Stockcharts.com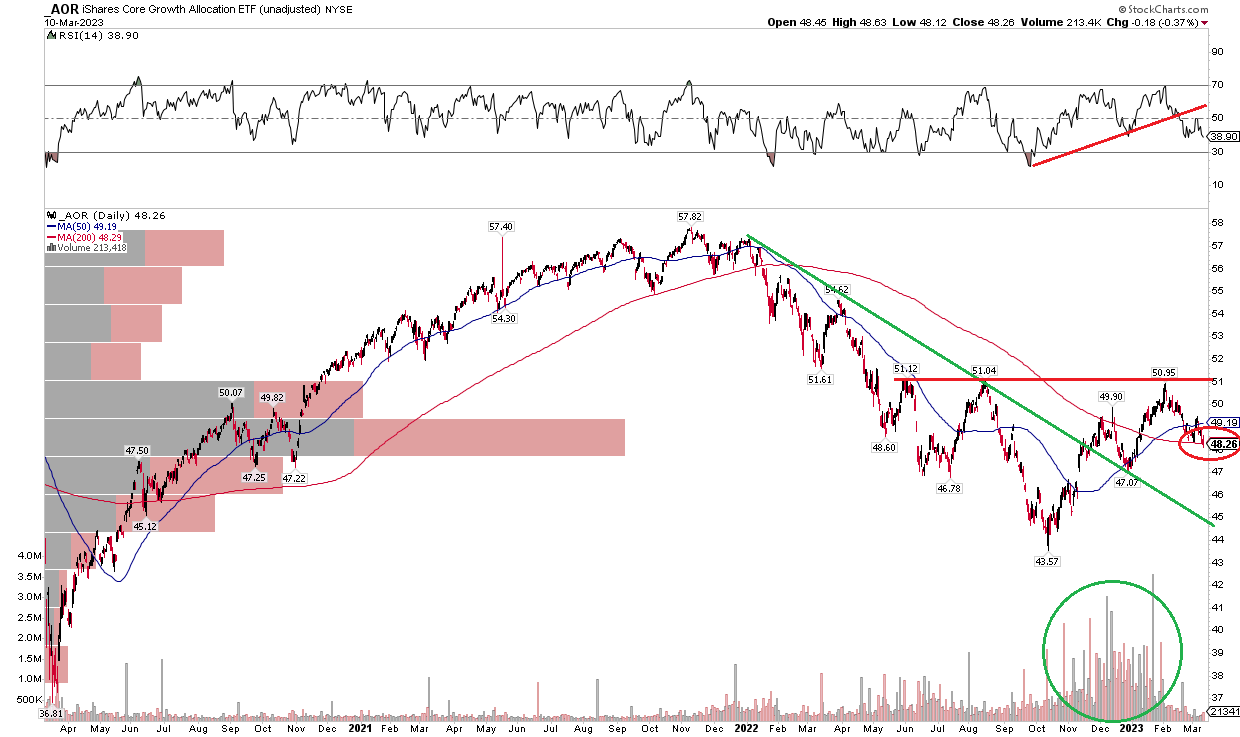
The Bottom Line
I am a buy on AOR here. I like the equity valuation and better bond yields across the global markets. The chart still has some work to do, but the 2022 downtrend line has been broken. Now we just need a move above $51.
This article was written by

Disclosure: I/we have no stock, option or similar derivative position in any of the companies mentioned, and no plans to initiate any such positions within the next 72 hours. I wrote this article myself, and it expresses my own opinions. I am not receiving compensation for it (other than from Seeking Alpha). I have no business relationship with any company whose stock is mentioned in this article.