There Is No Mystery In Why Recession Is Delayed

Summary
- Recession is not delayed, it was prematurely expected.
- Markets have placed too much emphasis on nominal data.
- Fed policy has been and CONTINUES TO BE stimulative, NOT restrictive.
- Political pressure has prodded the Fed to provide confusing communication.
- Recession is coming - soft-landing is not.
primeimages/iStock via Getty Images
One arrow
Two arrows
Red arrow
Blue arrow
Nominal or real fed funds? Choose wisely! (Haver Analytics and FAO Economics)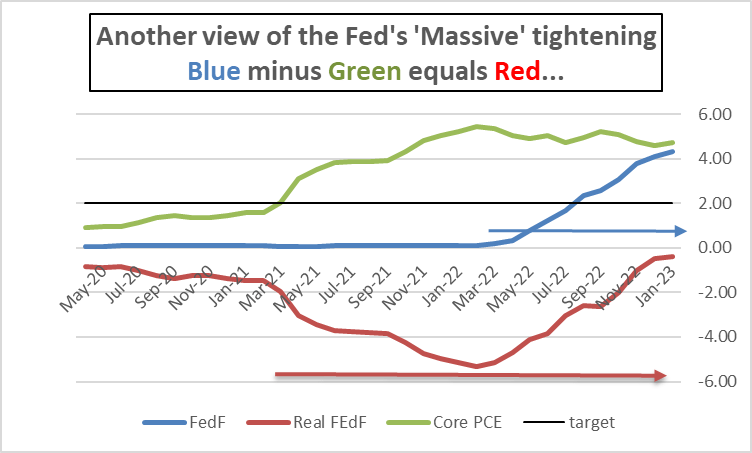
The chart above contains the essential information to explain why so many people have been expecting a recession sooner than they should. That, in turn, explains why the recession is delayed. The recession is not delayed as much as it was simply expected to arrive before it could get here. And that's not surprising because there are so many confusing things going on in the economy, including Fed communication. But once we are afforded the opportunity to look back through the rearview mirror, history shows the development of the pertinent factors that simply make the process seem much clearer.
The chart above is about as simple as they come. It plots the year-over-year core PCE inflation rate, it plots the federal funds rate level, and it plots the real fed funds rate level (which is the federal funds rate with the inflation rate subtracted from it). The Fed's 2% target is delineated by a thin black line. And I have placed two arrows on the chart. The red arrow depicts the time when the real fed funds rate began getting much more seriously negative. The blue arrow begins as the Fed starts to tighten policy and progresses through this nominal tightening process.
One thing that should be immediately evident is that the blue arrow and the red arrow overlap on the timeline…oops. Each of the events they chronicle occurs during some of the same time periods. This is one of the main reasons for there being confusion about Fed policy, what it is, and when it will take effect.
When will recession come?
The Blue Arrow: For those trying to pin down the timing of the recession, for the most part, there's been focus on the blue time series. The blue time series during the period of the blue arrow that chronicles the Fed raising interest rates. People look back at this. That is now about a year old, and they wonder after these incredibly strong clustered and focused increases in the federal funds rate how could the economy still be so strong? Looking at the problem this way creates confusion.
The Red Arrow- But looking at the red arrow completely redefines the issue. The red series is the real fed funds rate. The level of the nominal federal funds rate relative to inflation; that’s its net value in real terms. This has been the basic metric to evaluate monetary policy for quite a long period of time, more than just the time that we show for data back to 1960 - much longer than that. The red line says that the time to begin waiting has not yet begun- not begun…
Real interest rates- Economists realize that if you raise interest rates to say 10% but if inflation is running at 20% that's not going to be restrictive- but a 10% interest rate sounds high. In reality, if people can borrow money at 10% and then sell goods whose prices go up by 20% they'll do that all day long. Of course, that's a more dramatic example than what we have going here, but that's essentially what we have had going here since the inflation rate for over a year continued to move higher and higher and has held above the interest rate – a negative real fed funds rate.
The real rate in this cycle- The red line measures that gap and that reached its greatest breadth in February at -5.34%. This chart focuses on this current cycle; it does not go back to 1960 but if it did you would see that the 14 lowest monthly real fed funds rates over that broad span lie in this cycle. The reason that the economy is not going into recession on the schedule that seems to be laid out by the blue arrow is because the blue arrow is trumped by the red arrow. And as you can see, even with the blue arrow still moving forward and the nominal Fed funds rate still rising the real fed funds rate is still below zero; that means it's still stimulative. The contractive process has not yet BEGUN let alone reached a point of biting. Monetary policy has not crossed the Rubicon from stimulus to restriction. For people who watch the red line there is still no reason to be counting the time until recession comes. This is an extremely important observation.
Caveat!- Certainly, some readers are going think… ‘hey wait a minute…’ rates are higher and mortgage rates are a lot higher and housing has been blasted. Okay… true enough. Housing was in a bubble and piggybacking on super stimulative low financing rates that also spurred house prices. With the Fed funds rate more neutrally positioned, mortgages lost their low ground and housing affordability has dived as a result. You can consider this a monetary policy effect (which it is in part…) but it is mostly a return to more sane, sober, and sustainable financing rates. The industry does feel the shock. Auto loans have had some of the same issues as some automakers were offering zero-rate financing before the Fed began moving rates up.
Political pressure…to do the WRONG thing- The Fed Chairman had just gotten done testifying before the House and Senate financial/banking committees and before each of these committees he received some very aggressive and hostile questioning from Democrat members of the committees about how aggressive the Fed rate hikes have been. Elizabeth Warren, who actually knows better and understands economics, pointedly asked Mr. Powell how many people he intended to put out of work in his pursuit to reduce inflation. Representative Pressley followed that line of thinking when the testimony moved from the Senate Banking Committee to the House Financial Services committee. But as our charts show the Fed is not even on a path of restrictiveness yet. Still, the political pressure has welled up and is quite intense. Not surprisingly political figures are wedded to nominal figures rather than looking at metrics that adjust for the effects of inflation.
Got lags?- I have been arguing that if monetary policy works with a lag then we would expect there to be a lag when the Fed runs a very stimulative policy as well as when it runs a program of policy tightening. Look at the blue arrow, look at the red arrow. We are still in a period in which monetary policy is stimulative we have not yet started the clock on Fed policy being restrictive – except in sectors that had gotten out too far over their own skis in the low-rate period…The lags from the stimulative policy are still in force.
Does Money matter? If so What’s-a-matter?
There's another matter we can look at that offers some insight on this: that is the growth rate of money supply, M2. You see that on the chart below.
Monetary behavior has become extreme!! (Haver Analytics and FAO Economics)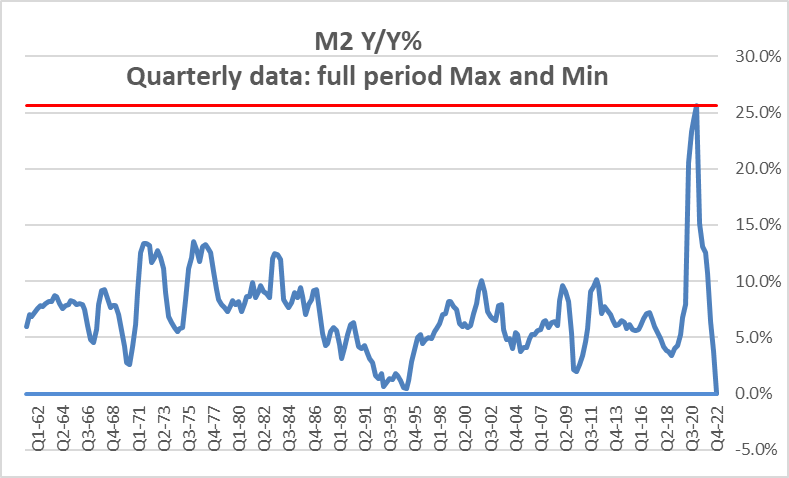
This is a quarterly chart that looks at year-over-year growth in M2. I have highlighted this chart by plotting the full sample maximum and minimum growth rates with the maximum represented by a red line and the minimum represented by a blue line. Once again, interestingly, both the maximum and the minimum draw from our current cycle! Just as we saw earlier, the 14 lowest real fed funds rates have occurred in this cycle. Now we discover that the strongest M2 money growth has occurred in this period as well. And the strongest money growth is separated by seven quarters from the weakest money supply growth that we've had over this entire period stretching back to the early 1960s. How about that! So are we under the spell of excess expansion or of record contraction?
So just as we saw with real and nominal interest rates we see with money growth; money growth has gone from a huge boom to a huge bust. The sharp slowdown of money growth is reason enough to worry whether the economy is headed for recession. On monthly data we are looking at the first year-over-year decline in the money stock since at least the 1960s and certainly further back than that. But what about the impact of the boom?
We can talk about the lags in monetary policy in different ways; we can look at real interest rates and talk about the lags; we can look at money growth and talk about the lags. It should be clear from our chart on money growth that the lags from the boom are going to start to overlap with the lags from the bust. And that's going to make it very difficult to pin down how these lags are going to affect the economy and when they will cause recession to occur.
To understand these forces a little bit better I have plotted the ratio of M2 to GDP on the chart below. What it shows is that there has been a sharp run up in the growth of money compared to the growth of GDP. Some of you may recognize this as a flipped over chart of monetary velocity; that's correct. What I want to explore with this chart is the question of where is money supply relative to GDP? Putting things in growth rate terms, what we see is an excessive burst of money growth and then a surprising decline in the growth rate to abject quarterly flatness. The question is once we follow that path where are we with money growth on balance? For example the boom comes after a period that was otherwise relatively normal although we see on the chart that the ratio of money to the GDP had actually been rising for some time. But the period of the bust in money growth may not be quite the same as other periods when money supply went through a bust because we're getting a bust after a boom which suggests that this is ‘just’ the boom unwinding. So maybe rather than being a bust it's an un-boom? (if you'll permit me to torture the English language a little bit).
M2 relative to trend (Haver Analytics and FAO Economics)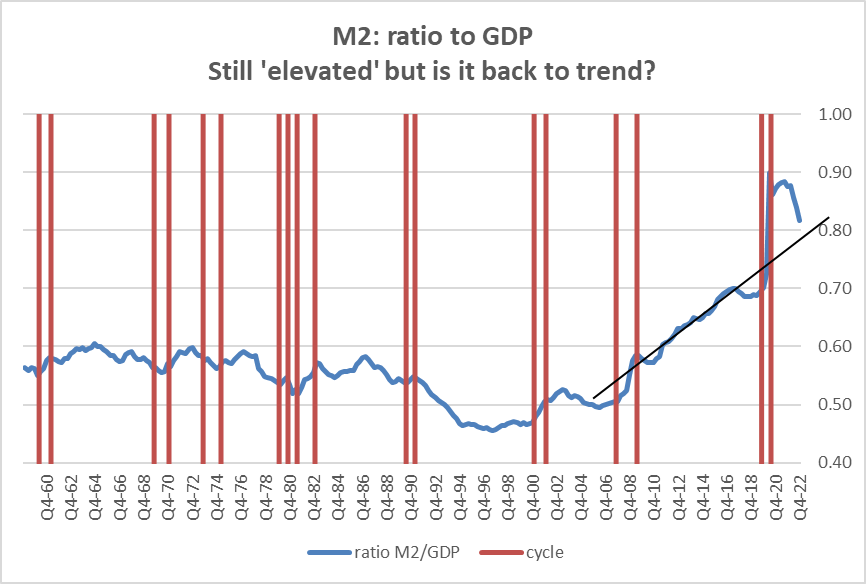
The chart suggests that the current bust in money growth hasn't quite brought us back down to the past rising trend after we experienced the boom but clearly we're closer to being on trend. So if money growth went through this terrible perturbation does that matter if we wind up back at trend? I think the answer to this is ‘yes’ and I think most economists would be pretty upset with the boom and the bust behavior of money stock in this cycle. At the same time I also think that the bust coming after the boom imbues the bust with a different character than if it occurred on its own without being preceded by a boom.
In the end…
In the end, interestingly, we get the same signals from money supply that we get from real interest rates. Real interest rates have gone through their gyrations but right now they're actually back near neutral. Money supply growth has boomed and busted but now it's basically back on (or close to) its trend, at least its trend ratio to GDP.
So far all of this has been a discussion and a description of how monetary policy has behaved either looking at interest rates real interest rates or money supply growth or the ratio of money the GDP and I really haven't said anything about inflation itself. But, of course, we have inflation. And inflation clearly has an important international and geopolitical component. We see the war going on between Russia and Ukraine we see inflation high around the world - even Japan has managed to have some inflation after a long period of not being able to have any at all. And while we know monetary policy has been excessive and stoked inflation along with fiscal policy, the inflation rate in the United States doesn't appear to be out of line with the inflation that we're seeing in other major developed countries. In Europe inflation is worse...
Does the international nature of inflation trump domestic mismanagement?
This is the reason why some Democrats have become so hostile against the Fed Chair, arguing that inflation is essentially an exogenous event because it's occurred every place and that you can't blame Joe Biden and his fiscal policy for it - or Donald Trump's fiscal policy before that. They argue that since monetary policy didn't cause inflation leaning on monetary policy to solve the problem is not going to be the right solution. And while that makes for a nice sound bite it isn't logically or economically correct.
During the first oil shock in the early 1970s we had a global inflation and the US managed the situation very badly while West Germany managed it quite well. Even when there's a global inflation shock domestic policy can either act to blunt it, ignore it, or exaggerate it. One clear role of monetary policy in this situation is to keep the inflation that is too high from becoming part of a wage price spiral and making the inflation process worse.
A recent paper delivered at a University of Chicago Booth Business School conference in New York concluded that the Federal Reserve had never contained and reduced a substantial inflation rate without the economy experiencing recession. That paper joins the concept of the Fed controlling inflation, raising interest rates, and recession in a tidy but uncomfortable bundle. Under pressure in his testimony last week Fed Chair Powell reassured everyone that the Fed’s goal is not to create recession. But the Fed's goal is to cool aggregate demand and one side-effect of cooling aggregate demand is creating unemployment and when you cool aggregate demand and create an employment the likelihood is that you create recession…but it's not the objective.
The state of policy art
So this is the state of technology for economics. Policy slows aggregate demand and that brings supply and demand back into balance and it reduces the inflation rate, however, the side effect is that it creates unemployment and the economy likely falls into recession. Of course, there are some missing ingredients here… modern central bankers also believe in credibility and expectations, thinking if central bankers can set those right they can push through to success. What is unclear in looking at history is whether it's possible for the Fed to raise rates and to damp aggregate demand to control inflation but not so much that it creates substantial unemployment and recession. Can setting expectations solve that dilemma? I'm sure that someone can fiddle with an econometric model and show that it can be done, but the real question is whether it can be done by mortal individuals running policy in real time. I'm skeptical of that.
At the end of 2021 I was writing about the inevitability of recession. There were no particular economic statistics that had gone off the beaten track like the leading economic index or anything like that. I was simply observing some extraordinary relationships that were coexisting in markets. They didn't seem reasonable to me and suggested that they would only be brought back into alignment by having a recession. The main three things that I observed were (1) that the Fed funds rate was extremely low, (2) the inflation rate had risen extremely high, and (3) the 10-year note yield seemed nonetheless to be comfortable and low at around 3% well below the pace of inflation. I could probably be satisfied with any two of those characteristics, but not with all three of them together. And I doubted that expectations really explained that behavior and - if they did - I doubted that they were correctly set.
I began thinking that there was going to have to be some kind of a significant change in policy to get control of inflation that the bond market did not seem to appreciate. For a long time, the Fed did not appreciate it either, as the Fed continued to push out forecasts that had minor increases in the federal funds rate and had inflation coming down all by itself without much Fed action. This led me to brand the fed funds rate as ‘the magic fed funds rate.’ A sort of monetary counterpart to the neutron bomb that killed people but left buildings intact. The Fed’s new weapon killed inflation leaving unemployment intact. What was I doing when the Fed discovered this?? Apparently, I was not drinking enough…
Now we see events shifting.
- The leading indicators are forecasting a significant slowdown or recession in the economy.
- The yield curve is now deeply inverted forecasting what some say will be a more treacherous recession than what's being expected.
- Job growth, however, has been much stronger than we imagined. Even so a lot of people have left the labor market and the market is tight and the quit rate is high and wages continue to rise even though real wages continue to be eroded. Here we see the impact of ongoing monetary stimulus.
Recession ho!
I still have no doubt that recession is coming. However, I think it's very hard to pin down the date because of the complications that I outlined above. And I think part of it is because of Fed communication. The Fed continues, perhaps for political reasons, but it continues to talk about soft-landings. And, where we can measure inflation expectations even out to five years, they appear to be relatively well behaved for the most part. That has encouraged the Fed to think that it's still in control and doing a good job. But is that a reliable metric? As low as they are, inflation expectations are still among some of the highest values we have seen in recent years…So beware how you interpret them.
Since 2015 there's very little the Fed has done that I would consider to be a ‘good job.’ Its ‘bygones’ policy begun in 2015 was a mistake. Its adoption of a new pro-labor operating framework was a disaster. I think that is where the Fed began to get itself into real deep trouble by claiming that it would emphasize control and deliver full employment in the short run, in addition to price stability. Perhaps monetary policy has learned its lesson that the Monetary Authority can't have its cake and eat it too. But then I thought we knew that years ago. Sigh!
This article was written by

Disclosure: I/we have no stock, option or similar derivative position in any of the companies mentioned, and no plans to initiate any such positions within the next 72 hours. I wrote this article myself, and it expresses my own opinions. I am not receiving compensation for it (other than from Seeking Alpha). I have no business relationship with any company whose stock is mentioned in this article.