Farmers & Merchants Bancorp: Attractively Valued But Earnings Likely To Be Flattish

Summary
- Regional economic factors will likely sustain organic loan growth this year.
- Loan additions and re-pricing of existing loans will lift the margin. However, the recent deterioration of the deposit mix will curtail the margin’s growth.
- The December 2023 target price suggests a high upside from the current market price. Further, FMAO is offering a moderate dividend yield.

halbergman
Earnings of Farmers & Merchants Bancorp, Inc. (NASDAQ:FMAO) will likely remain flattish this year as a surge in operating expenses will counter the effect of topline growth. Overall, I’m expecting the company to report earnings of $2.41 per share for 2023, down 2% year-over-year. Compared to my last report on the company, I’ve reduced my earnings estimate as I’ve raised my non-interest expense estimate. The year-end target price suggests a high upside from the current market price. Therefore, I’m upgrading Farmers & Merchants Bancorp to a buy rating.
Loan Growth Likely to Slow Down After a Remarkable Year
The loan portfolio surged by 10% in the last quarter of 2022 thanks to the acquisition of Peoples-Sidney Financial Corporation. Around half of the quarter’s growth came through organic means, which is quite impressive considering the company’s organic growth has been lackluster in the past. Organic growth has hovered around the low to mid-single-digit range in the last few years, excluding 2022.
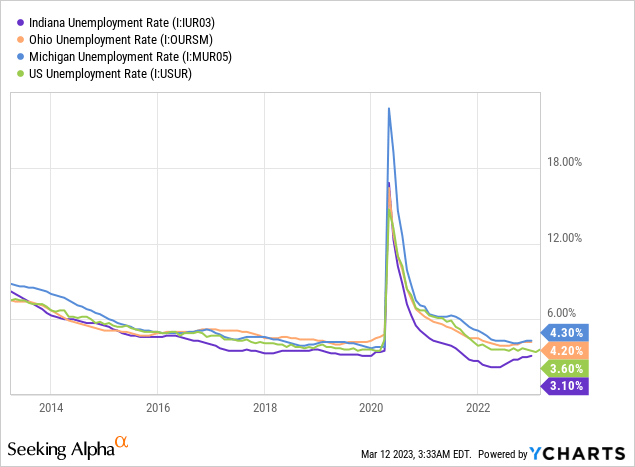
Farmers & Merchants Bancorp operates in Ohio, Indiana, and Michigan. Further, the loan portfolio is well diversified among different segments, including commercial real estate, consumer real estate, and agriculture. Therefore, the regional unemployment rates and agricultural commodity prices are key indicators of credit demand. As shown below, Indiana currently enjoys an unemployment rate that is not only low when compared to the national average but also when compared to its past. Ohio and Michigan, unfortunately, have higher unemployment rates than the national average. But their unemployment rates too are very low in a historical context.
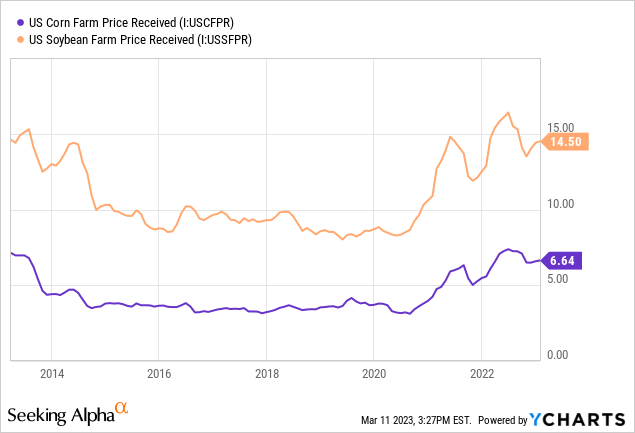
As shown below, agricultural commodity prices are still very high despite the downtrend in the second half of last year.
Due to the factors mentioned above, I’m positive about organic loan growth. However, Farmers & Merchants Bancorp focuses more on acquired growth than organic growth. The company’s organic loan growth has been lackluster in the past, which shows that organic growth is not the management’s area of strength. Further, the high-interest rate environment will curb the demand for credit products.
Overall, I’m expecting the loan portfolio to grow by 4% in 2023. As there are no pending M&A transactions, I have excluded growth through acquisitions from my projection. Further, I’m expecting deposits to grow in line with loans. The following table shows my balance sheet estimates.
| Financial Position | FY18 | FY19 | FY20 | FY21 | FY22 | FY23E |
| Net Loans | 840 | 1,212 | 1,289 | 1,841 | 2,336 | 2,431 |
| Growth of Net Loans | 2.9% | NA | 6.4% | 42.8% | 26.9% | 4.1% |
| Other Earning Assets | 178 | 238 | 404 | 502 | 407 | 424 |
| Deposits | 929 | 1,288 | 1,596 | 2,193 | 2,469 | 2,569 |
| Borrowings and Sub-Debt | 32 | 73 | 48 | 128 | 226 | 235 |
| Common equity | 143 | 230 | 249 | 297 | 298 | 308 |
| Book Value Per Share ($) | 15.6 | 20.9 | 22.5 | 25.7 | 22.8 | 23.5 |
| Tangible BVPS ($) | 15.2 | 16.6 | 18.2 | 18.7 | 16.2 | 16.9 |
| Source: SEC Filings, Earnings Releases, Author's Estimates(In USD million unless otherwise specified) | ||||||
Subdued Margin Expansion Likely in 2023
Farmers & Merchants Bancorp’s net interest margin dropped by 29 basis points in the last quarter partly because of the acquisition of Peoples-Sidney Financial. Going forward, the margin will resume its upward trend on the back of the ongoing up-rate cycle. The results of the management’s rate-sensitivity analysis given in the 10-K filing show that a 200-basis points hike in rates can increase the net interest income by 3.14% over twelve months.
Apart from the repricing of loans, the anticipated new loans will also raise the margin as they will originate at higher rates than the average portfolio yield.
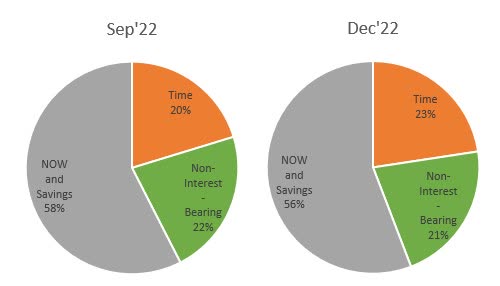
On the other hand, recent changes in the deposit composition will hurt the margin. The deposit mix worsened over the fourth quarter of 2022 as the proportion of low-cost deposits declined and the proportion of high-cost time deposits rose (see below). The full-quarter impact of this mix shift will be visible in the first quarter of 2023.
SEC Filings
Considering these factors, I’m expecting the margin to increase by only ten basis points in 2023.
Raising the Operating Expense Estimate and Reducing the Earnings Estimate
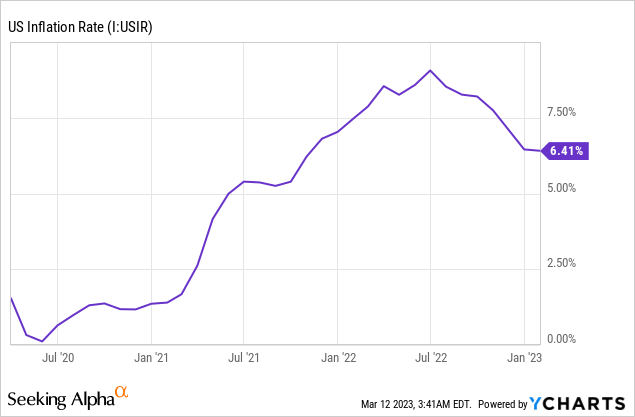
The anticipated loan growth and margin expansion will support earnings this year. On the other hand, an inflation-driven rise in non-interest expenses will drag earnings. Further, the tight labor markets will raise salary expenses. In my last report, which was issued in December, I estimated non-interest expenses of $62 million for 2023. Since then, disinflation has slowed down, as shown below. Therefore, I’ve decided to raise my non-interest expense estimate to $69 million.
Overall, I’m expecting Farmers & Merchants Bancorp to report earnings of $2.41 per share for 2023, down by 2% year-over-year. The following table shows my income statement estimates.
| Income Statement | FY18 | FY19 | FY20 | FY21 | FY22 | FY23E |
| Net interest income | 40 | 54 | 60 | 69 | 87 | 98 |
| Provision for loan losses | 0 | 1 | 7 | 3 | 5 | 5 |
| Non-interest income | 11 | 12 | 17 | 18 | 16 | 17 |
| Non-interest expense | 32 | 41 | 44 | 54 | 57 | 69 |
| Net income - Common Sh. | 15 | 18 | 20 | 23 | 32 | 32 |
| EPS - Diluted ($) | 1.61 | 1.66 | 1.80 | 2.01 | 2.46 | 2.41 |
| Source: SEC Filings, Earnings Releases, Author's Estimates(In USD million unless otherwise specified) | ||||||
In my last report on Farmers & Merchants Bancorp, I estimated earnings of $2.69 per share for 2023. I’ve reduced my earnings estimate mostly because I’ve raised my non-interest expense estimate.
My estimates are based on certain macroeconomic assumptions that may not come to fruition. Therefore, actual earnings can differ materially from my estimates.
Upgrading to a Buy Rating
Farmers & Merchants Bancorp has been hiking up its dividend at least once a year since 2018. Considering this trend and the earnings outlook, I’m expecting the company to raise its quarterly dividend to $0.22 per share in the first quarter of 2023. The earnings and dividend estimates suggest a payout ratio of 36.5% for 2023, which is in line with the five-year average of 36%. Based on my dividend estimate, Farmers & Merchants Bancorp is offering a forward dividend yield of 3.9%.
I’m using the historical price-to-tangible book (“P/TB”) and price-to-earnings (“P/E”) multiples to value Farmers & Merchants Bancorp. FMAO stock has traded at an average P/TB ratio of 1.52x in the past, as shown below.
| FY20 | FY21 | FY22 | Average | |
| T. Book Value per Share ($) | 18.2 | 18.7 | 16.2 | |
| Average Market Price ($) | 23.2 | 24.2 | 32.1 | |
| Historical P/TB | 1.27x | 1.29x | 1.98x | 1.52x |
| Source: Company Financials, Yahoo Finance, Author's Estimates | ||||
Multiplying the average P/TB multiple with the forecast tangible book value per share of $16.9 gives a target price of $25.7 for the end of 2023. This price target implies a 13.2% upside from the March 10 closing price. The following table shows the sensitivity of the target price to the P/TB ratio.
| P/TB Multiple | 1.32x | 1.42x | 1.52x | 1.62x | 1.72x |
| TBVPS - Dec 2023 ($) | 16.9 | 16.9 | 16.9 | 16.9 | 16.9 |
| Target Price ($) | 22.3 | 24.0 | 25.7 | 27.4 | 29.1 |
| Market Price ($) | 22.7 | 22.7 | 22.7 | 22.7 | 22.7 |
| Upside/(Downside) | (1.8)% | 5.7% | 13.2% | 20.6% | 28.1% |
| Source: Author's Estimates |
The stock has traded at an average P/E ratio of around 12.6x in the past, as shown below.
| FY20 | FY21 | FY22 | Average | |||
| Earnings per Share ($) | 1.80 | 2.01 | 2.46 | |||
| Average Market Price ($) | 23.2 | 24.2 | 32.1 | |||
| Historical P/E | 12.8x | 12.0x | 13.0x | 12.6x | ||
| Source: Company Financials, Yahoo Finance, Author's Estimates | ||||||
Multiplying the average P/E multiple with the forecast earnings per share of $2.41 gives a target price of $30.4 for the end of 2023. This price target implies a 34.1% upside from the March 10 closing price. The following table shows the sensitivity of the target price to the P/E ratio.
| P/E Multiple | 10.6x | 11.6x | 12.6x | 13.6x | 14.6x |
| EPS 2023 ($) | 2.41 | 2.41 | 2.41 | 2.41 | 2.41 |
| Target Price ($) | 25.6 | 28.0 | 30.4 | 32.8 | 35.2 |
| Market Price ($) | 22.7 | 22.7 | 22.7 | 22.7 | 22.7 |
| Upside/(Downside) | 12.9% | 23.5% | 34.1% | 44.7% | 55.3% |
| Source: Author's Estimates |
Equally weighting the target prices from the two valuation methods gives a combined target price of $28.0, which implies a 23.6% upside from the current market price. Adding the forward dividend yield gives a total expected return of 27.5%.
In my last report on Farmers & Merchants Bancorp, I adopted a hold rating with a December 2023 target price of $30.4. Since then, the stock price has plunged, leaving a large price upside. Based on the updated total expected return, I’m upgrading Farmers & Merchants Bancorp to a buy rating.
This article was written by

Disclosure: I/we have no stock, option or similar derivative position in any of the companies mentioned, and no plans to initiate any such positions within the next 72 hours. I wrote this article myself, and it expresses my own opinions. I am not receiving compensation for it (other than from Seeking Alpha). I have no business relationship with any company whose stock is mentioned in this article.
Additional disclosure: Disclaimer: This article is not financial advice. Investors are expected to consider their investment objectives and constraints before investing in the stock(s) mentioned in the article.