The Retirees' Dividend Portfolio: John And Jane's February 2023 Taxable Account Update

Summary
- The Taxable Account generated $1,850.78 of dividend income for February 2023 compared with $1,493.49 of dividend income for February 2022.
- The Taxable Account had a balance of $533.4K as of February 28, 2023, vs. $530.1K on February 28, 2022. The annualized cost basis yield is 5.23%.
- Four companies in the Taxable portfolio paid increased dividends or paid a special dividend during the month of February.
- The Taxable Account had a cash balance of $17.7K as of February 28, 2023, vs. $39.9K as of February 28, 2022. The 2023 cash balance does not include $20K in CDs.
- The Taxable Account had an unrealized gain/loss of $109.8K as of February 28, 2023, vs. $111.8K as of February 28, 2022.
As promised, this article will start by introducing the Watchlist section. Keep in mind that this is something I recently created over the last few weeks and the list is not exhaustive but I am designing it so that ticker symbols can be easily changed (remove existing or add new ones) with conditional formatting that makes it easier to identify prospective investments.
My ask for those reading is to provide feedback in the comment section and if there is specific interest as to why a certain company makes the list it would be great to further the conversation or give me something to add in the next update of the Watchlist.
One thing I haven't added yet is a column that gives a buy range with prices that I will update regularly.
marekuliasz
Watchlist
When designing the Watchlist I had a few criteria in mind that I thought would assist readers in understanding my logic and what signs I am looking for before adding to an existing position or initiating a new position.
- Price
- 52-Week Low
- % Above 52-Week Low
- 52-Week High
- % Below 52-Week High
- Dividend Yield (Forward)
- Five-Year Dividend Growth
- Payout Ratio
- P/E Ratio (For REITs it will be the P/FFO Ratio)
- YTD Performance
- Five-Year Performance
- Five-Year Total Return
- Ten-Year Performance
- Ten-Year Total Return
- Current Ratio
- Long-Term Debt To Total Capital
The metrics above aren't the only things I use to determine if the stock is attractive but they are an excellent starting point to help you determine if more research is justified. By now you can probably notice that the emphasis here is to ask the following questions.
- Is the stock priced reasonably compared to historical standards, if not, what is the story about the stock that explains what is going on?
- What is the current yield? Is the stock price compared to the historical yield something we should consider attractive or is it overpriced relative to its historical yield?
- How is the company financially? Are they utilizing a comfortable amount of debt?
Obviously, there are other questions that can be asked but let's dig into some of these to better understand why these questions matter.
All images below are generated using data from the Seeking Alpha watchlist and are created under my Consistent Dividend Investor (CDI) name.
Reasonably Priced
Let's consider the concept of what it means to be reasonably priced.
When I am looking for stocks that present a higher likelihood of upside relative to the potential of future downside. Using the 52 WK High and 52 WK Low ranges we are able to see how close a share price is to its lowest or highest points over the last rolling year. To make it even easier, I have added conditional formatting that spans certain ranges to make it an even faster reference.
- The closer a stock price is to the 52 WK Low the higher probability that it is at a good value. This ALWAYS requires more research to determine if it really is a good value or if the company is falling apart at the seams.
- The closer a stock price is to the 52 WK High the lower the probability that it is a good value. This ALWAYS requires more research to determine if it really isn't a good value because it may be due to the company rapidly growing.
- Being that the primary focus is on dividend-paying stocks that are established it would be rare that we would include a company on this list that would fully meet the criteria of the 2nd bullet point.
Another key set of measurements is looking at the stock price performance relative to the total return metric. Stock price performance is important but when we are dividend investing and focused on creating sustainable cash flows the emphasis shifts to consistently growing dividends as a critical factor. The total return compared to the stock price will paint a picture of just how important the dividend is to the returns generated by a stock.
Watchlist - Reasonably Priced - 2023-3-8 (CDI)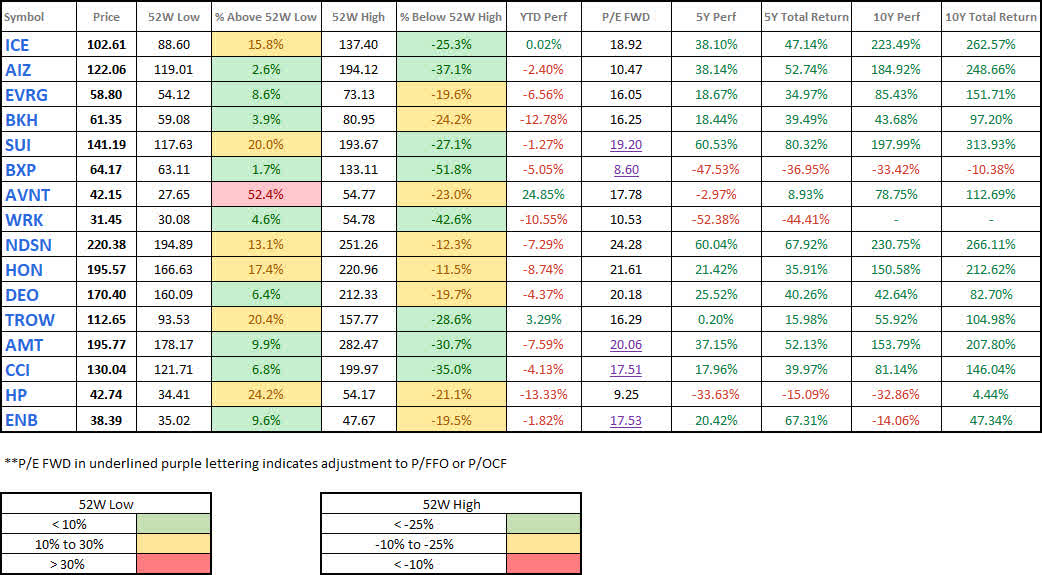
Dividend
One of my favorite metrics is to compare the current yield to the historical yield, and in this case, 4YR Avg Yield is the most readily available to use (but if something warrants additional research it is a great idea to open up the dividend tab in Seeking Alpha and look at the historical yield over a 10 year period because it can show some interesting trends).
- When the current yield is higher than the 4YR Avg Yield it indicates that the stock is potentially more attractive. This is especially true if the stock has strong dividend growth, a strong 5YR, and/or 10/YR Total Return and the payout ratio is reasonable.
- If the current yield is higher but the dividend growth metrics show it barely grown its dividend then this could mean that the company is struggling financially. I think a common area that this takes place is with companies whose yields are above-average because investors are potentially pricing in a dividend cut. Excellent examples of this would be VF Corp (VFC) and AT&T (T).
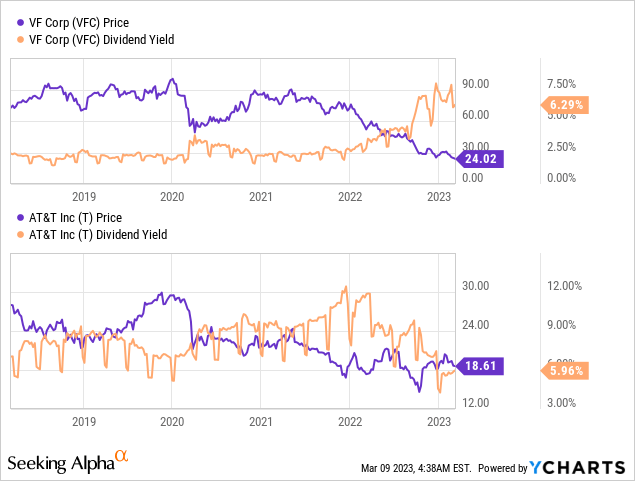
Consider the chart above. VFC began paying a dividend yield that was 3X larger than the normal yield seen over the last five years.
AT&T on the other hand reached that point at the end of 2021 when it slashed the dividend and spun off Warner Brothers (WBD). Since then, the dividend yield has moderated because the stock price has come up from a stock price low that has not been seen since the mid-1990s.
Watchlist - Dividend - 2023-3-8 (CDI)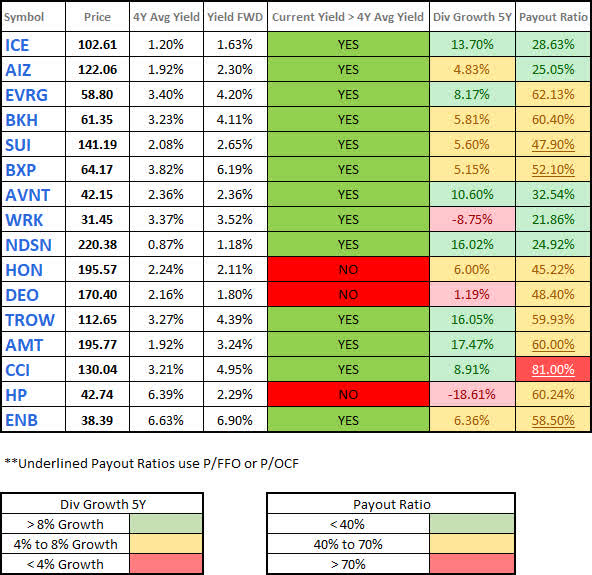
Debt
Looking at a company's debt profile and ability to meet short to long-term needs is a very important factor to consider. Companies that use debt appropriately can take advantage of acquisitions and various investment opportunities but companies that make poor decisions are likely to end up over-leveraged and at risk of underperformance, dividend cuts, etc.
I only have two metrics in this section so far (expect to see this section expand as these articles go on because there are other readily available metrics like debt to equity, interest coverage ratio, and other options that exist on Seeking Alpha that I haven't been able to fully review).
I believe that this section is going to become even more important moving forward because we are no longer in an interest-rate environment where cheap financing is readily available. This means that it will become even more important for companies to consider how they deploy capital.
Watchlist - Debt Metrics - 2023-3-8 (CDI)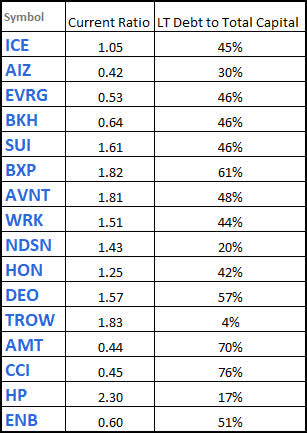
**I think it's important to remember that companies like REITs and pipelines are likely to have higher LT Debt to Total Capital ratios. Remember to take into consideration the business model before assuming that a higher debt to total capital is a bad thing.
Watchlist Conclusion
It is likely that I will spin the Watchlist section into its own article along with the trades made for that week. My goal is to make sure that these articles don't become a huge burden so that I can make sure to publish them regularly as I do with my normal John & Jane articles.
Background
For those interested in John and Jane's full background, you can find at least three articles a month published for the last five years detailing the performance of their portfolio. I have continued to evolve the report over time by adding and removing information/images to make the updates more useful to the average investor. Here are the key details that should be understood when reading these updates.
- This is a real portfolio with actual shares being traded. This is not a practice portfolio, so I include screenshots from Charles Schwab to document every change made.
- I am not a financial advisor and merely provide guidance based on a relationship that goes back several years.
- John retired in January 2018 and has collected Social Security income as his regular source of income. John also currently withdraws $1,000/month from his Traditional IRA.
- Jane retired at the beginning of 2021 and decided to begin collecting Social Security early and has not made any withdrawals from her retirement accounts yet.
- John and Jane began drawing funds from the Taxable Account in 2022 at $1,000/month. After speaking with them this amount has been increased to $1,700/month. This withdrawal is still covered entirely by dividend and interest income.
- John and Jane have other investments outside of what I manage. These investments primarily consist of minimal-risk bonds and low-yield certificates.
- John and Jane have no debt or monthly payments other than basic recurring bills such as water, power, property taxes, etc.
The reason why I started helping John and Jane with their retirement accounts is that I was infuriated by the fees they were being charged by their previous financial advisor. I do not charge John and Jane for anything that I do.
The only request I have made of John and Jane is that they allow me to publish their portfolio anonymously because I want to help as many people as I can while holding myself accountable and improving my thought process.
I started this series to address issues I have had when reading other authors with similar types of updates (I am not saying they are wrong but I found myself questioning their actual performance because they never provided enough information to cover loose ends.
Here is my promise to readers:
- I aim to give as much information as needed so readers can feel confident that what I do is real.
- Even if you agree the results are real this does not mean I expect you to agree with me and I will always answer constructive criticism whenever possible. I will respond with the same genuine intent that the question was asked with.
- I am very transparent about the portfolio and consistency is a significant goal of mine. All of my data points (unless noted otherwise) are derived from month-end statements from Charles Schwab. Even when things aren't looking great (Spring 2020 for example) you will know because I provide enough information that it would be impossible for me to manipulate.
- This article is not intended to be advice or a call to action and is for informational purposes only (I am not a financial advisor and I don't claim to be one). My goal is to challenge conventional thinking and empower you to take control of your investments (if that's something you want to do).
While many authors require paid subscriptions to see their portfolio I do not want to go that route and will continue to publish this series for free as long as there is enough interest to make it worth my time (and I spend A LOT of time on these articles).
Generating a stable and growing dividend income with an emphasis on capital preservation has become the primary focus of this portfolio. I am least concerned about capital appreciation which is why the decisions made will seem pretty conservative most of the time. I may measure the performance of the portfolio relative to indexes and ETFs but the key metric I am focused on is delivering a more stable source of cash flow to John and Jane over time that allows them to live a comfortable retirement that includes minimal stress related to finances.
Dividend Decreases
No companies in the Taxable account eliminated or reduced their dividend during the month of January.
Dividend Increases
Three companies paid increased dividends/distributions or a special dividend during the month of January in the Taxable Account.
- Carrier Global (CARR)
- Enterprise Products Partners (EPD)
- Energy Transfer (ET)
- Helmerich & Payne (HP)
Carrier Global - Since it’s been off from United Technologies (UTX) (which is now Raytheon), CARR has seen impressive price appreciation and was recently upgraded from $38/share to $53/share from Mizuho. Mizuho also “raised its EPS estimate for Carrier to $2.55 from $2.32 for 2023, and introduced an estimate of $2.80 for 2024.” These estimates are in line with what is shown in FastGraphs and support the likelihood that CARR will continue to increase its dividends at a strong pace.
At this point in time I think it would be wise for investors to wait for a pullback in price with the stock recently hitting its 52-week-high. I believe that the stock presents a very compelling value at $40/share or less.
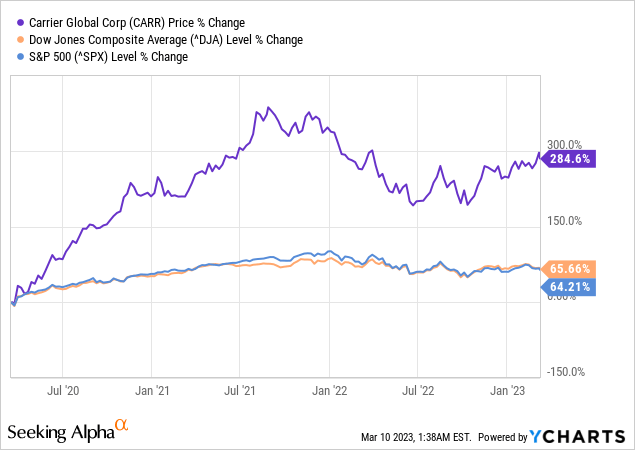
The dividend was increased from $.15/share per quarter to $.185/share per quarter. This represents an increase of 23% and a new full-year payout of $.77/share compared with the previous $.60/share. This results in a current yield of 1.56% based on the current share price of $46.15.
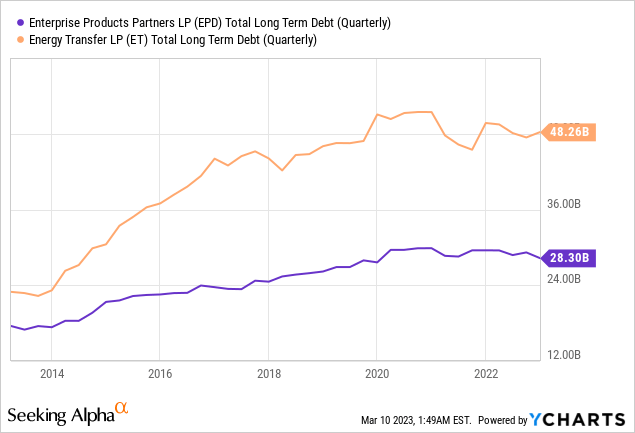
Enterprise Products Partners - EPD is a conservatively run Master Limited Partnership (MLP) and distribution growth appears to be returning to normal after slowing significantly in 2020 and 2021. Prior to this, EPD had been raising its distribution every quarter going back to the early 2000s. It’s a bummer to see the quarterly dividend increase streak end but that doesn’t change the fact that the company still has a 26-year history of consecutive distribution increases. Now factor in that the company has stated that it will invest $2.3-$2.5 billion towards growth capital investments in 2023. EPD has also “lowered its net debt target to 3x adjusted EBITDA from its prior goal of 3.5x, but it is not actively seeking a credit rating upgrade.” EPD has been able to weather the uncertainty of the last few years better than its competitor, Energy Transfer (ET), by utilizing appropriate amounts of debt when needed and by self-funding many of its projects.
Overall EPD is a good value at its current price and I expect that 2023 will really allow the company to shine.
The distribution was increased from $.475/share per quarter to $.49/share per quarter. This represents an increase of 3.2% and a new full-year payout of $1.96/share compared with the previous $1.90/share. This results in a current yield of 7.53% based on the current share price of $25.81.
Energy Transfer - ET saw its distribution slashed by 50% in November 2020. As mentioned in the summary for EPD, ET used significantly more leverage to grow its business and that created serious challenges for the sustainability of the distribution. By slashing the distribution, ET was able to focus on finding new projects through existing cash flow which is why ET’s total long-term debt has remained flat since the distribution was cut.
ET begin raising its distribution in February 2022 and has continued to raise the distribution every quarter since then. The most recent distribution increase now has the company paying the same amount that it was back when it slashed its distribution in November 2020.
Similar to EPD, I see ET as a good value at its current price and expect to see good performance moving forward. Moving forward I see ET’s distribution growth slowing down significantly with the company now paying a distribution that is the same as it was prior to November 2020. Continuing to raise the distribution by 15% every quarter is not something that is sustainable moving forward.
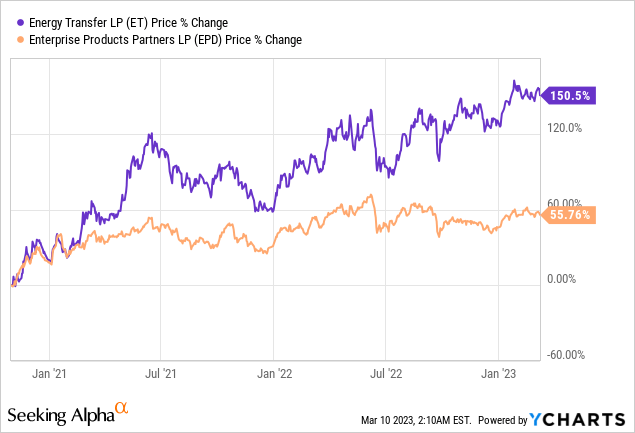
The distribution was increased from $.265/share per quarter to $.305/share per quarter. This represents an increase of 15.1% and a new full-year payout of $1.22/share compared with the previous $1.06/share. This results in a current yield of 9.27% based on the current share price of $12.90.
Helmerich & Payne - John and Jane recently purchased more shares of HP at around $41/share. HP cut its dividend back in August 2020 and has maintained the same quarterly dividend since then but over the last two-quarters management has decided to issue a supplemental dividend following the announcement made by management regarding its new focus on shareholder returns. During Q1-2023 earnings the company provided additional insight into what the new shareholder focus would be.
The Board authorized the repurchase of an additional one million shares in calendar 2023, bringing the total calendar 2023 authorization to five million shares. In calendar 2023, through January 27, we have repurchased approximately 434,000 shares for roughly $20.5 million. So fiscal 2023 repurchases have totaled approximately, 1.28 million shares thus far, for about $60 million and augment our long-standing base dividend and our fiscal 2023 supplemental dividend.
I like the flexibility of management's approach for shareholder returns and view HP as attractively priced in the low $40/share range. There is a chance we will be selling some of the high-cost shares at a loss to offset the gains of other shares we sell in 2023.
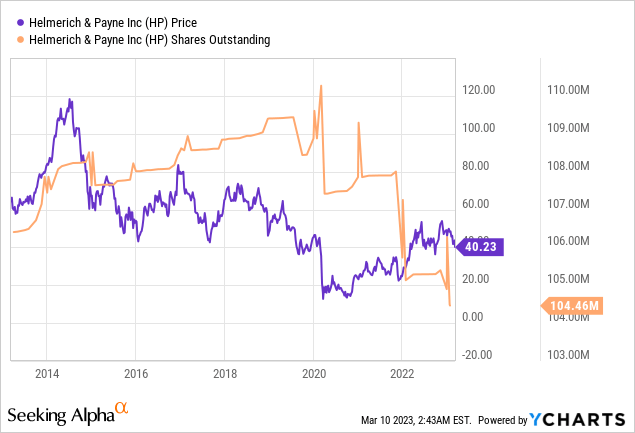
HP issued a supplemental dividend of $.235/share along with its normal quarterly dividend of $.25/share.
Positions
The Taxable Account currently consists of 43 unique positions (44 if you count the brokered certificate) at market close on March 9, 2023. There were no sales in the month of February but there were two purchases that took place.
2023 - February Taxable Transaction History (Charles Schwab)
February Income Tracker - 2022 Vs. 2023
We are starting with a clean slate for 2023 and with all of the expected dividends (based on currently owned shares and announced dividends) the account is set to generate slightly less dividend income in 2023. The primary reason for this was the number of special dividend payouts in 2022 that increased the yield at a faster pace. While it's possible we could see more special dividends in 2023 I think it's more likely that companies will turn their focus on deleveraging or stock buybacks. The Taxable Account is expected to generate an average of $1,776.12/month of dividend income in 2023 compared to the average monthly income of $1,792.62 generated in FY-2022. Once dividend increases are factored in and the additional interest income from CDs I expect we will see a very light increase in dividend income of 3-4%.
2022 also represented the first year of major withdrawals from the Taxable Account with no new funds flowing into it. The withdrawals John and Jane made were set at $1,000/month for a total of $12,000 withdrawn. After speaking with me they have decided to increase this amount to $1,700/month or a total of $20,400/year. The main reason for increasing the withdrawals from the Taxable Account is that they are taxed whether they take the money or not. This means I will need to be even more conscientious about capital deployment because I will have very limited excess funds to reinvest.
SNLH = Stocks No Longer Held - Dividends in this row represent the dividends collected on stocks that are no longer held in that portfolio. We still count the dividend income from stocks no longer held in the portfolio, even though it is non-recurring. All images below come from Consistent Dividend Investor, LLC. (also referred to as CDI as the source below).
The tables below represent which companies paid dividends in February and how that income source has changed relative to the same month last year.
2023 - February - Taxable Dividend Breakdown (CDI)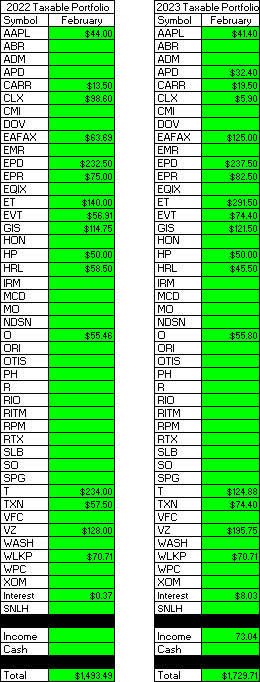
**The income category in the image above represents the certificate of deposit income.
The table below represents all income generated in 2022 and collected/expected dividends in 2023.
2023 - February - Taxable Annual Estimate (CDI)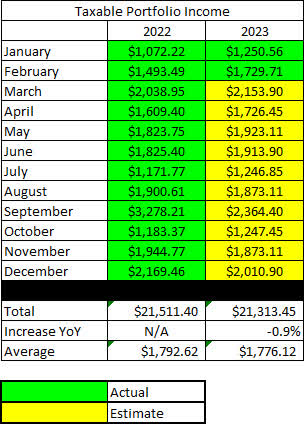
Below gives an extended look back at the dividend income generated when I first began writing these articles. I find this table to be most useful when comparing how dividend income has improved for a specific month over the course of six years.
2023 - February - Taxable Gain-Loss Update (CDI)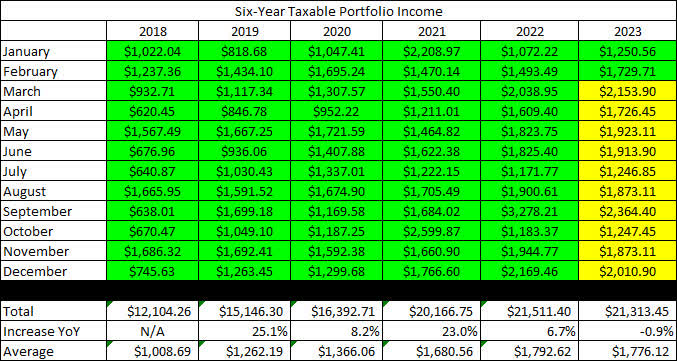
The Taxable Account balances below are from February 28, 2023, and all previous month balances are taken from the end-of-month statement provided by Charles Schwab.
2023 - February - Taxable Month End Balance (CDI)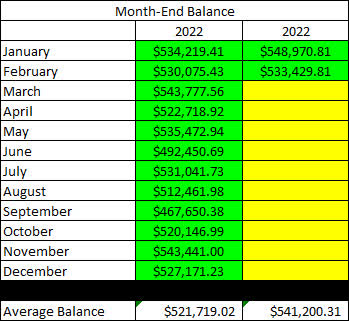
The next image is also pulled from the end-of-month statement provided by Charles Schwab which shows the cash balance of the account.
**Please note that cash balances may fluctuate based on CD renewal dates because I only count the cash that is 100% liquid. There were larger fluctuations in 2019 and 2020 that we the result of deposits and withdrawals being made. The Taxable Account has not had a deposit put into it since early 2020 but funds have been used for Traditional/Roth IRA Contributions and for withdrawals in 2022 and will be increasing in 2023.
2023 - February - Taxable Cash Balance (CDI)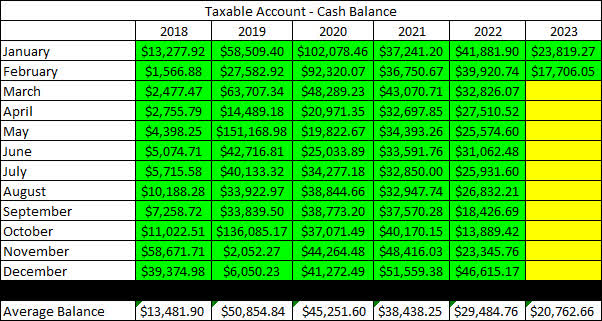
The next image provides a history of the unrealized gain/loss at the end of each month going back to the beginning of January 2018.
2023 - February - Taxable Unrealized Gain-Loss (CDI)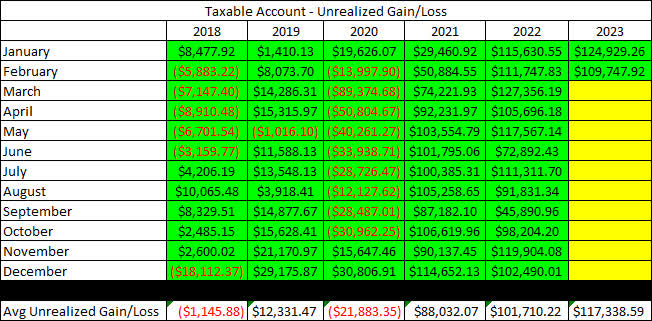
I think the table above is one of the most important for readers to understand because it paints a story of volatile markets and why we employ the strategy of generating consistent cash flows to overcome the uncertainty of the market. If we were dependent on selling shares to generate income for John and Jane's retirement they would have to be much more considerate of when they withdraw and how much they choose to withdraw.
For example, a withdrawal in 2020 where shares must be sold would destroy more value by locking in losses or poor performance by stocks being sold compared to making the same withdrawal in 2021.
It appears that I forgot to include the withdrawal table in the January update. The image below shows funds that are withdrawn from the account. This is especially important to consider because now the amount of dividend income generated is just enough to cover the amount being withdrawn.
2023 - February - Taxable Withdrawals (CDI)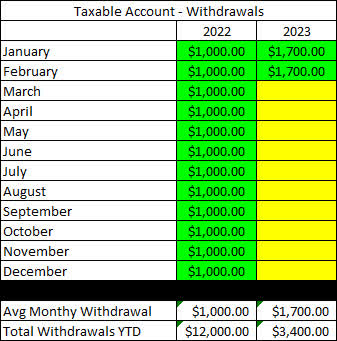
In an effort to be transparent about John and Jane's Taxable Account, I like to include an unrealized Gain/Loss summary. The numbers used are based on the closing prices from March 9th, 2023.
2023 - February - Taxable Gain-Loss Update (CDI)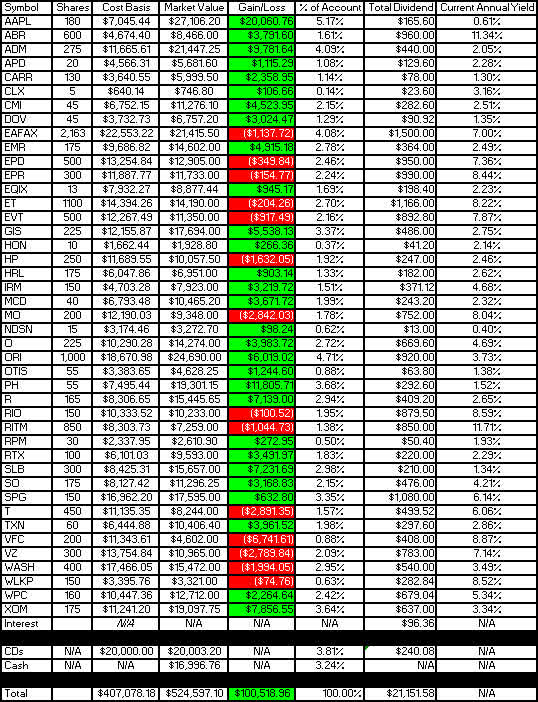
It is worth noting in the table above that the yield column is most accurate at the start of the year but if I reduce the size of positions it may inflate the yield because it is based on how much dividend income is collected. At the same time, it may report excessively low dividends for positions added or significantly increased at the end of the year.
Conclusion
As a write this article we are coming off a market shellacking with all 11 S&P sectors seeing negative returns for the day.
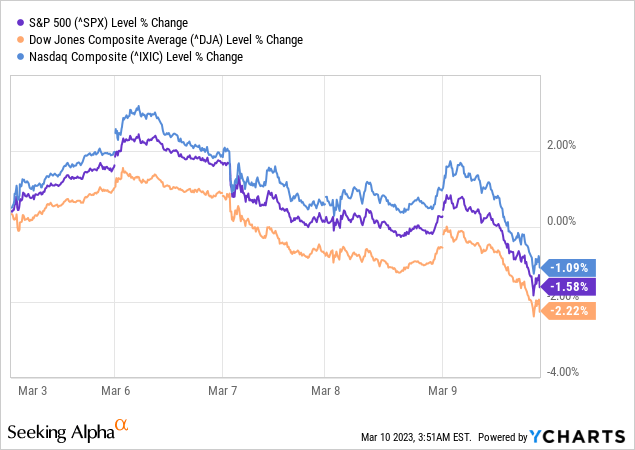
I think that the update from the market close was especially helpful to understand some of the headwinds that investors should keep in mind over the coming months.
"The Federal Reserve’s actions have consequences. After markets failed to break out earlier this year, we’re now dealing with a return to the realization that inflation is sticky while economic growth is weakening," analyst Leo Nelissen of BN Capital told Seeking Alpha. "Not only is the Fed forced to combat inflation, but it’s also expected to do it quickly."
Nelissen added: "Over, the next 12 months we’ll see 40% of government debt maturing, leading to a surge in anticipated interest payments. As a result, the risk/reward balance for equities is shifting, particularly given that the equity risk premium is at its lowest point since 2009."
Wall Street received a boost at the start of trading from a higher-than-expected initial jobless claims reading, which showed that the number of Americans filing for first-time unemployment benefits rose to 211K. An increase in layoffs suggested the labor market could be cooling, potentially removing a crucial inflationary pressure.
However, the early advance quickly dissipated, with stocks declining steadily through the much of the rest of the day. This added to a retreat seen earlier this week, when Federal Reserve Chair Jerome Powell issued hawkish remarks.
In John and Jane's Taxable Account, they are currently long the following mentioned in this article: Apple (NASDAQ:AAPL), Arbor Realty (NYSE:ABR), Archer-Daniels-Midland (NYSE:ADM), Air Products and Chemicals (APD), Carrier Global Corporation (NYSE:CARR), Clorox (NYSE:CLX), Cummins (NYSE:CMI), Dover Corporation (NYSE:DOV), Eaton Vance Floating-Rate Advantage Fund A (MUTF:EAFAX), Emerson Electric (EMR), Enterprise Products Partners (NYSE:EPD), EPR Properties (NYSE:EPR), Equinix (NASDAQ:EQIX), Energy Transfer (NYSE:ET), Eaton Vance Tax-Advantaged Dividend Income Fund (NYSE:EVT), General Mills (NYSE:GIS), Honeywell (NASDAQ:HON), Helmerich & Payne (NYSE:HP), Hormel (NYSE:HRL), Iron Mountain (NYSE:IRM), McDonald's (MCD), Altria (NYSE:MO), Nordson (NDSN), Realty Income (O), Old Republic International (ORI), Otis Worldwide Corporation (NYSE:OTIS), Parker-Hannifin (NYSE:PH), Ryder System (NYSE:R), Rio Tinto (RIO), Rithm Capital (RITM), RPM International (RPM), Raytheon Technologies (NYSE:RTX), Schlumberger (NYSE:SLB), Southern Company (NYSE:SO), Simon Property Group (SPG), AT&T (NYSE:T), Texas Instruments (NASDAQ:TXN), V.F. Corporation (VFC), Verizon (NYSE:VZ), Washington Trust (NASDAQ:WASH), Westlake Chemical (NYSE:WLKP), W. P. Carey (NYSE:WPC), and Exxon Mobil (XOM).
Editor's Note: This article discusses one or more securities that do not trade on a major U.S. exchange. Please be aware of the risks associated with these stocks.
This article was written by

Disclosure: I/we have a beneficial long position in the shares of AAPL, ADM, APD, EMR, EPR, EQIX, HON, MCD, NDSN, O, RPM, T, TXN, VFC either through stock ownership, options, or other derivatives. I wrote this article myself, and it expresses my own opinions. I am not receiving compensation for it (other than from Seeking Alpha). I have no business relationship with any company whose stock is mentioned in this article.
Additional disclosure: This article reflects my own personal views and I am not giving any specific or general advice. All advice that is given is done so without prejudice and it is highly recommended that you do your own research. This article was written on my own and does not reflect the views or opinions of my employer.