An Alternative To The Dogs Of The Dow

Summary
- Although investing in the Dogs of the Dow has had mixed results, it has been an overall winner.
- I propose that a similar strategy focusing on high quality investments could provide similar results.
- I contend that this is a particularly sound strategy for those using dollar cost averaging.
- Looking for more investing ideas like this one? Get them exclusively at iREIT on Alpha. Learn More »
sankai
This article was coproduced with Chuck Walston.
I assume most investors are familiar with The Dogs of the Dow investment strategy. Dating back to 1991, it is designed to beat the broader markets by choosing the ten stocks in the Dow Jones Industrial Average (DJI) that pay the highest yields.
The focus of this article is to propose that the Dogs of the Dow has some merit, and that a list of investments based on the foundation of the strategy can provide desirable results.
Evaluating the Dogs of the Dow
The criteria for being listed among the Dogs of the Dow is quite simple: one invests in the ten stocks listed on the DJIA that provide the highest yields at the beginning of each year.
The strategy is based on the premise that high dividend yields indicate a stock is undervalued. Furthermore, a history of strong dividend payments is a hallmark of companies that outperform the broader markets over the long term.
Proof of the efficacy of this strategy lies in the results. In the twenty years from 1992 to 2011, the Dogs of the Dow equaled the average annual total return of the DJIA (10.8 %) and beat the return of the S&P 500 (9.6%).
I've written an article or two on The Dogs, and the following chart is from a related piece that debuted about a half decade ago.
(Results are with dividends reinvested. Time periods end in 2018.)
Seeking Alpha / Data Dogs of the DOW/ Chart by Author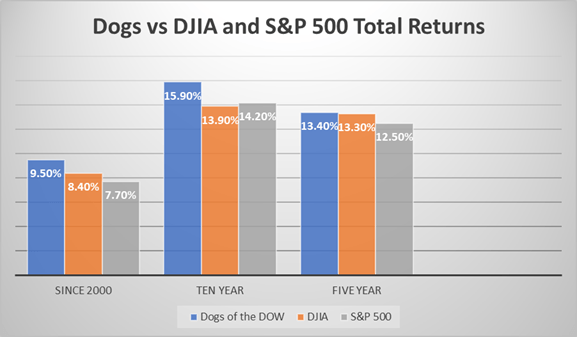
However, it is not uncommon for The Dogs to underperform the markets in any given year. The dot.com boom of the late nineties saw The Dogs perform poorly, as did the period involving the 2007-2009 financial crisis.
An Alternative To The Dogs
No single strategy is a foolproof means of beating the markets. For example, there is substantial evidence that dividend bearing and low beta stocks tend to lag when the S&P and Dow are soaring; however, those same stocks often beat the markets by a wide margin when the markets plummet.
It is a case of "you can't have your cake and eat it, too." By investing in dividend bearing stocks, you must acknowledge that your returns will often lag during big Bull Markets.
However, you can harness an ever-growing stream of passive income by investing in dividend growth stocks. I propose targeting high quality stocks trading with yields well below their historic averages can lead to strong overall returns while boosting one's passive income stream.
Three Stocks Trading With Elevated Yields
The Home Depot, Inc. (HD)
The following chart (all charts in this section are sourced from Seeking Alpha) provides a history of the stock's yield over the current and previous ten years.
Dividend Yield History
Current Yield 2.88%
Seeking Alpha / Author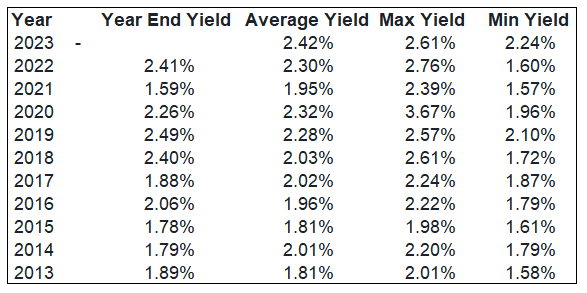
Home Depot marks every box that I use when seeking a prime, income generating, safe, long-term investment. Along with Lowe's (LOW), HD operates in a near duopoly. The company's scale provides leverage with vendors, advertisers and logistics. In turn, this provides a pricing advantage over rivals and larger margins.
Unlike many retailers, Home Depot's products tend to be ecommerce resistant, and it is estimated that roughly two-thirds of the company's sales are for essential items. After all, it is quite difficult to forego the purchase of a broken water heater or toilet, and delaying repairs to a leaking roof or faulty plumbing can easily result in greater expense over the long haul.
Another strength lies in the company's balance sheet. With $2.75 billion of cash and equivalents at the end of the last quarter and a solid investment grade credit rating, HD has a firm financial foundation. Furthermore, the company owns approximately 90% of its stores.
With $157 billion in revenue in 2022, Home Depot controls the lion's share of the home improvement retail industry; however, with an estimated market of $1 trillion, that leaves plenty of room for growth.
Furthermore, HD has a proverbial "ace up one's sleeve" advantage. Approximately half of the firm's revenues are derived from Pro sales, double that of Lowe's, its closest competitor.
Not only do Pros provide a steady stream of generally recurring revenue, they also spend more per ticket. More importantly, Pros will continue to drive revenues for HD due to the dynamics surrounding the U.S. housing market.
The market for home improvement projects is largely driven by several factors. The first is that those buying a home undertake remodeling projects to meet their needs and tastes. While that has always been the case, the evolution to remote work is also fueling the demand for home remodels.
Another impetus for home remodels lies in the home equity in the U.S., which now averages about $330,000 per homeowner. Rising interest rates mean those with lower fixed mortgages are unlikely to spring for a new home. With the expectation that they will live in the same home for longer, some will use home equity to finance remodeling projects.
Perhaps the most important force driving home improvement projects is that the median age of a U.S. house is 39 years, and 50% of US homes are over 41 years old. One estimate shows 24 million homes are in need of repairs and/or upgrades.
Eric Finnigan, VP of research & demographics at John Burns Real Estate Consulting provided the following observation regarding remodeling demand.
There's fewer listings out there, fewer listings of homes, fewer homes sold, but [the] underlying demand for remodeling is higher than it's been probably for a decade.
[These homes are] basically going to go through a complete sort of facelift. A home enters its "prime modeling years" when it reaches about 20-40 years old.
We're seeing a big wave of homes entering that cohort, [those] sort of prime remodeling years.
Harvard's Joint Center For Housing Studies provides the Leading Indicator of Remodeling Activity (LIRA), a short-term outlook for national home improvement and repair spending in owner-occupied homes. While their studies indicate demand for home improvement is waning, that is largely due to the increase in interest rates and slowing sales in the housing market.
The massive pandemic-induced changes in housing and lifestyle decisions fueled remodeling and repair spending in 2020 and 2021, growing 23.8 percent over these two years compared with the 12.5 percent originally estimated.
While the pace of expenditures is expected to slow substantially this year, we've raised our projection for the remodeling market size in 2023 by about $45 billion, or 10.2 percent, to $485 billion."
- Abbe Will, Associate Project Director of the Remodeling Futures Program.
Count me as one that sees this as the equivalent of an ancient mariner experiencing doldrums while viewing a much-welcomed storm on the horizon. The waning remodeling activity in 2023 will simply lead to pent up demand once interest rates decline.
Home Depot's current yield is 2.87% while the average maximum yield over the last decade stands at 2.47%. The chart also shows that the average yield over the last decade has been approximately 2%.
With a payout ratio just below 47% and a solid financial foundation, I view the dividend as safe. HD has a 5-year dividend growth rate of about 16%.
Home Depot's forward P/E of 18.32x is nearly three points below the stock's 5-year average P/E. The company's 5-year PEG of 1.61x is well below the stock's average PEG over the last 5 years of 2.23x.
I added marginally to my HD position recently. While I do not currently rate the stock as a Buy, I am happy to dollar-cost-average into my position, something I will not do unless I evaluate a ticker as trading in a fair value range.
In regards to yield, I contend that buying HD at this juncture is tantamount to capturing roughly two and a half years of dividend growth (the average 5-year dividend growth rate for HD is about 16%).
Comcast Corporation (CMCSA)
Dividend Yield History
Current Yield 3.23%
Seeking Alpha / Author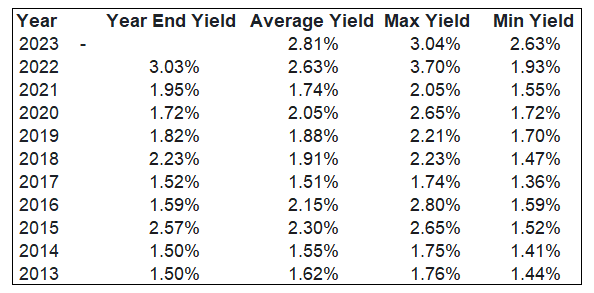
Like Home Depot, Comcast is largely a duopoly. Comcast and Charter Communications, Inc. (CHTR) combined hold sway over 200 million people, and fewer than one percent of those consumers have access to the services of both companies.
For years, there have been claims that the cord-cutting trend would sink cable companies. It is worth noting that a decade ago, over 80% of American homes were cable subscribers, whereas today only half of the U.S. households subscribe to cable. Yet in that time frame, Comcast has grown revenue, FCF, and EBITDA at a marked rate.
Two factors worked to Comcasts' advantage: the company's cable network provides a platform to deliver premium broadband services to customers, and to replicate Comcast's infrastructure would require a competitor to devote many billions to capex. Furthermore, the recurring revenue generated by Comcast's services create a steady stream of free cash flow.
In a large section of the country, Comcast's broadband offerings are in effect a legal monopoly. The Institute For Local Self-Reliance reports Comcast and Charter hold "an absolute monopoly" over 47 million people. For an additional 33 million customers, the only alternatives are a markedly slower and less reliable provider. Thirty million customers have no other broadband provider other than CMCSA.
Ookla and U.S. News both rate Comcast's Xfinity as the fastest broadband service, with the latter also noting that Xfinity is the most used broadband provider in the country.
Additionally, recent tests of internet speeds indicate downloads are more than two-and-a-half times faster for broadband as compared to wireless, and broadband's upload speeds have an even larger advantage over wireless.
Over 85% of Comcast's customers receive 100 megabits/second service while the majority of AT&T, Verizon, and T-Mobile networks are incapable of delivering speeds above 20 megabits/second. To upgrade their service to match Comcast's would require a prodigious level of capex.
The bear argument against CMCSA is that the company is experiencing very slow growth; however, this ignores the firm's wide moat and strong FCF.
Like Home Depot, CMCSA has a solid balance sheet. Credit agencies rate the firm's debt on the lower end of A level, well within investment grade debt range.
Once again, I turn to the related chart outlining the stock's dividend history. The current yield is 3.23%. With the exception of last year, that surpasses the maximum yield in any year over the last decade. Over the last ten years, the max yield has averaged approximately 2.35%.
Comcast's payout ratio is just below 30%, and the 5-year dividend growth rate is 11.38%. Comcast repurchased $13 billion of its stock in 2022, around 8% of float.
Comcast's forward P/E of 9.83x is well below the stock's 5-year average P/E of 14.75x.The company's 5-year PEG of 0.71x is also favorable in relation to the stock's average PEG over the last 5 years of 1.24x.
Aside from the relatively high yield Comcast currently offers, I rate the stock as a Buy due to conventional valuation metrics.
The Toronto-Dominion Bank (TD)
Dividend Yield History
Current Yield 4.35%
Seeking Alpha / Author
By assets, Toronto-Dominion is one of the two largest banks in Canada and the 6th largest in North America. About 55% of revenue is derived from Canada, while 35% is generated in the U.S.
TD holds the number one or two market share for all key retail banking products in Canada. Toronto-Dominion also holds the number-two market share for business banking and is the number-one card issuer in Canada.
TD has a 12% stake in The Charles Schwab Corporation (SCHW), a stock I hold in high regard.
The Canadian banking system differs in several respects from the U.S. Barriers to entry are very high as regulations curtail foreign competition. Foreign banks can only operate in Canada under a number of restrictions, and those with a legal residence outside of Canada cannot own more than 25% of a bank's shares.
Domestic competition is curtailed, resulting in a relatively small number of large banks. In turn, that scale provides a higher level of operating efficiency due to fixed costs being spread across a larger operating base.
In large part, this accounts for why Canadian banking records returns on equity of nearly 20%, twice the global standard for well-run banks.
TD has a history of well-designed acquisitions, and a bit over a week ago, the bank closed on a deal to acquire Cowen, an independent U.S. investment bank.
The all-cash transaction, valued at $1.3 billion, is expected to be modestly accretive to TD's FY 23 adjusted EPS. This acquisition also brings a research, sales, trading, and execution platform under TD's banner.
In February of 2022, TD announced a deal to acquire First Horizon. Assuming that acquisition is approved, it would result in the 6th largest banking operation in the U.S.
TD has a strong financial foundation: S&P and Fitch provide rate debt ratings of AA- stable.
TD yields 4.35%. Over the last decade, the max yield has averaged approximately 3.95%.
The payout ratio is 42.23%, and the 5-year dividend growth rate is just a hair under 8%. TD's forward P/E of 9.65x compares well to the stock's 5-year average P/E of 11.29x.The company's forward PEG is 1.08x.
I also rate TD as a buy based on its current valuation.
TD ranks among the few stocks that one could likely invest in and then forget. It is a true buy-and-hold forever investment.
Summation
I contend that stock valuations, particularly those in top notch companies, will tend to return to levels that will eventually result in yields matching historic averages.
While I use a variety of conventional metrics to rate stocks as Buys, I would propose that investing in high quality companies when they offer yields well above a stock's historic average is likely to (literally) pay dividends over the long run.
Each of these three names is of high quality, and I rate two of the three as solid buys due to valuations.
I own positions in each of these companies, and I've added to each investment within this calendar year.
Get My New Book For Free!
Join iREIT on Alpha today to get the most in-depth research that includes REITs, mREIT, Preferreds, BDCs, MLPs, ETFs, and we recently added Prop Tech SPACs to the lineup. Nothing to lose with our FREE 2-week trial.

And this offer includes a 2-Week FREE TRIAL plus my FREE book.
This article was written by

Brad Thomas is the CEO of Wide Moat Research ("WMR"), a subscription-based publisher of financial information, serving over 15,000 investors around the world. WMR has a team of experienced multi-disciplined analysts covering all dividend categories, including REITs, MLPs, BDCs, and traditional C-Corps.
The WMR brands include: (1) iREIT on Alpha (Seeking Alpha), and (2) The Dividend Kings (Seeking Alpha), and (3) Wide Moat Research. He is also the editor of The Forbes Real Estate Investor.
Thomas has also been featured in Barron's, Forbes Magazine, Kiplinger’s, US News & World Report, Money, NPR, Institutional Investor, GlobeStreet, CNN, Newsmax, and Fox.
He is the #1 contributing analyst on Seeking Alpha in 2014, 2015, 2016, 2017, 2018, 2019, 2020, 2021, and 2022 (based on page views) and has over 108,000 followers (on Seeking Alpha). Thomas is also the author of The Intelligent REIT Investor Guide (Wiley) and is writing a new book, REITs For Dummies.
Thomas received a Bachelor of Science degree in Business/Economics from Presbyterian College and he is married with 5 wonderful kids. He has over 30 years of real estate investing experience and is one of the most prolific writers on Seeking Alpha. To learn more about Brad visit HERE.Disclosure: I/we have a beneficial long position in the shares of HD, TD, CMCSA either through stock ownership, options, or other derivatives. I wrote this article myself, and it expresses my own opinions. I am not receiving compensation for it (other than from Seeking Alpha). I have no business relationship with any company whose stock is mentioned in this article.
Additional disclosure: Author's note: Brad Thomas is a Wall Street writer, which means he's not always right with his predictions or recommendations. Since that also applies to his grammar, please excuse any typos you may find. Also, this article is free: Written and distributed only to assist in research while providing a forum for second-level thinking.