PID Vs. DNL: A True Dividend Growth ETF And A Misnamed One

Summary
- Invesco International Dividend Achievers ETF implements an international dividend growth strategy.
- The top sectors are utilities and financials, and the fund is overweight in Canadian companies.
- I compare it with another international ex-U.S. dividend fund: WisdomTree Global ex-U.S. Quality Dividend Growth ETF.
- Quantitative Risk & Value members get exclusive access to our real-world portfolio. See all our investments here »
ssuni
This dividend ETF article series aims at evaluating products regarding the relative past performance of their strategies and quality of their current portfolios. As holdings and their weights change over time, reviews may be updated when necessary.
PID strategy and portfolio
The Invesco International Dividend Achievers ETF (NASDAQ:PID) has been tracking the NASDAQ International Dividend Achievers Index since 09/15/2005. As of writing, it has 46 holdings, a 12-month distribution yield of 3.19% and a total expense ratio of 0.53%.
As described in the prospectus by Invesco, the underlying index selects companies that:
- Are listed in the U.S., and in some cases on the LSE in London.
- Are incorporated outside the U.S.
- Have increased their annual dividends each of the last five years.
- Have an average daily dollar trading volume of at least $1 million.
- Have not entered an agreement or proceeding resulting in ineligibility.
The weighting methodology is based on the 12-month dividend yield, with a maximum weight of 4% per constituent. The index is reconstituted once a year in March and rebalanced quarterly. A constituent may be excluded at any time if it becomes ineligible. In this case, it is not replaced until the next reconstitution. I pass on the details that guarantee index integrity in case of corporate events (stock split, M/A, spin-off…).
Hereafter, I will compare PID with WisdomTree Global ex-U.S. Quality Dividend Growth ETF (DNL) by looking into their portfolio structure, valuation and performance. I did this comparison because they share some characteristics that look similar:
- portfolio of international dividend paying companies,
- U.S. exclusion,
- growth criteria,
- no hedge against currency risks,
- More than 16 years of historical data.
DNL was reviewed here. Both funds pay quarterly distributions. The next table compares yields, fees, assets ("AUM") and average daily volumes.
PID | DNL | |
Yield (trailing 12 months) | 3.19% | 4.62% |
Expense ratio | 0.53% | 0.42% |
AUM | $995.18M | $485.65M |
Average volume | 344.45K | 97.20K |
DNL is less liquid: it is not an issue for long-term investors, but it is less adequate for swing trading or tactical allocation.
Both funds are mostly invested in giant and large companies, but PID has a significantly higher weight in mid-caps:
Total returns since June 2006 ( Seeking Alpha)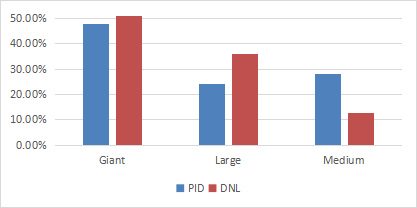
PID is massively overweight in Canadian companies: 53.7% of asset value. The U.K. is a pale second at 9%. Other countries are under 6%. This concentration is a consequence of the New York or London listing requirement. It is a strong limitation compared to other international funds. Surprisingly, despite a strategy excluding companies incorporated in the U.S., the country appears in third position with 5.9% of asset value. It may be explained by the fact that several companies with historical headquarters in the U.S. are incorporated overseas (in particular in Ireland and the Netherlands).
DNL is much more diversified. The heaviest country is the U.K. with 15.5% of assets. PID has no direct exposure to geopolitical and regulatory risks related to China. In DNL, the aggregate weight of China, Hong Kong and Taiwan is 17.5%.
Geographical allocation (chart: author: data: Invesco, WisdomTree)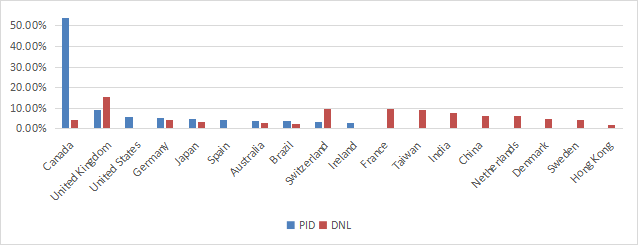
The heaviest sector is utilities in both funds, with about 20% of assets. Financials come close behind it for PID (18.6%), whereas consumer discretionary is in second position for DNL. Comparing weights by sector in both funds, PID massively overweights financials, energy and materials, while DNL is much heavier than its peer in consumer discretionary, consumer staples and industrials.
Sector Breakdown (chart: author: data: Invesco, WisdomTree.)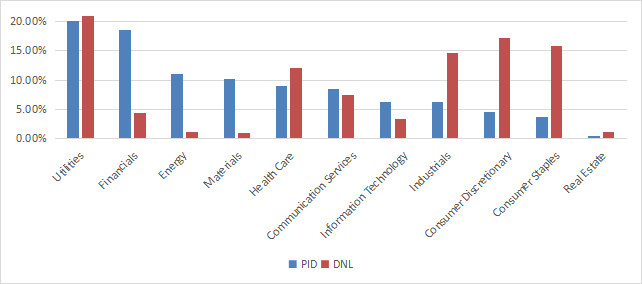
The top 10 holdings, listed below with fundamental ratios, represent 39% of asset value. The heaviest one weighs less than 5%, so risks related to individual stocks are moderate.
Ticker | Name | Weight% | EPS growth %TTM | P/E TTM | P/E fwd | Yield% |
Sumitomo Mitsui Financial Group, Inc. | 4.46 | -0.86 | 9.75 | 9.88 | 3.60 | |
Atlantica Sustainable Infrastructure plc | 4.10 | 80.24 | N/A | 66.82 | 6.32 | |
Algonquin Power & Utilities Corp. | 4.06 | -96.15 | 200.80 | 11.24 | 9.58 | |
Banco Santander (Brasil) SA | 4.03 | N/A | N/A | 8.30 | 9.62 | |
Rio Tinto Plc | 4.03 | -40.58 | 8.77 | 9.60 | 7.21 | |
Fresenius Medical Care AG & Co. KGaA | 3.89 | -38.47 | 15.71 | 15.67 | 3.74 | |
Enbridge, Inc. | 3.73 | -55.48 | 37.23 | 17.17 | 6.77 | |
BCE, Inc. | 3.70 | -3.59 | 18.88 | 18.10 | 6.46 | |
TC Energy Corp. | 3.61 | -59.99 | 66.97 | 12.41 | 6.81 | |
National Grid plc | 3.61 | 90.98 | 11.15 | 14.71 | 5.05 |
DNL has a similar aggregate exposure to its top 10 holdings, but it is heavier in the top name: Taiwan Semiconductor Manufacturing Co (TSM) weighs about 8%.
PID is significantly cheaper than DNL regarding aggregate valuation ratios:
PID | DNL | |
Price / Earnings TTM | 17.07 | 20.65 |
Price / Book | 1.76 | 4.43 |
Price / Sales | 1.88 | 2.37 |
Price / Cash Flow | 8.19 | 15.13 |
Performance
The next table and chart compare returns since DNL inception (06/16/2006). DNL is the best performer, and it also shows a lower volatility and shallower drawdowns in 2008, 2015 and 2020. However, the difference in annualized return is not very significant: only 30 bps.
Annual.Return | Drawdown | Sharpe ratio | Volatility | |
PID | 4.0% | -66.3% | 0.24 | 18.92% |
DNL | 4.3% | -44.5% | 0.27 | 17.16% |
S&P 500 | 9.2% | -55.2% | 0.57 | 15.78% |
Total returns since June 2006 ( Seeking Alpha)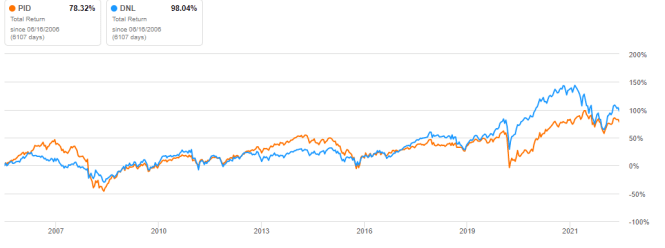
PID has outperformed DNL in the last 3 years (chart below).
Total returns, last 3 years (Seeking Alpha)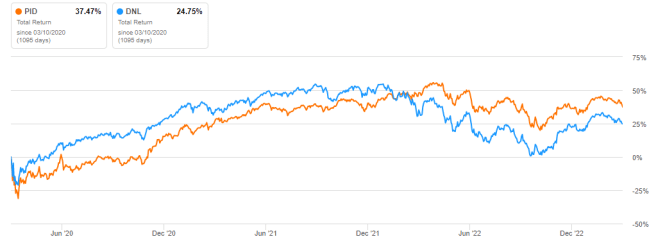
The next table evaluates dividend growth between 2012 and 2021. I have excluded 2022 because of exceptional distributions by DNL.
Annual div. /share | PID | DNL |
2012 | 0.43 | 0.72 |
2021 | 0.61 | 0.6 |
9-year Growth | 41.86% | -16.67% |
Annualized | 3.96% | -2.01% |
From December 2012 to December 2021, the cumulative inflation has been 21.4%, or 2.18% annualized. PID distribution growth is not extraordinary, but it has outpaced inflation in the last 9 years.
DNL is obviously a bad choice for dividend growth investors. In fact, its designation "Quality Dividend Growth ETF" is misleading: the underlying index selects dividend stocks with expected earnings growth, not growing dividends. The current trailing 12-month rate is also misleading: the projected dividend yield is lower, close to 2%. DNL is not a bad fund, but it is a total return ETF, despite its name. For dividend-oriented investors, PID is a better choice. However, investors must be aware that it is mostly invested in Canada, and price history points to a higher volatility.
Editor's Note: This article discusses one or more securities that do not trade on a major U.S. exchange. Please be aware of the risks associated with these stocks.
Quantitative Risk & Value (QRV) features data-driven strategies in stocks and closed-end funds outperforming their benchmarks since inception. Get started with a two-week free trial now.

This article was written by

Step up your investing experience: try Quantitative Risk & Value for free now (limited offer).
I am an individual investor and an IT professional, not a finance professional. My writings are data analysis and opinions, not investment advice. They may contain inaccurate information, despite all the effort I put in them. Readers are responsible for all consequences of using information included in my work, and are encouraged to do their own research from various sources.
Disclosure: I/we have no stock, option or similar derivative position in any of the companies mentioned, and no plans to initiate any such positions within the next 72 hours. I wrote this article myself, and it expresses my own opinions. I am not receiving compensation for it (other than from Seeking Alpha). I have no business relationship with any company whose stock is mentioned in this article.