GLD, SLV, And Negative Real Interest Rates

Summary
- Overall, I am against holding too much gold or silver due to their drawbacks. As Buffett repeatedly said, they do not generate income/profit.
- However, I change my mind when the facts change.
- And in this case, as the real interest rates become negative, I see a few good reasons to consider more exposure to gold and silver.
- In this article, I will use the SPDR Gold Trust ETF (GLD) and iShares Silver Trust ETF (SLV) to illustrate my thinking in more detail.
- GLD and SLV are excellent diversification options in addition to other asset classes and now is truly an opportune time for an SLV-GLD trade.
- This idea was discussed in more depth with members of my private investing community, Envision Early Retirement. Learn More »
Yuliya Soklakova/iStock via Getty Images
Thesis
If you clicked on this article, I assume you are familiar with the pros and cons of holding precious metals. Overall, I am against holding too much of it for considerations like lack of income generation ability, volatility, fees, etc.
However, the main thesis of this article is to explain why I feel now is a good time to consider more exposure to gold and silver. And the remainder of this article I will use the SPDR Gold Trust ETF (NYSEARCA:GLD) and iShares Silver Trust ETF (NYSEARCA:SLV) to illustrate my thinking process. To summarize, I will elaborate on the following 3 main reasons to support my thesis:
- The real interest rates have become negative. And historical data show a negative correlation between gold prices and real interest rates.
- Both GLD and SLV offer low or negative correlation with other asset classes (such as equity, bonds, REITs, cash, etc.). Such low/negative correlation makes them excellent diversification options given the uncertainties ahead.
- And finally, the current gold-silver price ratio presents a truly opportune time for a silver-gold trade.
1. Negative interest rates
Let's start with negative interest rates, as shown in the next chart. As we all know, the real interest rate is obtained by subtracting the inflation rate from the nominal interest rate. Under current conditions, our nominal interest rates (between 4% to 5% depending on the duration) are lower than the inflation rate (above 6%). As a result, the real interest rates are in the negative regime as shown (the blue line in the chart).
Source: longtermtrends.net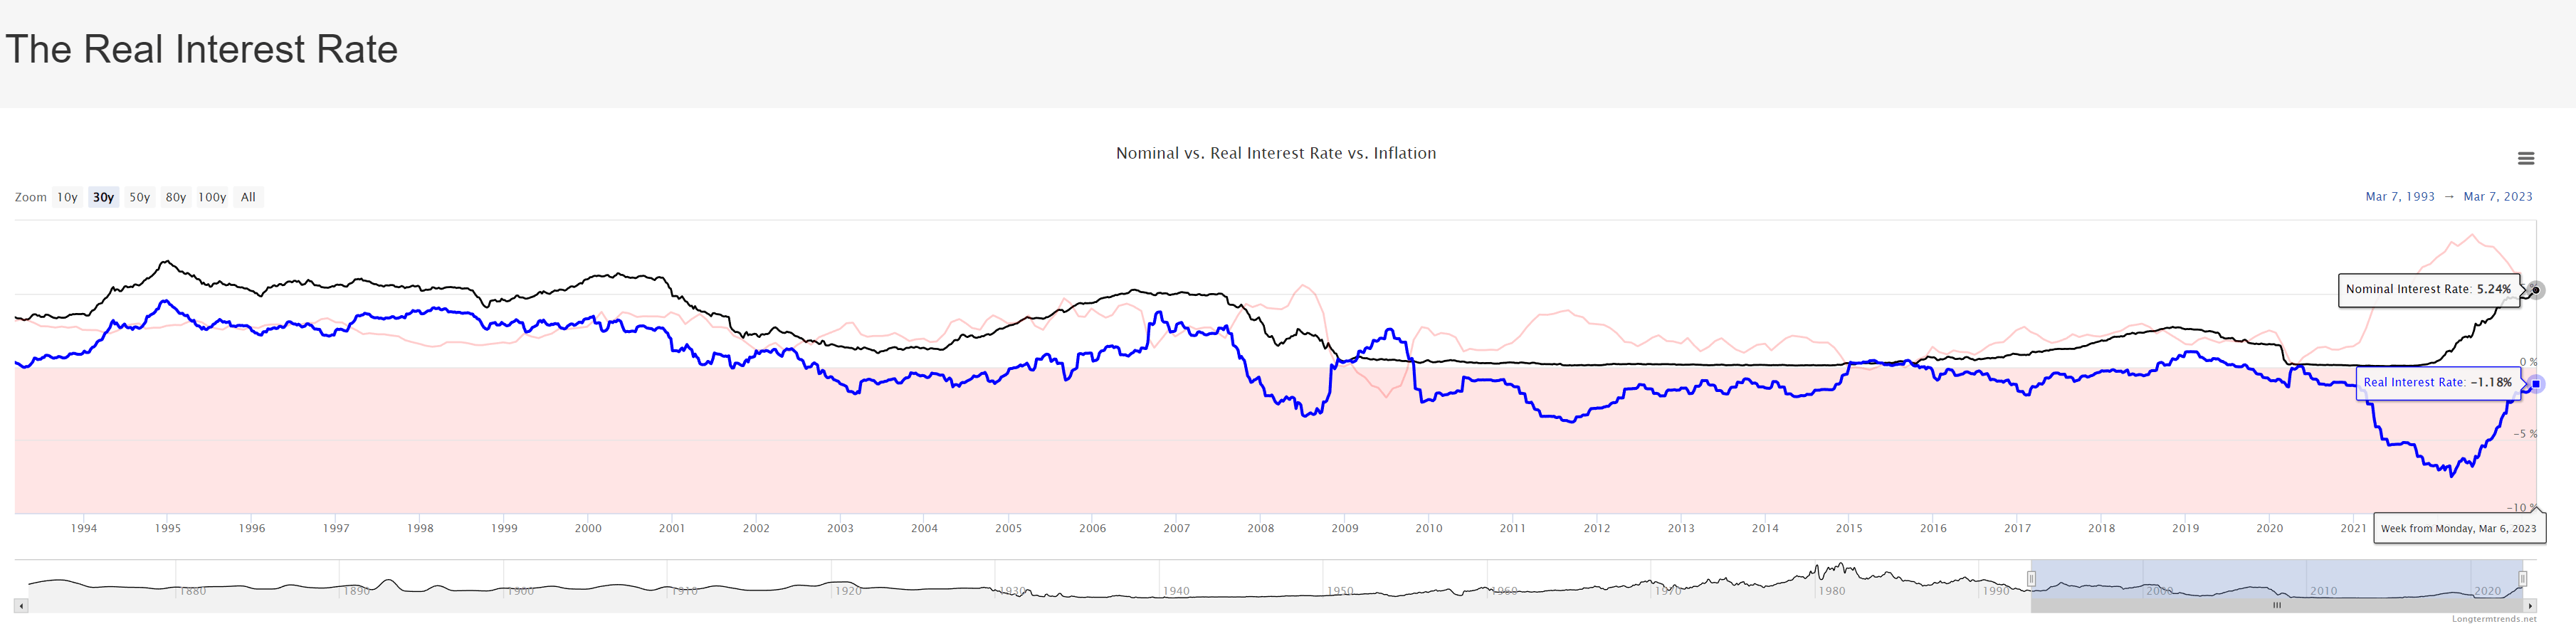
Historically data demonstrate a negative correlation between gold prices and real yields as seen in the next chart. This chart displays the price of gold (in units of $ per ounce) and the real 10-year treasury rates. Note that the axis for gold price is inverted. As a result, the close synchronization of their movements is a clear indication of the negative correlation. The correlation is actually quite strong with a correlation coefficient of -0.82. More specifically, according to Erb and Harvey:
"…the correlation between real interest rates and the price of gold is -0.82. In other words, when real yields go down gold goes up. This correlation explains why inflation is gold's best friend while rate hikes are its worst enemy. Here is a possible explanation for this relationship. Rising interest rates also mean rising opportunity costs of holding gold. Gold neither pays dividends nor interest. Thus, it is relatively expensive to hold it in the portfolio when real interest rates are high. On the other hand, when real yields are negative, holders of cash and bonds are losing wealth. In such a scenario, they are more prone to buy gold".
Source: longtermtrends.net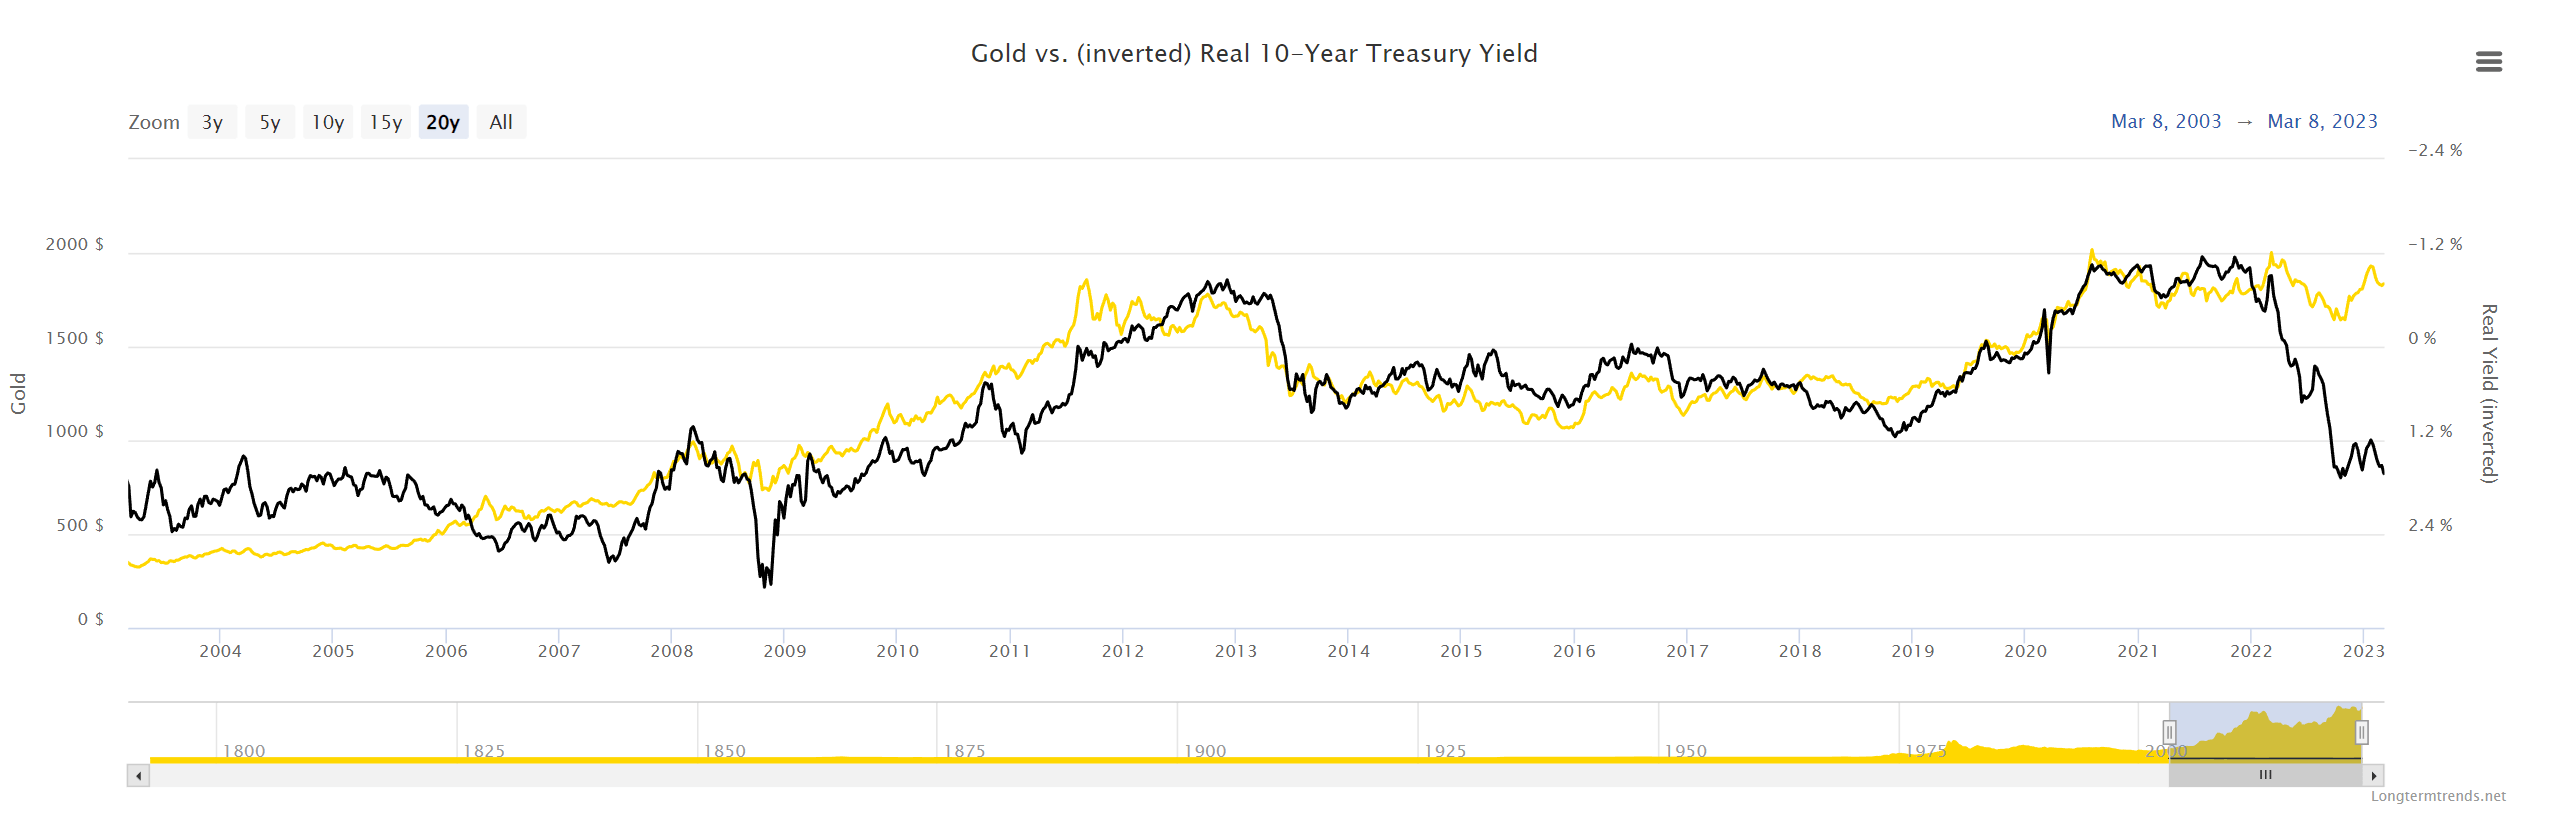
2. Additional diversification
Due to the negative correlation with respect to real interest rates, I see good price appreciation potential for GLD and especially SLV (more on this when I detailed my 3rd reason). In addition, both GLD and SLV serve as excellent diversification options in the long term in addition to typical assets available to ordinary investors (e.g., equity, bonds, cash, and real estate). The chart below shows the low or negative correlation between them and these other asset classes. For instance, GLD's correlation coefficient is only 0.07 with respect to ("WRT") the overall equity market represented by SPY, only 0.25 WRT long-term treasury bonds represented by TLT, and 0.11 WRT REITs represented by VNQ, and merely 0.03 WRT cash. Similarly, SLV's correlation coefficient WRT to these assets is also very low: 0.27 WRT the overall equity market, 0.02 WRT long-term treasury bonds, 0.21 WRT REITs, and negative 0.03 WRT cash.
Source: Portfolio Visualizer data
3. An opportune time for SLV-GLD trade
In case you are new to this method, the silver-gold trade is a strategy in which you sell a certain amount of gold to buy silver when the silver price appears more attractive relative to the gold price, and vice versa. The key metric to evaluate which metal's price is more attractive is the gold-silver price ratio ("GSPR"). The GSPR is also known as the mint ratio. The chart below displays the GSPR since 1970. As seen, the PR has mostly been range-bound between approximately a bottom of ~35 and a peak of 95. The long-term arithmetic average is approximately 60x (58.9x to be precise). The current GSPR hovers around 83x, which is about 38% above the historical mean and indicates an undervaluation of silver relative to gold.
The undervaluation becomes even more pronounced when you consider the so-called geometric average (aka, the logarithmic average). Mathematically, the arithmetic mean just mentioned starts to lose meaning when the ratio fluctuates widely because the mean become dominated by the high price ratios and is thus biased. The GSPR fluctuation (more than three-fold) is large enough to cause a noticeable bias, and it is, therefore, helpful to consider the geometric mean too. The geometric mean is approximately 57.6x estimated from the historical data shown, a bit lower than the arithmetic mean.
As such, the current GSPR of 83.2% is more than 44% above the geometric mean, indicating an even more attractive silver pricing relative to gold.
Source: Author based on Seeking Alpha data.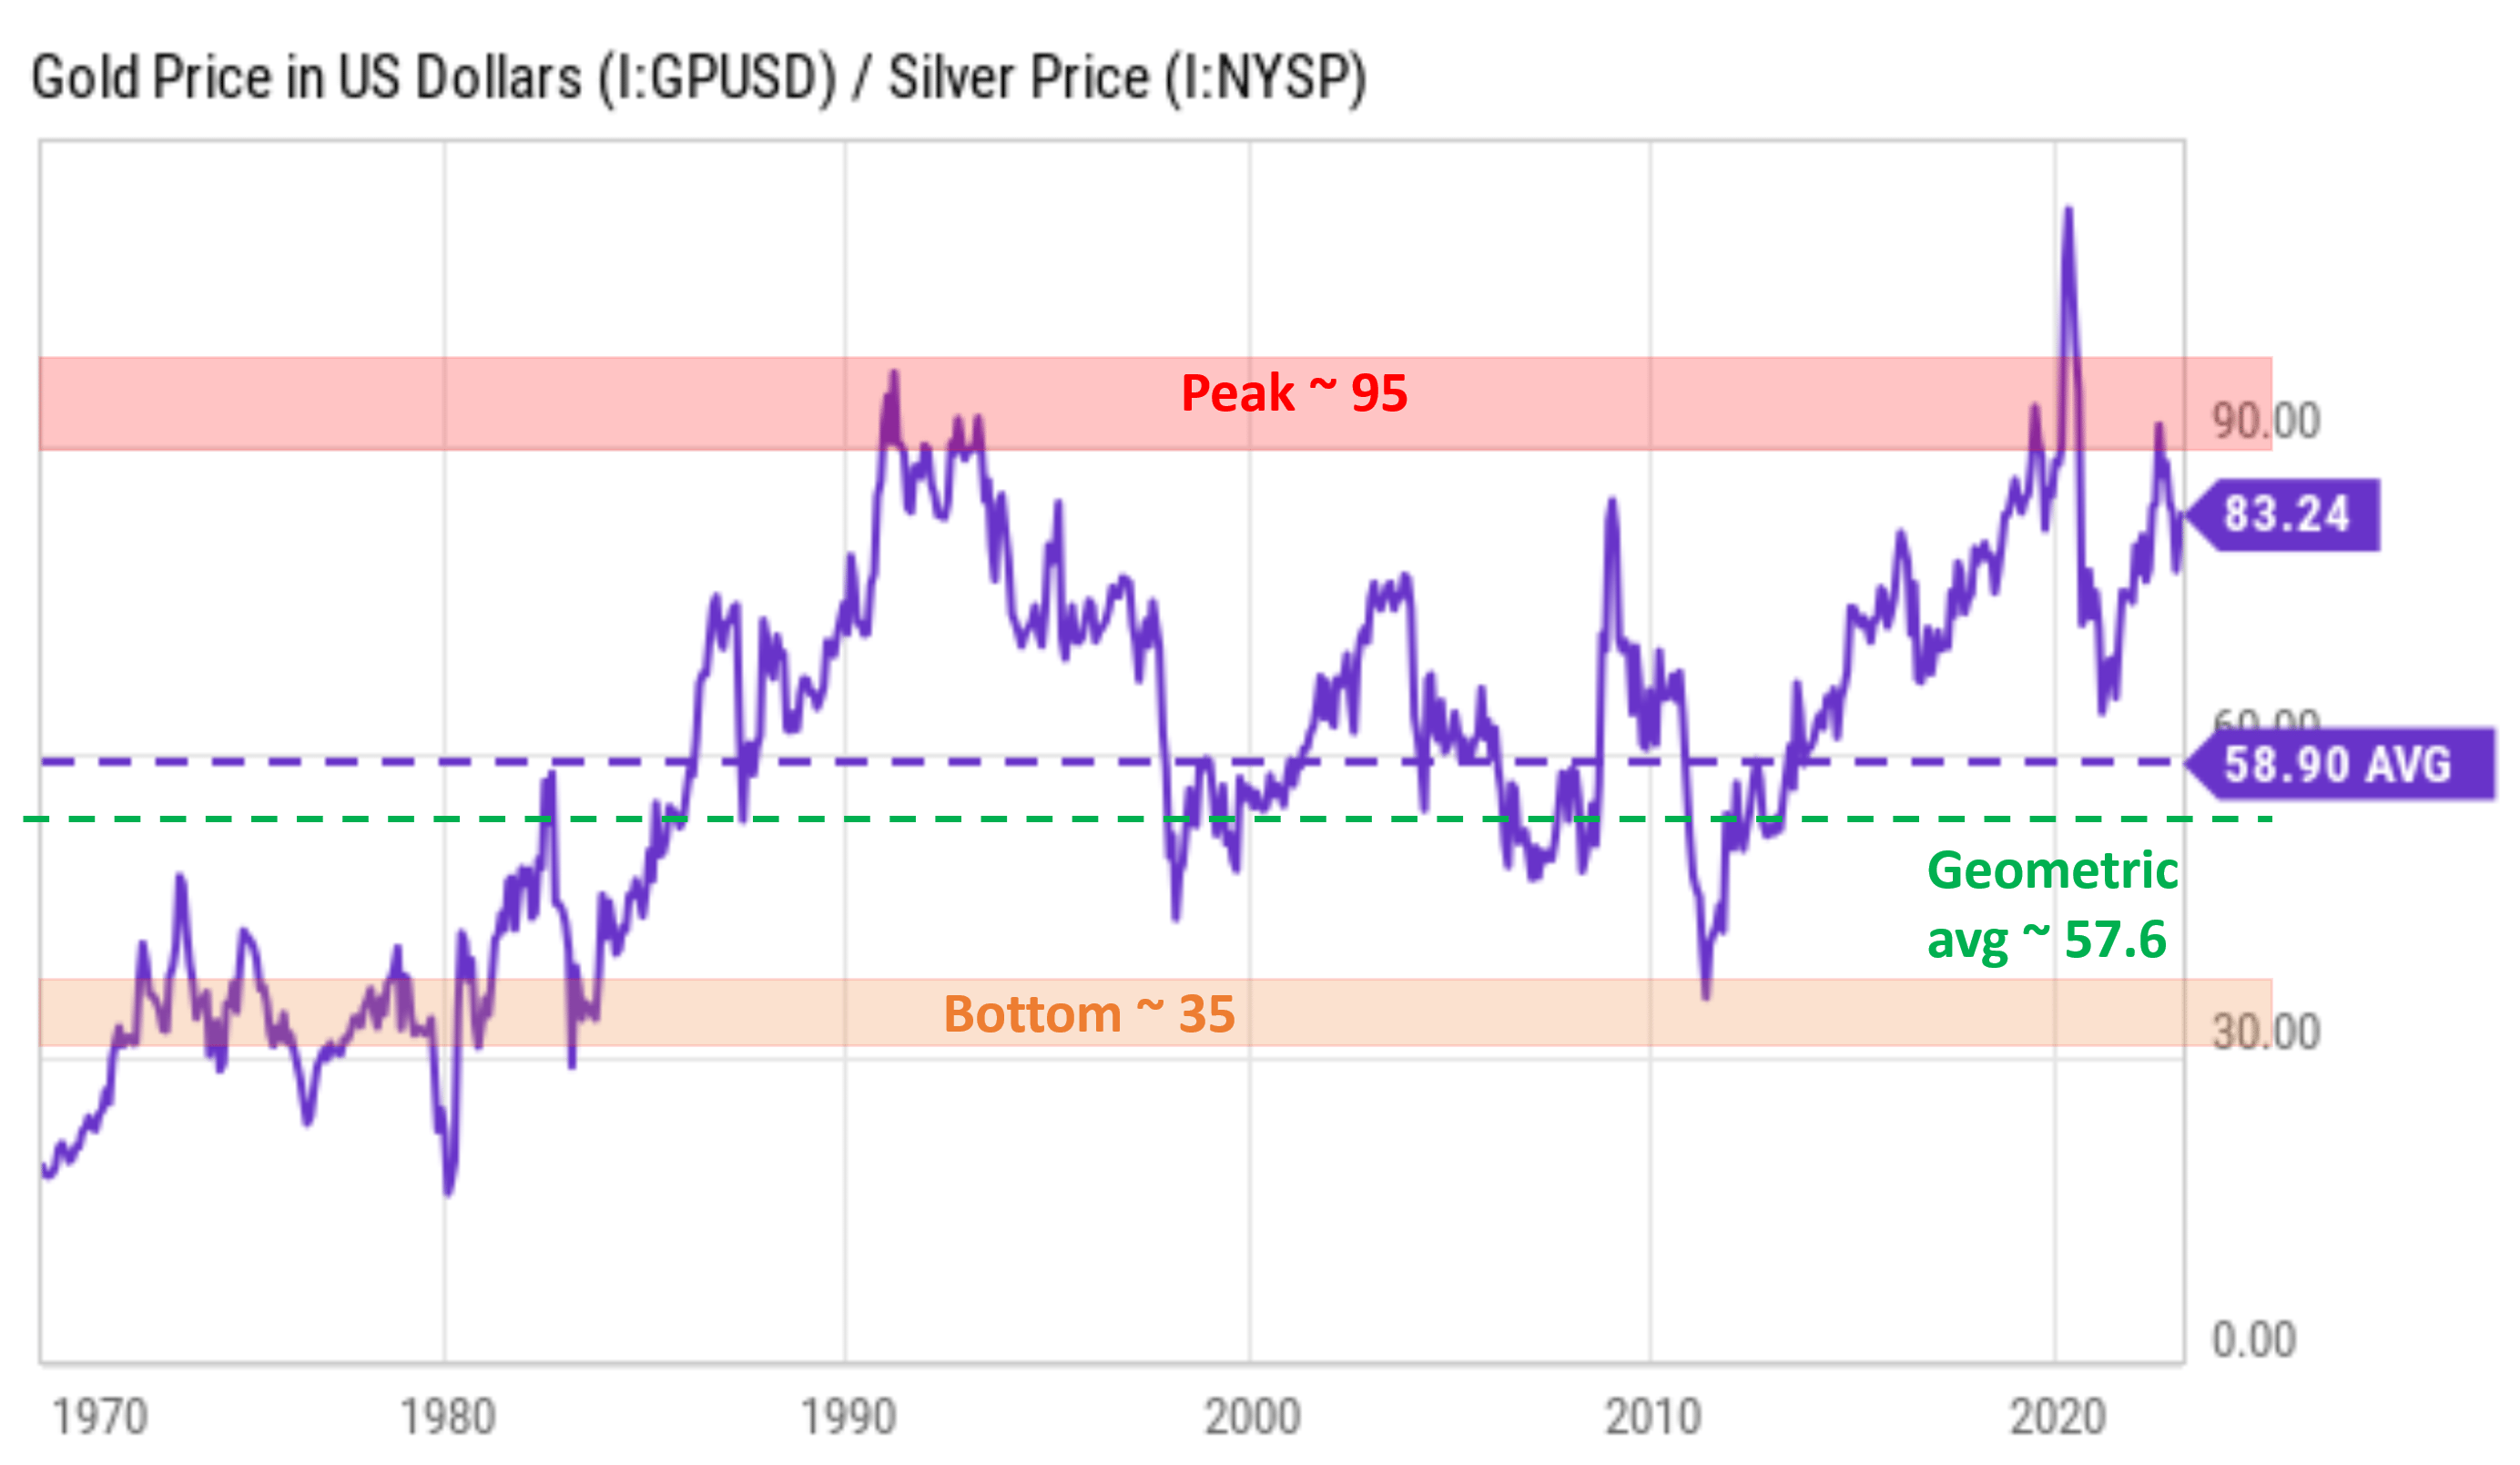
Risks and final thoughts
To reiterate, investing in GLD and SLV comes with certain drawbacks such as the lack of income/profit generation, volatility, fees, etc. Unlike stocks, real estate, or farmlands (one of Buffett's favorite examples), GLD and SLV do not generate income or profit. Moreover, GLD and SLV charge an expense ratio of 0.4% and 0.5%, respectively. To contextualize things, the expense ratios for popular equity funds and bond funds are typically only 1/10 of such fees. The fees are also the main reason why we use the Aberdeen Standard Physical Silver Shares ETF (SIVR) and iShares Gold Trust ETF (IAU) to gain exposure instead. SIVR and IAU offer comparatively lower fees at 0.3% and 0.25%, respectively.
However, under the current conditions, I see the benefits of adding more gold and silver (using any one of the funds aforementioned) to one's portfolio could outweigh the drawbacks. And this article summarizes the 3 main reasons: negative interest rates, additional hedge against ongoing uncertainties, and the gold-silver price ratio.
Let me end with our actual holdings. In our own account, we started a silver-gold trade in 2018 when the GSPR exceeded 85. The trade suffered a loss when the ratio surged to over 100 in 2020 as seen in the chart above. However, we stayed the course and accumulated more silver during that time. These trades were more than enough to offset the losses and generated respectable returns when the PR dropped sharply to as allow as ~60x in 2021. And we kept benefiting from wide PR fluctuations since then. Lastly, this blog article provides a more detailed discussion of our holdings and trading methods for readers who want to learn more about it.
Editor's Note: This article covers one or more microcap stocks. Please be aware of the risks associated with these stocks.
Join Envision Early Retirement to navigate such a turbulent market.
- Receive our best ideas, actionable and unambiguous, across multiple assets.
- Access our real-money portfolios, trade alerts, and transparent performance reporting.
- Use our proprietary allocation strategies to isolate and control risks.
We have helped our members beat S&P 500 with LOWER drawdowns despite the extreme volatilities in both the equity AND bond market.
Join for a 100% Risk-Free trial and see if our proven method can help you too. You do not need to pay for the costly lessons from the market itself.

This article was written by

** Disclosure** I am associated with Envision Research
I am an economist by training, with a focus on financial economics. After I completed my PhD, I have been professionally working as a quantitative modeler, with a focus on the mortgage market, commercial market, and the banking industry for more than a decade. And at the same time, I have been managing several investment accounts for my family for the past 15 years, going through two market crashes and an incredible long bull market in between.
My writing interests are mostly asset allocation and ETFs, particularly those related to the overall market, bonds, banking and financial sectors, and housing markets. I have been a long time SA reader, and am excited to become a more active participator in this wonderful community!
Disclosure: I/we have a beneficial long position in the shares of SIVR, IAU either through stock ownership, options, or other derivatives. I wrote this article myself, and it expresses my own opinions. I am not receiving compensation for it (other than from Seeking Alpha). I have no business relationship with any company whose stock is mentioned in this article.