IWB: Valuation Still Not Attractive

Summary
- IWB owns a portfolio of 1,000 largest stocks in the United States.
- Although slightly inferior, the fund has comparable performance to the S&P 500 Index.
- Despite the broader stock market decline last year, IWB’s valuation is still not attractive enough.
- Given macroeconomic uncertainties in 2023, investors are better off to stay on the sidelines.
Scott Olson
Introduction
Inflation has been a primary concern for the Federal Reserve last year and this year. As a result of high inflation, the Federal Reserve has opted to hike its rate aggressively last year. This caused significant stock market decline. Yet, it appears that inflation is sticky and hard to tame. How will this impact the broader market in 2023? In this article, we will look at iShares Russell 1000 ETF (NYSEARCA:IWB). The fund basically invests in 1,000 largest stocks in the United States. Compared to the S&P 500 Index, which includes only 500 large-cap stocks, IWB appears to be much more diversified and more representative of the broader economy than the S&P 500 index. We will analyze IWB and provide our insights and recommendations.
YCharts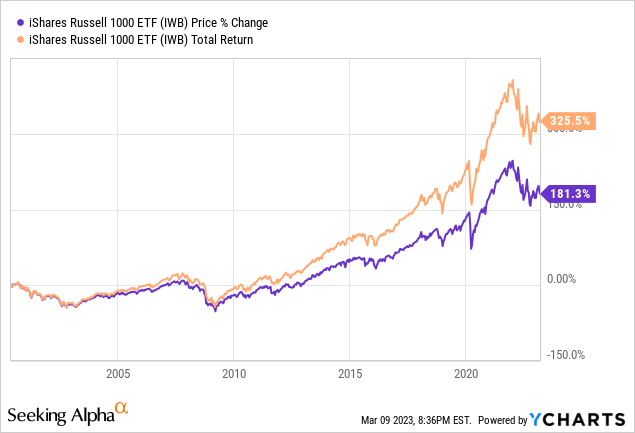
Fund Analysis
IWB has comparable results to the S&P 500 Index
IWB appears to provide a better representation of the broader market than the S&P 500 Index as IWB invests in 1,000 largest stocks in the United States. Therefore, IWB is much more diversified. Most equity ETFs suffered tremendous losses in 2022 and IWB is not without an exception. As can be seen from the chart below, the fund has since delivered a total loss of 15.42% since the beginning of 2022. In contrast, SPDR S&P 500 Trust ETF's (SPY) total loss was 14.64%. This difference appears to be quite small.
YCharts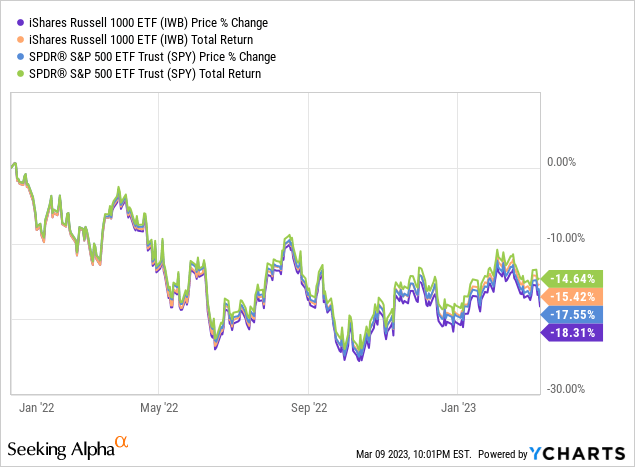
Despite the challenges faced in 2022, IWB has performed quite well in the long run. As can be seen from the chart below, IWB delivered a total return of 325.5% since its inception in May 2000. In contrast, SPY delivered a total return of 330.1%. This difference is not huge considering that the performance spans nearly 23 years. Hence, both IWB and SPY appear to have comparable results.
YCharts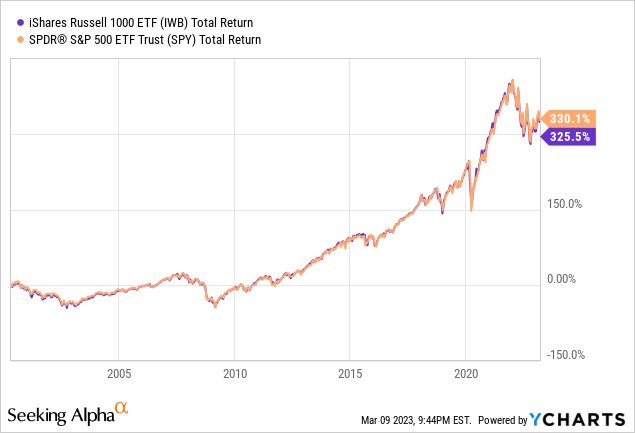
Should you be buyers of IWB?
To answer this question of whether investors should be buying IWB or not, we need to evaluate its valuation. We will evaluate IWB's valuation based on two approaches. First, we will use Warren Buffett's indicator to evaluate the valuation of the broader market. In a Forbes interview in December 2001, Warren Buffett suggests using the ratio of market capitalization to GDP to evaluate whether the broader stock market is overvalued or undervalued. If the market capitalization to GDP rate is in the range of 75% to 90%, the market's valuation is fair. If this ratio is above 90%, the stock market is likely overpriced. If this ratio is above 120%, the stock market is very expensive. Because IWB's portfolio of 1,000 largest stocks in the U.S. is a good representative of the whole market, this indicator appears to be a good fit.
Since Buffett introduced this indicator in 2001, the Federal Reserve has injected trillions of dollars into the economy, therefore the market capitalization to GDP ratio may not be accurate. A better gauge of the market is to also include the balance sheet of the Federal Reserve. Therefore, the ratio should be revised to: market capitation/(GDP + Fed Assets). Using this equation, we derive the current ratio to be 113.1%. This ratio is still way above the fair valuation range of 75% ~ 90%. IWB appears to be expensive right now.
GuruFocus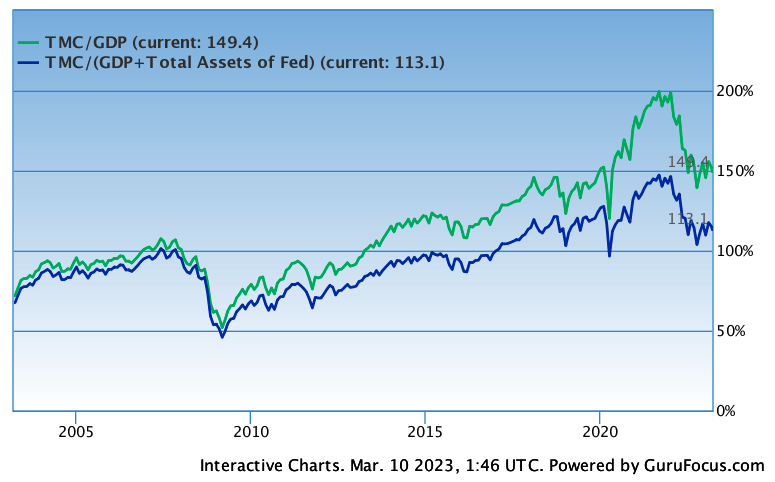
Besides the Buffett Indicator, we will also look at the broader market's valuation using the conventional approach, the P/E ratio. Since it is hard to find a historical P/E ratio chart for the Russell 1000 index, we will use the S&P 500 index instead. Given that both S&P 500 and Russell 1000 indexes have comparable market performance and a high overlap in their portfolio of stocks, this method should provide insightful data. As can be seen from the chart below, the forward P/E ratio of the S&P 500 has declined from the cyclical high reached during the midst of the pandemic to about 17.6x today. However, it is still quite elevated if we compare this ratio to the years between 2008 and 2014. The forward P/E ratio of the S&P 500 was below 15x between 2008 and 2014. Therefore, we think the current valuation of 17.6x is still not attractive.
Yardeni Research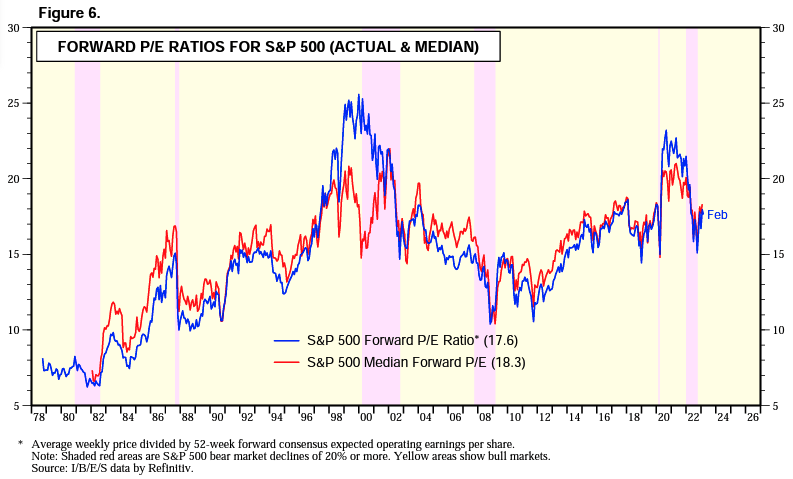
Recession will drive another round of selloffs
The elevated rate environment and higher terminal rate than expected should eventually tip the U.S. economy over to a recession. This may not happen immediately as monetary policy usually takes time to propagate through different channels of the economy. Hence, the likelihood of when this recession will happen is probably in H2 2023. As soon as the fear of recession mounts, another round of market selloffs will occur. In addition, if a recession occurs, we expect earnings revision for stocks in IWB's portfolio. This will also cause a decline in IWB's fund price.
Investor Takeaway
Though slightly inferior, IWB has comparable performance results to the S&P 500. However, its valuation is still expensive. Given that 2023 will likely be another year full of challenges, we think investors should stay on the sidelines.
This article was written by

Disclosure: I/we have no stock, option or similar derivative position in any of the companies mentioned, and no plans to initiate any such positions within the next 72 hours. I wrote this article myself, and it expresses my own opinions. I am not receiving compensation for it (other than from Seeking Alpha). I have no business relationship with any company whose stock is mentioned in this article.
Additional disclosure: This is not financial advice and that all financial investments carry risks. Investors are expected to seek financial advice from professionals before making any investment.