SPY Vs. EWC: Equal Returns After 23 Years

Summary
- Despite their geographic and cultural proximity, the US and Canadian stock markets may have the greatest differences of any two in the developed world.
- The US S&P 500 is highly diversified across technology, health care and other "new economy" sectors while MSCI Canada is dominated by oil, rail, and banks.
- Despite these differences, $10,000 invested into US or Canadian stocks in 2000 would have both turned into around $40,000 by 2023, even net of higher Canadian expenses and taxes.
- This was due to very different paths these two markets took over these past 23 years, with the US "lost decade" in the 2000s and Canada's in the 2010s.
- This article breaks down the past and future expected returns of these two benchmarks to help investors decide on allocating to US vs. Canadian stocks today.
- Looking for more investing ideas like this one? Get them exclusively at The Expat Portfolio. Learn More »
Oleksii Liskonih/iStock via Getty Images
One chart I happened to run by chance was the one below showing the total return growth of $10,000 invested in the US SPDR S&P 500 ETF (NYSEARCA:SPY) versus the same $10,000 invested in the iShares MSCI Canada ETF (NYSEARCA:EWC) from January 1st 2000 through early 2023. I was a bit surprised to see that the decade of the 2000s, when Canadian stocks outperformed US stocks, was almost perfectly cancelled out the outperformance of US stocks over Canadian stocks in the 2010s. Twitter account "ValueStockGeek" cleverly titled this observation "Choose your preferred lost decade". SPY and EWC returns have then been amazingly "neck and neck" since around January 2020 through early 2023, but I don't think it will be long before we start seeing another decade where one of these two markets again starts outperforming the other. I thought it would be worth writing out some observations in this article outlining:
- How different the US and Canadian stock benchmarks have been and still are,
- Some drivers of SPY vs EWC returns over these past two decades, and
- What factors I'm looking at when deciding how much I want to allocate to US vs Canadian stocks today.
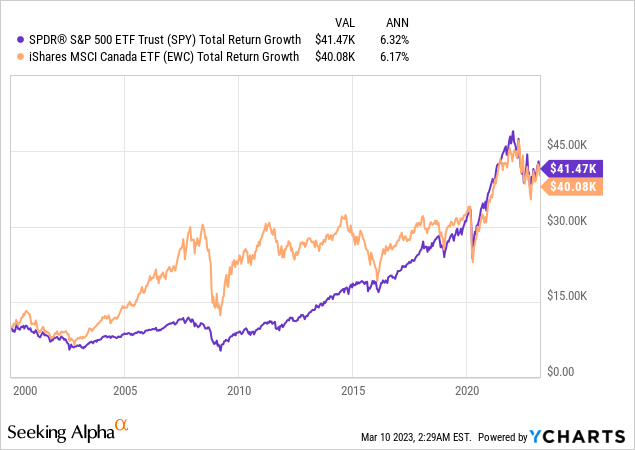
That 0.15% per year return difference over this 23-year period is actually smaller than two other factors, which long-term investors should consider even more significant:
- Fees: these returns are net of fund expenses, and EWC's 0.50% per year expense ratio exceeds SPY's 0.09% per year expense ratio by more than twice this 0.15% per year difference, and
- Taxes: EWC's returns are net of a 15% withholding tax Canada charges on dividends sent to non-retirement accounts under the US-Canada tax treaty, and US taxable accounts may receive a tax credit for this. SPY's returns in the above chart, on the other hand, are gross of any taxes on dividends.
Together, this means if I directly held a portfolio of Canadian stocks similar to EWC, I might have actually done slightly better than directly holding a portfolio of US stocks similar to SPY, both in taxable and retirement accounts.
S&P 500 vs MSCI Canada: Sector Exposure
As mentioned in my summary bullets, I find the US and Canadian stock markets to be about as different as any two developed markets can be from each other. The US is by far the world's largest, most valuable, and most diverse stock market, currently making up almost 60% of the Vanguard Total World Stock Index ETF (VT), with SPY alone covering about half the weight of VT. Canada, on the other hand, only makes up about 3% of VT, and over 1/3 of EWC is in financials, and these financials tend to be highly exposed to Canada's next three largest sectors: oil, railroads, and mining. In that way, EWC's top-heavy exposure to natural resources and financials make it look more like the stock index of a market like Peru, Saudi Arabia, or Indonesia than those of Germany or Japan.
This next chart shows how EWC's returns more closely matched those of just the US energy sector, as measured by the Energy Select Sector SPDR ETF (XLE), both in their "glorious" 2000s and their "lost decade" of the 2010s. Oddly enough, while EWC's returns seem to have more closely been matching those of SPY since January 2020, EWC and XLE seem to have started moving farther apart, likely due to unique shocks affecting oil markets in these three years which haven't benefitted Canada's other sectors as much.
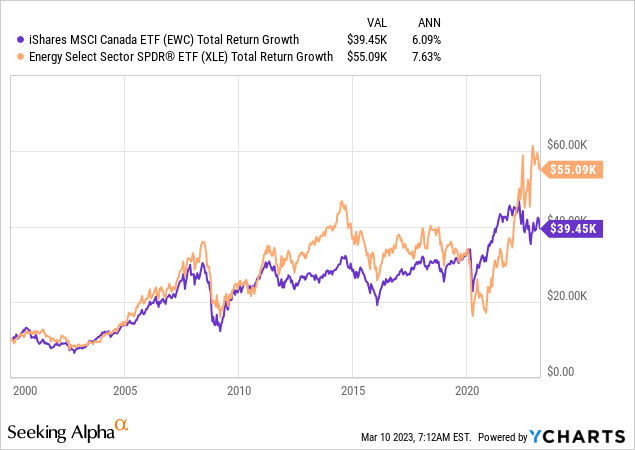
So clearly it might make sense to allocate more to Canadian stocks if we either want to get more energy exposure, or if we think Canadian stocks are especially well-valued relative to non-Canadian stocks in their respective sectors. For that, let's take a quick look at valuation metrics in this next section on return drivers.
SPY vs EWC: High-level Valuation
My favorite metric for comparing the relative valuation of two whole countries' stock markets is the cyclically adjusted price-to-earnings or CAPE Ratio. I get updated charts on these like the one below from Barclays. The key metrics I like to look at for the start and end dates of the 23-year period in this article are:
- In 2000 the US CAPE was at 44.5, Canada's was at 42.0
- At the start of 2023: the US CAPE is at 27.5, Canada's is 20.9
Barclays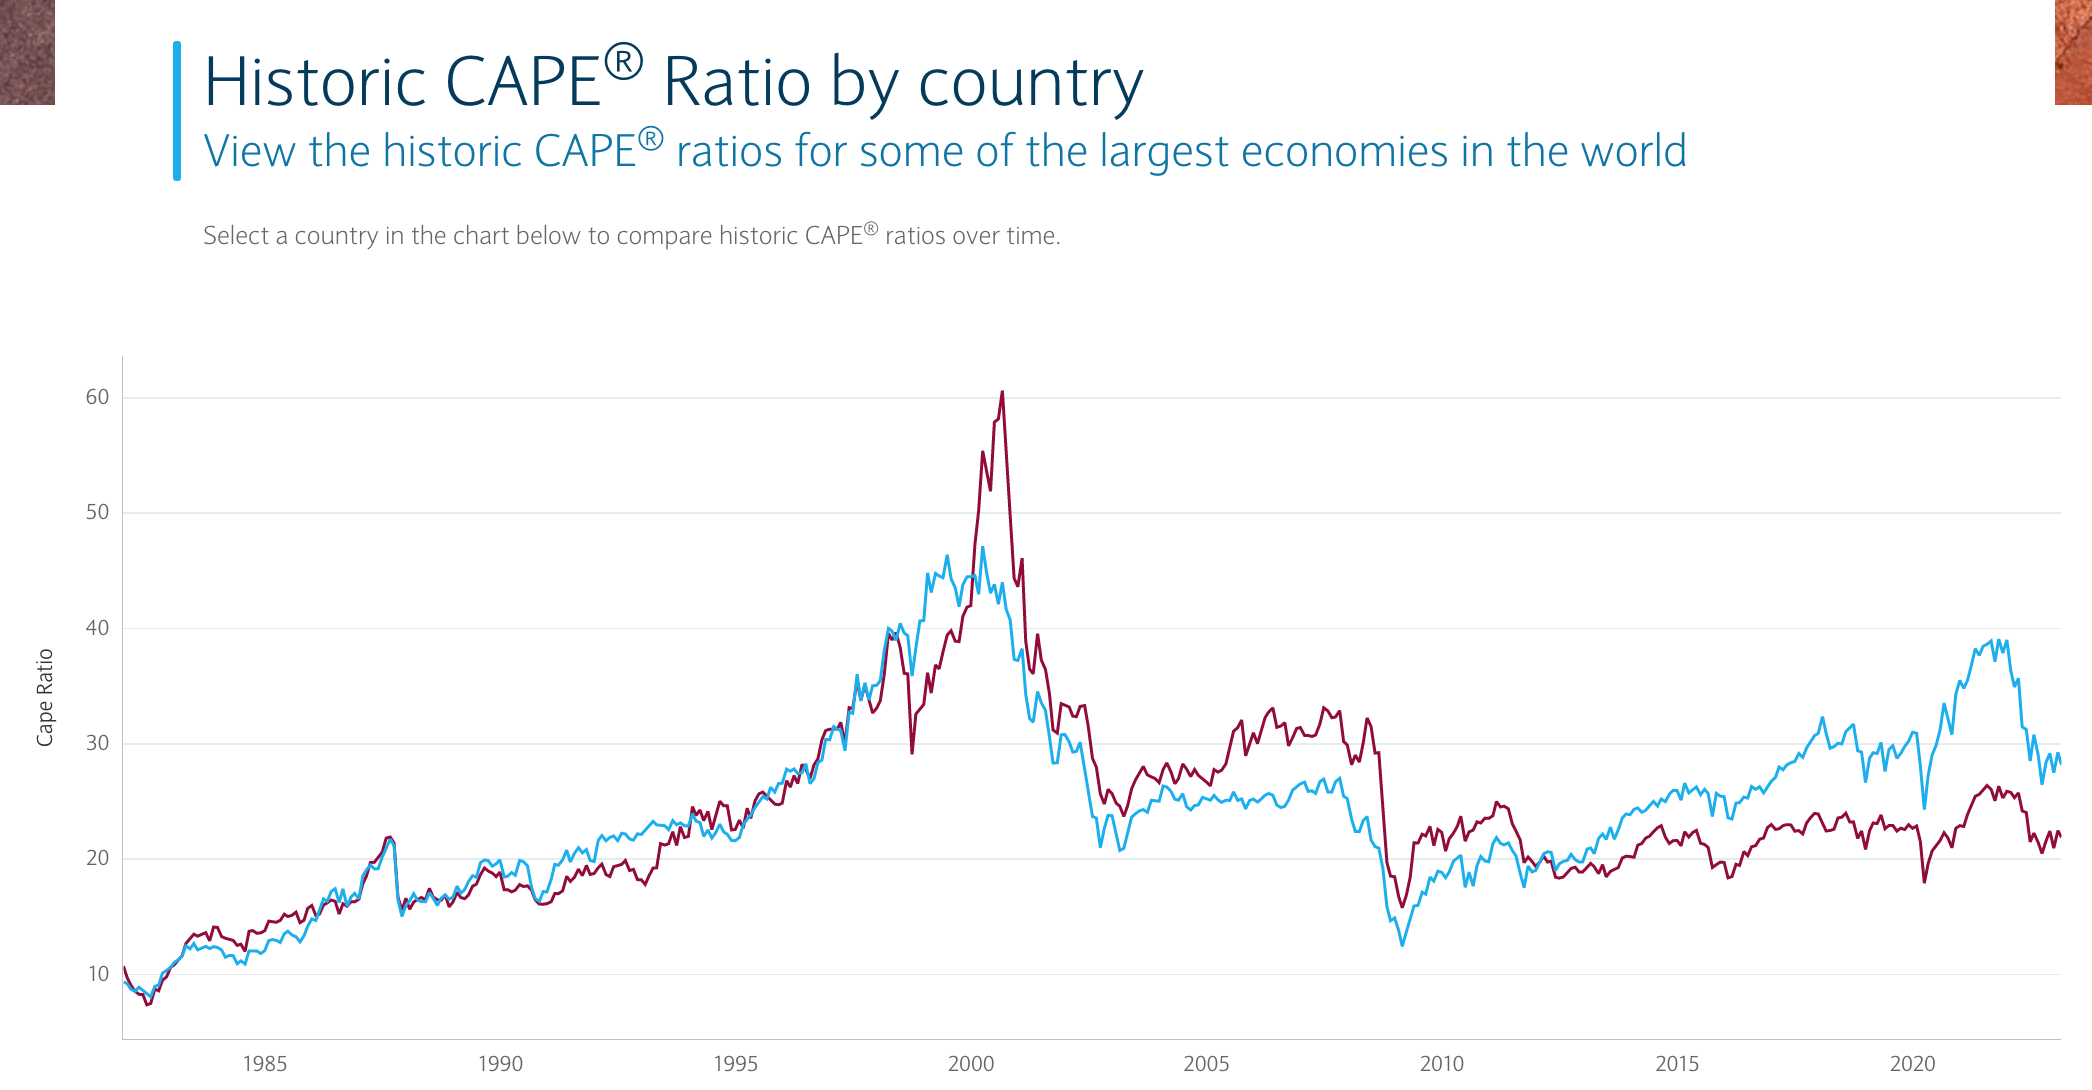
The contraction of CAPE ratios from the 40s to the 20s over the past 23 years is one factor that dragged the average rate of return for SPY and EWC over this period down to around 6%, well below what many expect as a long-term rate of return from stocks. What I found especially remarkable here though is that SPY and EWC delivered about the same return over this period even though Canada's CAPE ratio declined by significantly more than the US's over this period. This would be due to either EWC paying out higher distributions than SPY over this period, or by EWC having higher average inflation-adjusted earnings growth over this period, or a combination of the two. As an investor, I don't really care which of these two drivers gives me my return: I still see Canadian stocks as well able to continue delivering high-quality earnings, and those earnings now seem to be for sale at a significantly cheaper price in Canada than in the US.
As another check on the relative cheapness of Canadian vs. US equities, I also checked this below chart from Yardeni Research. This one shows how the forward PE ratios of US and Canadian equities were both around 25 in 2000, while now the US trades at 17.9x forward earnings while Canada trades at 12.5x. Much of the outperformance of SPY over EWC over the past decade again seems to be due to SPY's valuation multiple expanding from being cheaper than EWC's in 2010 to much more expensive than EWC's in 2023.
Yardeni Research Inc.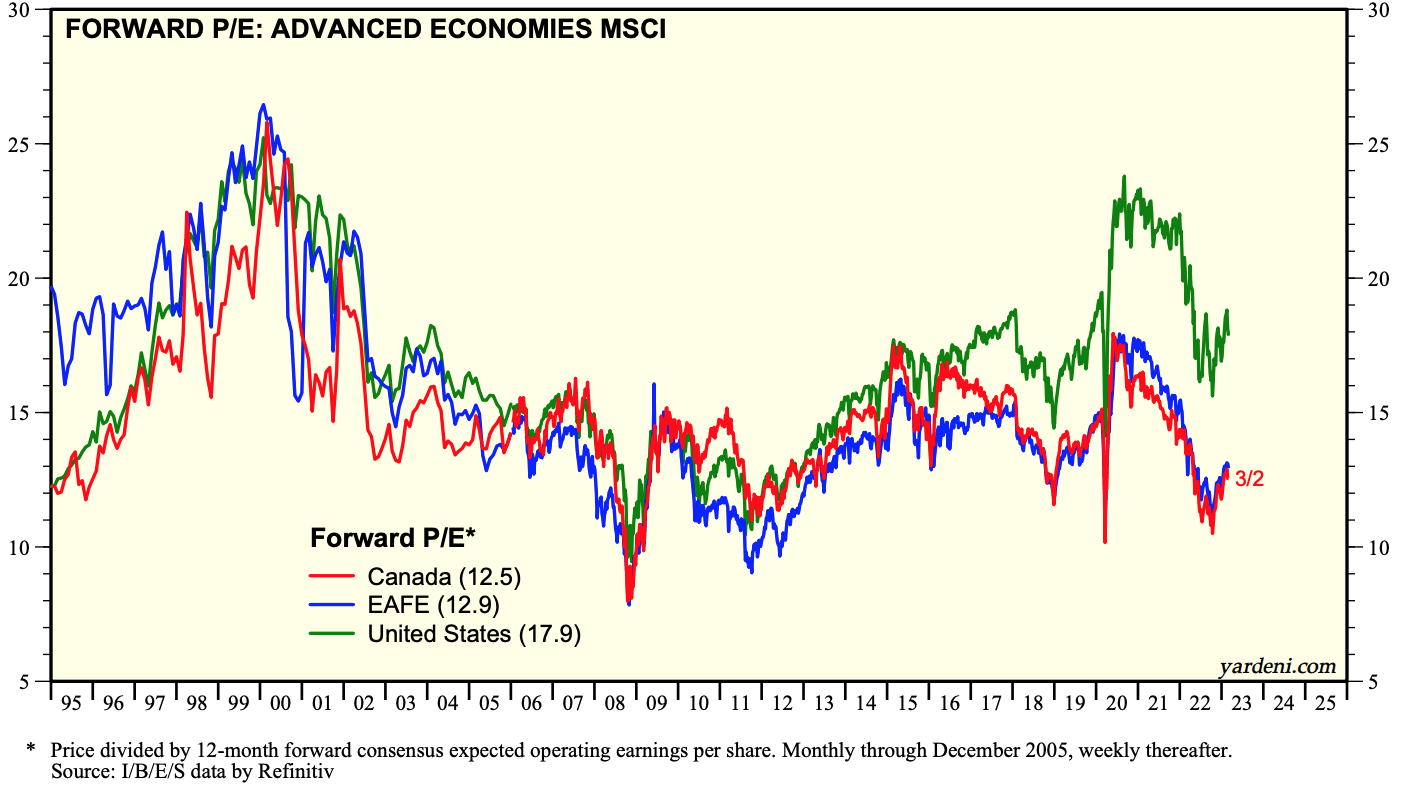
SPY vs EWC: Valuations by Sector
For a comparison of valuation multiples between two markets as different as the US and Canada, I find it worth at least going down to the sector level and comparing sector by sector. Here, I simply look at the median forward PE ratio of stocks in each sector, which is more useful to those of us shopping for stocks in each market and sector than for those considering SPY vs. EWC as ETFs. According to the below table, it seems the median stock in EWC's big energy, industrial and materials sectors are actually trading at more expensive multiples than those in SPY's corresponding sectors. On the other hand, the median financial, information technology, and consumer stock seems to be available at a cheaper multiple in Canada than in the US. Two specific names I own from these cheaper sectors are The Toronto Dominion Bank (TD) at 9.6x forward earnings and convenience store operator Alimentation Couche-Tard Inc. (ATD:CA) at 15.9x forward earnings. Neither of these names are likely to promise high growth anywhere near what one might expect from a FANG stock, but they seem like quality names at more reasonable prices than the average US stock.
Koyfin, author's calculation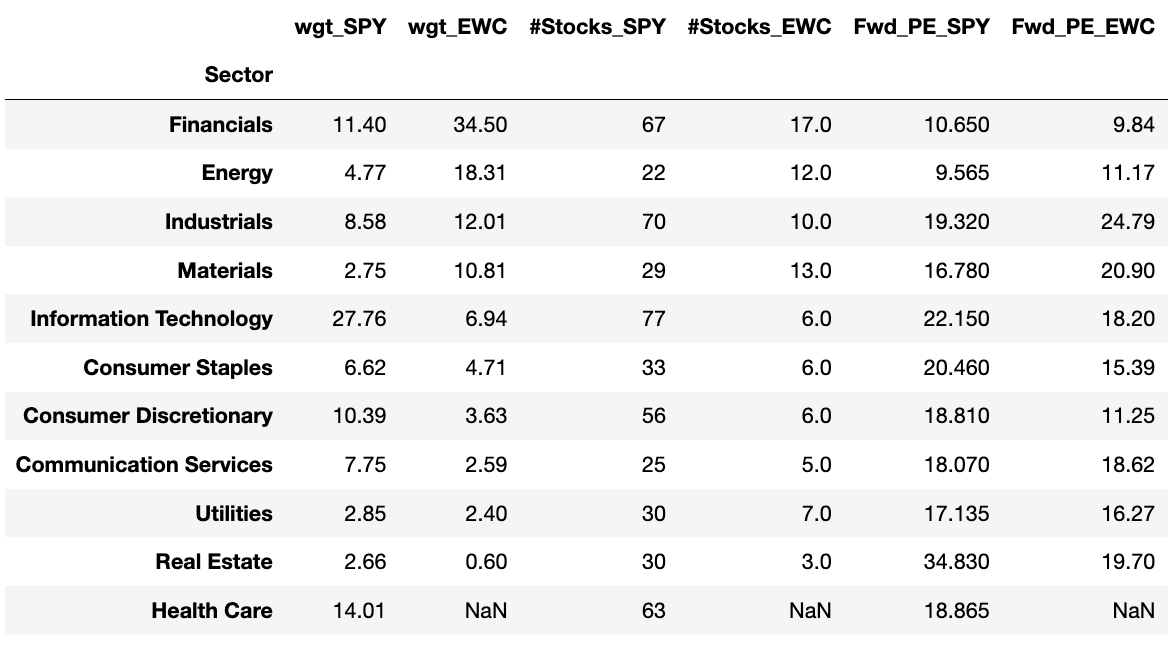
SPY vs EWC: Going Forward
As I've mentioned in many articles, including my most recent review of the S&P 500, my biggest concern with buying SPY is that I still find it too expensive relative to other stock markets around the world, or even relative to smaller US stocks. By contrast, EWC seems far more attractively priced after its latest "lost decade" of the 2010s, and even after its post-COVID run-up, but I continue asking how much of EWC's current cheapness could be due to it having a much higher share of "value traps" than in SPY. I think the time to load up on natural resource companies was in late 2021, when I was loading up on BHP, but now I would be looking into the holdings of EWC more for its financial and consumer names than for its energy or mining exposure. While I like that there seem to be cheaper stock opportunities north of SPY's border in EWC, I don't think either ETF is worth buying as is, but rather, prefer to pick my own names like TD and ATD:CA from EWC's holdings.
Editor's Note: This article discusses one or more securities that do not trade on a major U.S. exchange. Please be aware of the risks associated with these stocks.
Non-US markets cover 75% of the world's economy, 90% of IMF expected GDP growth, and 95% of the world population. That's most of my time and money is invested outside the US, where I have lived most of my life and find opportunities to share with you. See how to improve your international stock strategy with your free trial to The Expat Portfolio.
This article was written by

Tariq Dennison TEP runs a registered investment adviser focused on international clients and portfolio strategies. His marketplace service "The Expat Portfolio" shares his on-the-ground experience as an expat investing in diverse foreign markets. Tariq is the author of the book "Invest Outside the Box: Understanding Different Asset Classes and Strategies". He lives in Central Europe, and teaches two classes at the Masters in Finance program at ESSEC Business School in Singapore.
Disclosure: I/we have a beneficial long position in the shares of SPY either through stock ownership, options, or other derivatives. I wrote this article myself, and it expresses my own opinions. I am not receiving compensation for it (other than from Seeking Alpha). I have no business relationship with any company whose stock is mentioned in this article.
Additional disclosure: We are also long TD and ATD:CA.