SPY: Triggers Our Tipping Point From Bull To Bear (Technical Analysis)

Summary
- This is a technical analysis article. This enormous bounce in SPDR S&P 500 Trust ETF from October, with its “golden cross” and January Buy Signals, has triggered our tipping point.
- This bullish bounce in a bear market looks very tired, and the chart below shows the “tipping point” profile of a bullish move turning bearish.
- In our last article, we pointed out the formation of a “bull trap” and now you can see that trap has snapped shut.
- The bullish attempts to get back to $418 and move higher have failed. Price never even made it to $408.
- The latest attempts to stay above $400 have failed. Now, the SPY has formed a short-term downtrend of lower-lows and lower-highs, triggering our tipping point at $388.
- This idea was discussed in more depth with members of my private investing community, Daily Index Beaters. Learn More »
taylanibrahim/iStock via Getty Images
This bullish bounce up in the market, as represented by SPDR S&P 500 Trust ETF (NYSEARCA:SPY), since October has run out of momentum and tipped over from uptrend to downtrend. We think that the "tipping point" is at $388. The SPY just dived from $401 on Thursday and triggered our tipping point signal on Friday.
Since October, the SPY has had a bullish bounce in a bear market. The economy was strong. Consumers still had plenty of spending power. There were many more jobs than job-seekers and wages were increasing.
According to the "Stock Trader's Almanac," there were three statistically important Buy Signals in January. Technical analysis crowned the move up with the "golden cross" which occurs when the 50-day moving average bullishly crosses above the 200-day bear market downtrend.
Unfortunately, that golden cross does not come with a guarantee. If it is only a bounce in a bear market, the bounce will end with a tipping point that targets a reversal of the golden cross. We think that the tipping point is $388 as price breaks below the 200-day moving average. Our long-term view is that this bear market has not put a bottom in place yet. That usually happens after the recession starts. The market does not see any recession in sight. We think that the SPY bottoms in October.
The market is just beginning to feel the shock treatment by the Fed that rates are going up and not down in 2023. The banks were just hit by shocking news and an enormous drop in price by Silicon Valley's SVB Financial Group (SIVB). That triggered a selloff in Financials on Thursday.
Unemployment claims were higher than expected. Inflation is not falling as quickly as expected. The Fed is raising rates higher. Friday's payroll data was hotter than expected. In other words, Wall Street's positive narrative for the market is falling apart piece by piece. The SPY's dive from $401 to $393 on Thursday confirmed the switch from uptrend to downtrend in the SPY. You can see the change in trend on the daily chart below.
As long as the market fails to see any recession in the future, the longer this bounce in a bear market will last. However, as soon as signs of a coming recession appear, the bounce comes to an end and the change in trend appears on the chart. With a bank like SIVB taking a dive, the financials taking a hit and the promise of higher interest rates by the Fed, the SPY suddenly is realizing there might be a recession coming. The dramatic rise in interest rates is disruptive. The SPY was ignoring the disruptions in real estate, home building, and interest-rate sensitive parts of the economy. But when it spreads to banks, that cannot be ignored so easily and that is what is taking the SPY down, triggering the tipping point. We think the tipping point is $388. That is when the SPY recognizes the end of this bounce that topped out at $418.
As you can see on the daily chart below, we have drawn the red arrow downtrend above price. This is created by the price pattern of lower-highs and lower-lows. You can see this in the price movements under this downtrend arrow. Price is looking for a lower-low after Thursday's dive in price.
Here is the daily chart showing the red arrow downtrend in price and price breakdown below the blue uptrend line:
Bullish Bounce Turns Bearish (StockCharts.com)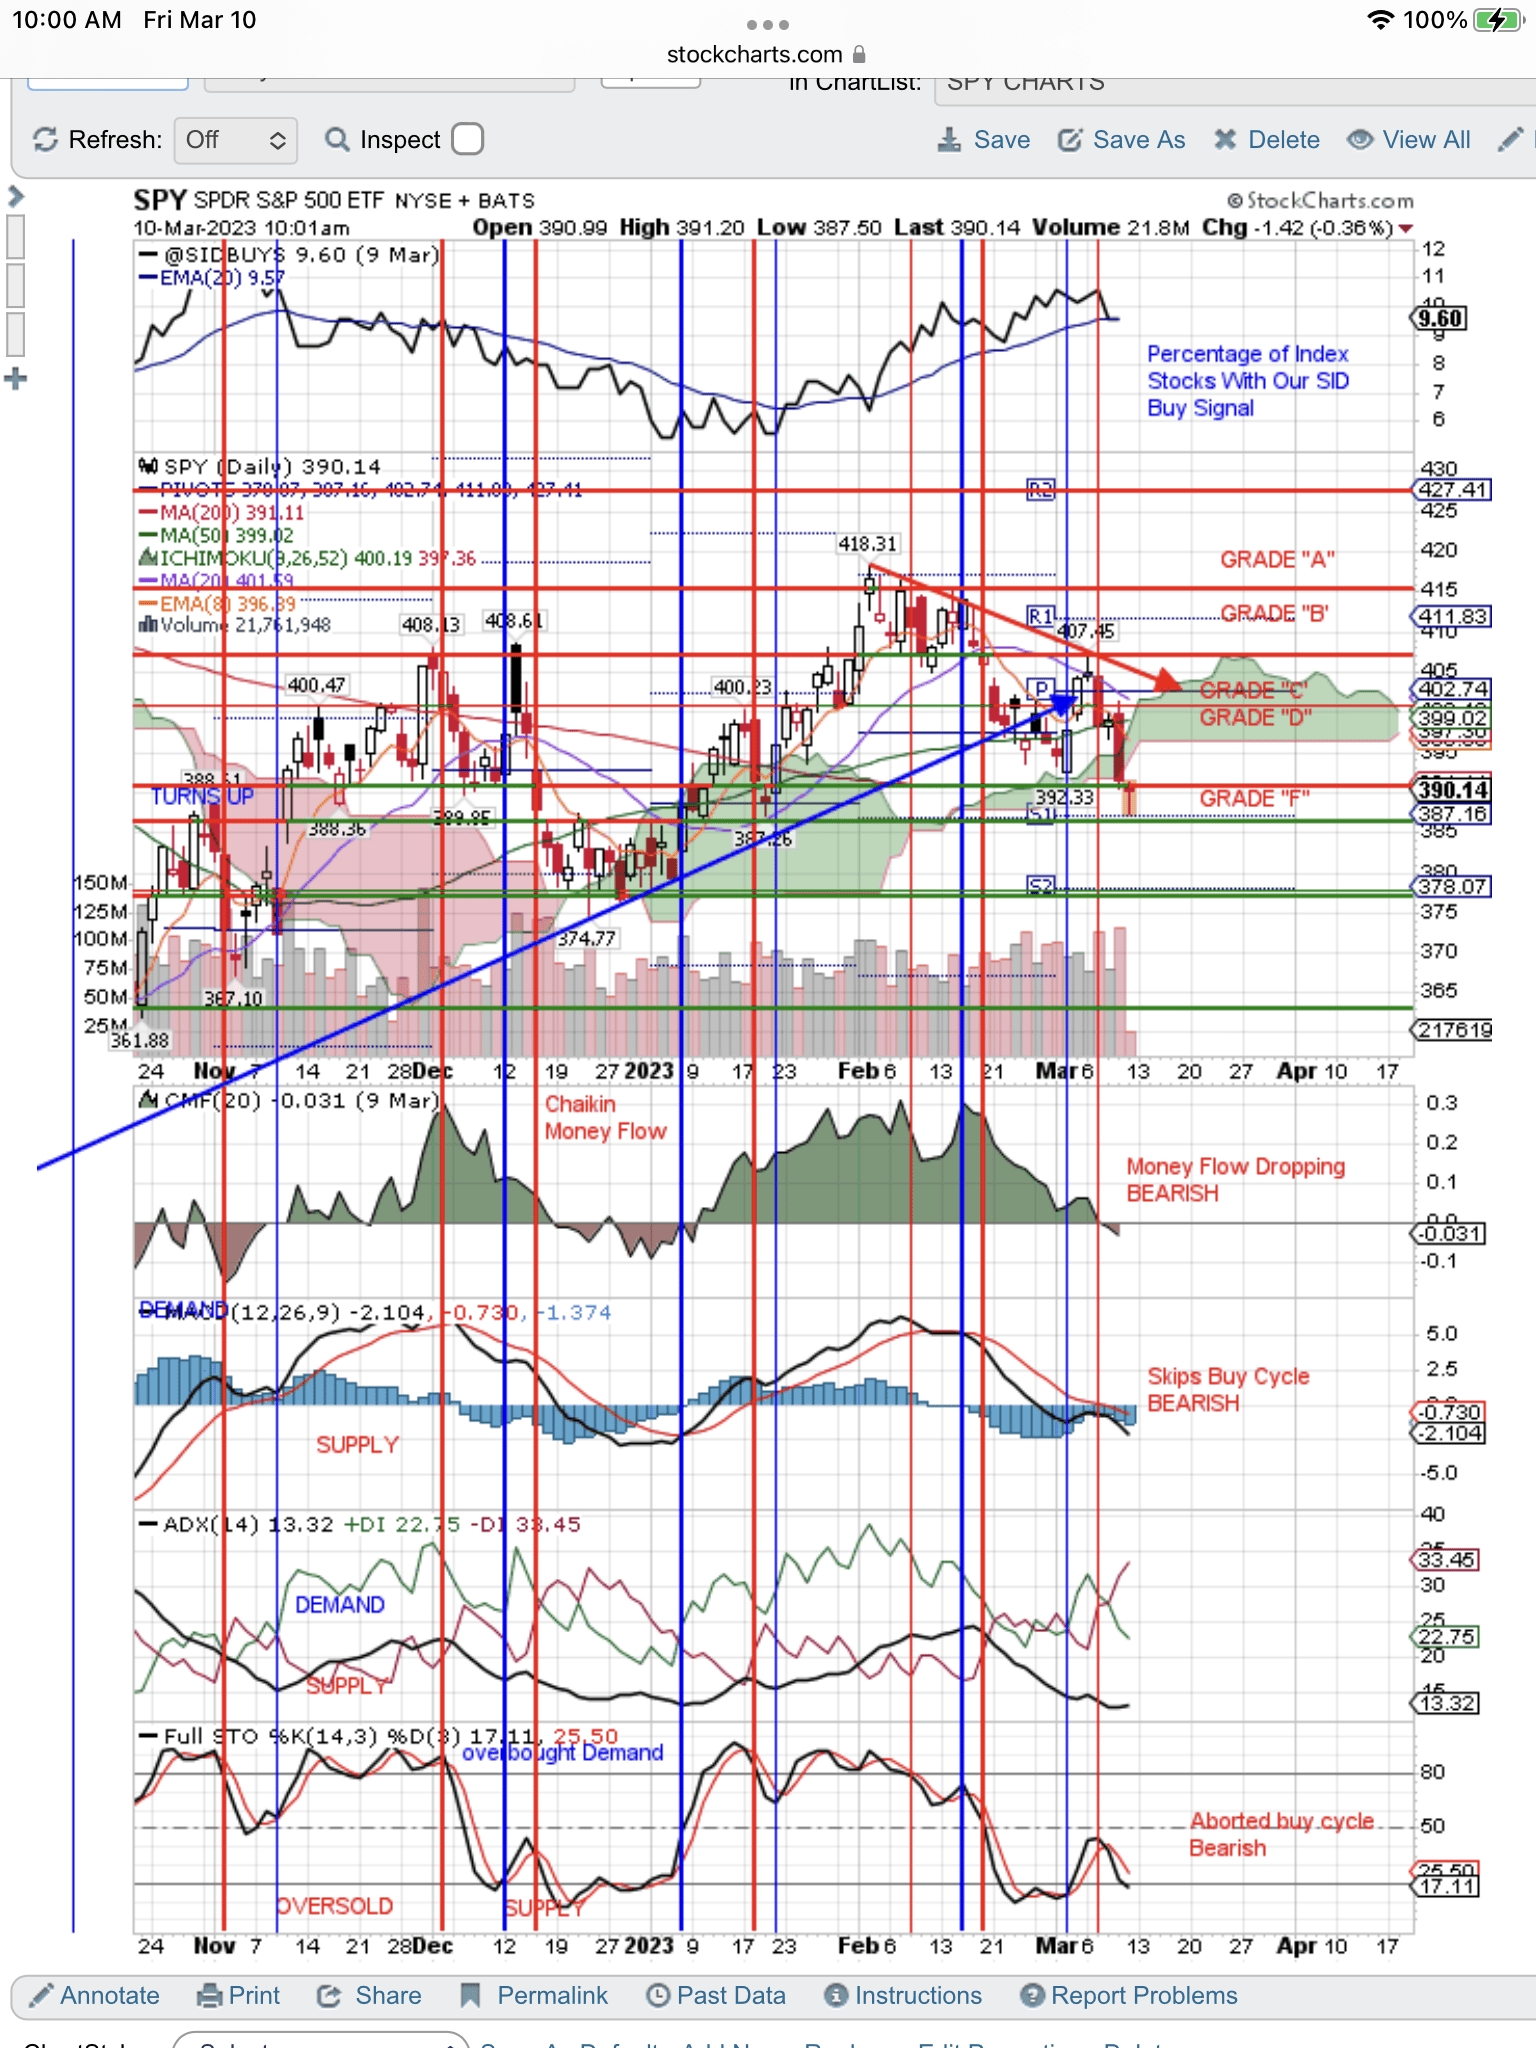
In the above chart, notice the vertical, red line, Sell Signal triggered by the signal at the bottom of the chart. All the technical signals on this chart are bearish.
Another chart we like to look at is an easier picture to see of this breakdown in the SPY. The breakdown is shown with a column of "Os" going down on the ride side of the chart. You can see the breakdown below the blue line. You can see the red "O" just added because price broke below $388.
Red "O" Triggers Our $388 Tipping Point (StockCharts.com)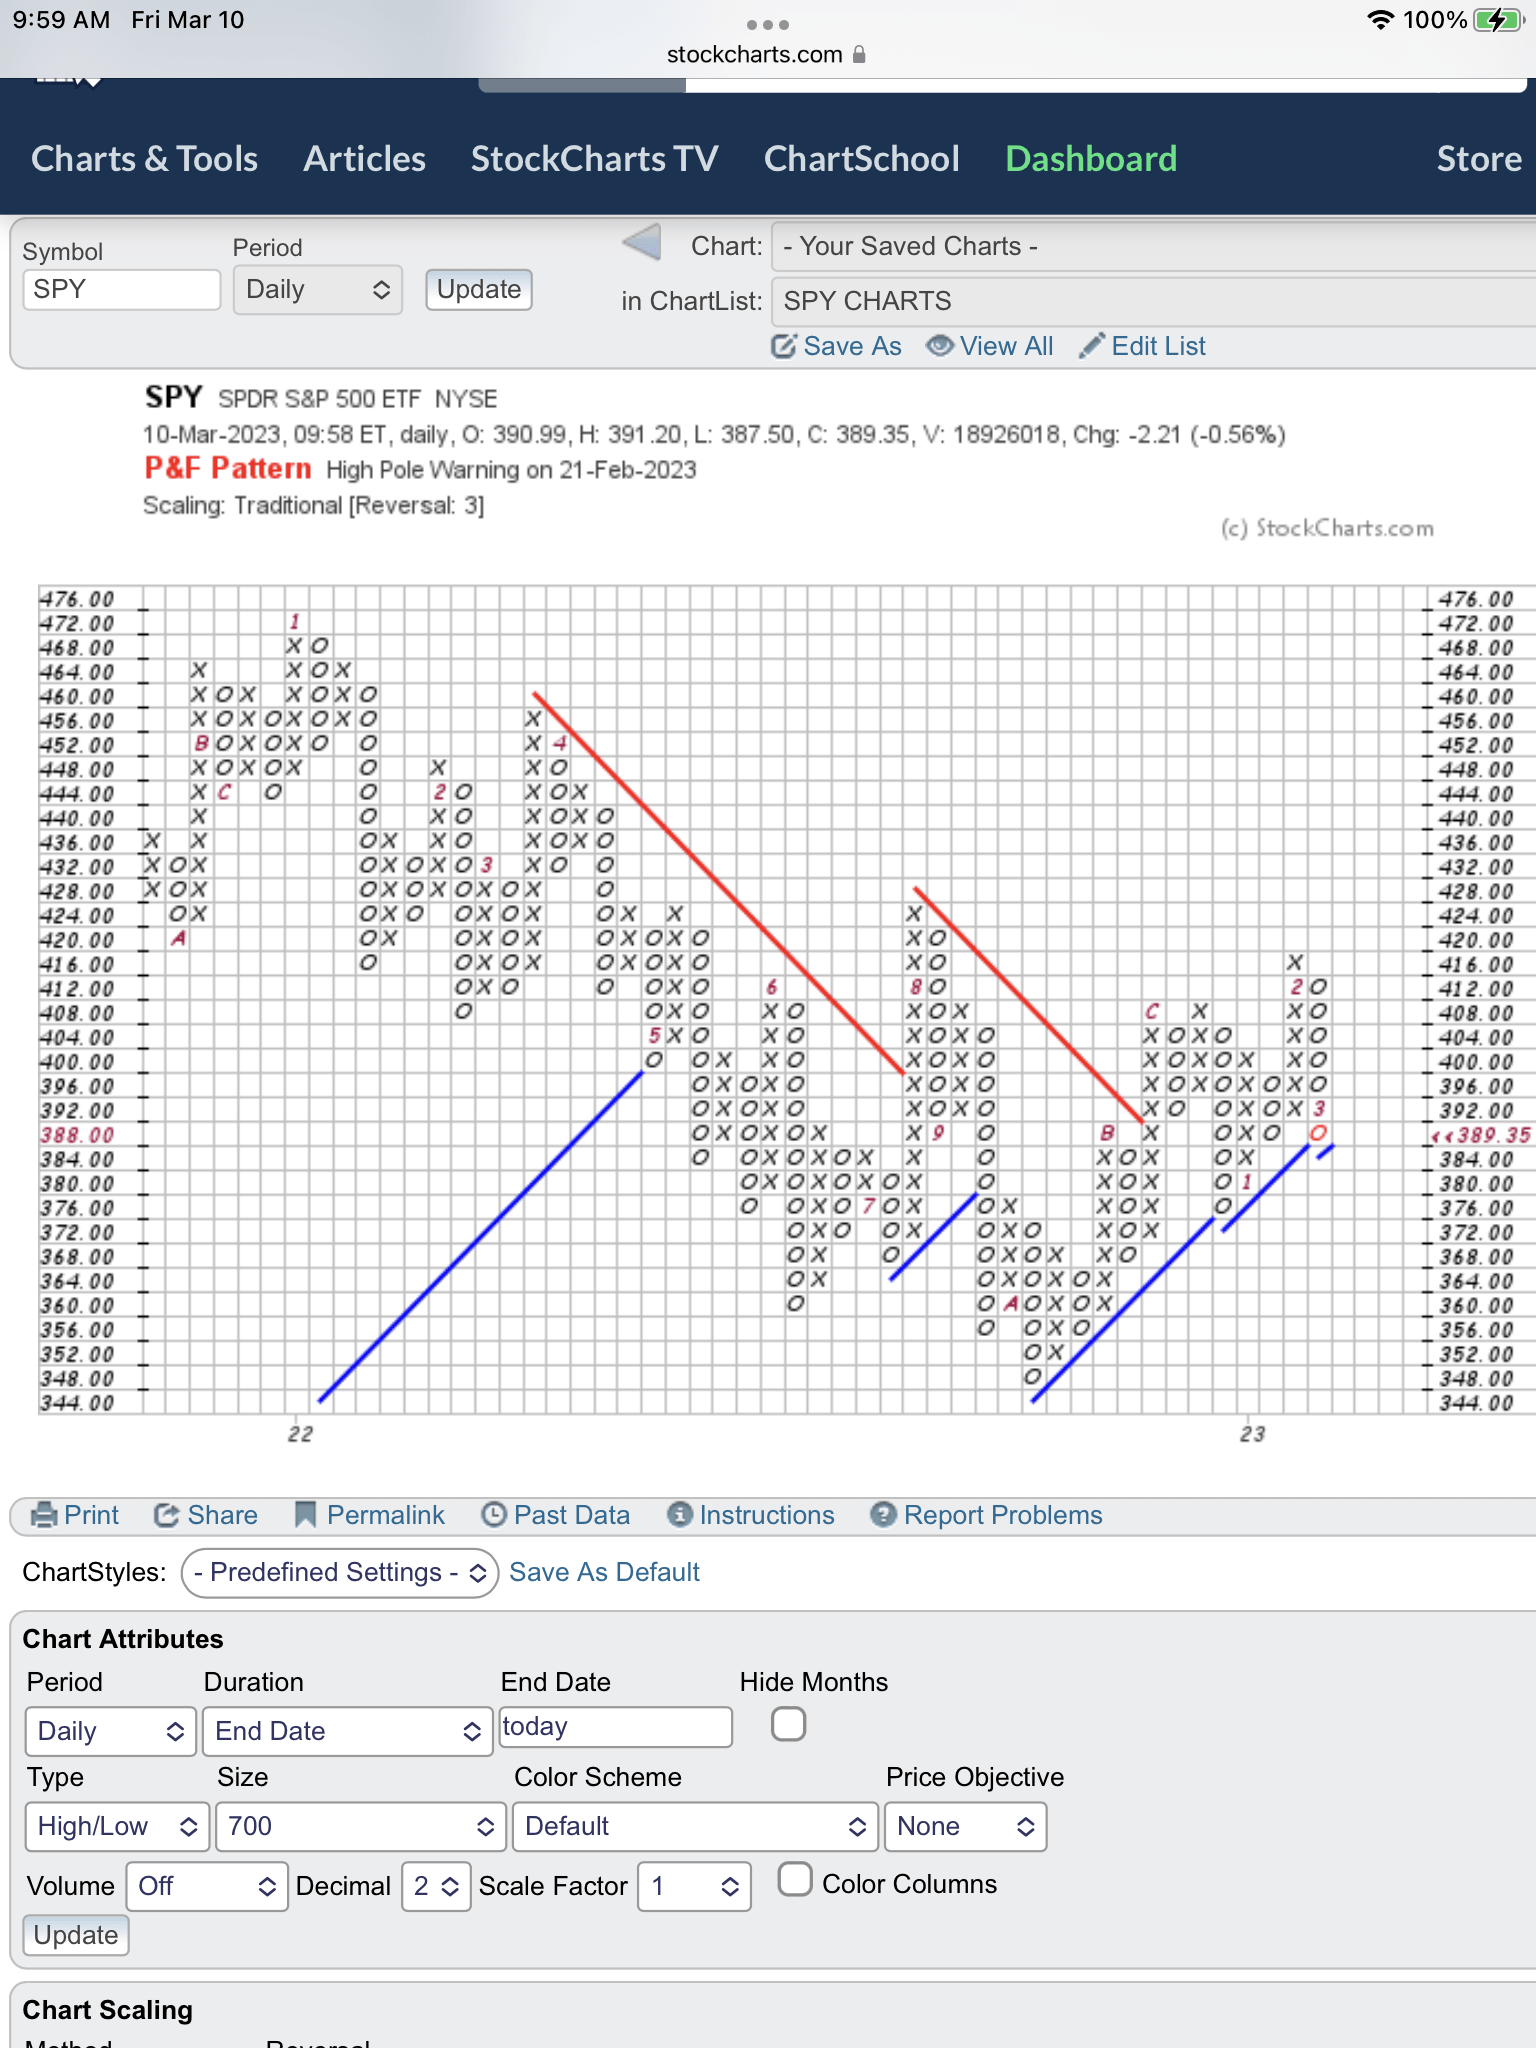

Use our free, 30-day training program to become a successful trader or investor. Join us on Zoom to discuss your questions.
This article was written by

Tom’s book "Successful Stock Signals for Traders and Portfolio Managers" is available on StockCharts.com and Amazon. The StocksInDemand.com system is designed to make money using a combined fundamental and technical grade for each stock. Tom received his MBA in Accounting from St. John's University, where he taught courses on the stock market. He marketed fundamental research, technical research and quantitative research to professional portfolio managers during his Wall St. career.
Disclosure: I/we have a beneficial short position in the shares of SPY either through stock ownership, options, or other derivatives. I wrote this article myself, and it expresses my own opinions. I am not receiving compensation for it (other than from Seeking Alpha). I have no business relationship with any company whose stock is mentioned in this article.
Additional disclosure: Disclaimer: We are not investment advisers and we never recommend stocks or securities. Nothing on this website, in our reports and emails or in our meetings is a recommendation to buy or sell any security. Options are especially risky and most options expire worthless. You need to do your own due diligence and consult with a professional financial advisor before acting on any information provided on this website or at our meetings. Our meetings and website are for educational purposes only. Any content sent to you is sent out as any newspaper or newsletter, is for educational purposes and never should be taken as a recommendation to buy or sell any security. The use of terms buy, sell or hold are not recommendations to buy sell or hold any security. They are used here strictly for educational purposes. Analysts price targets are educated guesses and can be wrong. Computer systems like ours, using analyst targets therefore can be wrong. Chart buy and sell signals can be wrong and are u sed by our system which can then be wrong. Therefore you must always do your own due diligence before buying or selling any stock discussed here. Past results may never be repeated again and are no indication of how well our SID score Buy signal will do in the future. We assume no liability for erroneous data or opinions you hear at our meetings and see on this website or its emails and reports. You use this website and our meetings at your own risk.