SCHB: Wait And See Is The Best Approach For Now

Summary
- SCHB invests in 2,500 largest stocks in the United States.
- The fund has comparable performance to the S&P 500 index.
- SCHB’s valuation is still not attractive and a recession may not be far.
franckreporter
Introduction
The Federal Reserve's aggressive rate hike last year has impacted both the bond market and equity market negatively. Yet, it appears that there may be more rate hikes to go. Will the market continue to decline in 2023? In this article, we will look at Schwab U.S. Broad Market ETF (NYSEARCA:SCHB), a fund that basically owns a portfolio of 2,500 largest publicly traded companies in the United States. Therefore, it is a good representation of the broader market. We will analyze SCHB and see if this is a good investment choice in 2023.
ETF Overview
SCHB provides an alternative to the S&P 500 index as it has comparable results and a much more diversified portfolio. However, its valuation appears to be expensive based on the Buffett Indicator. Given that 2023 is going to be a year of uncertainty and a recession may be on the horizon, we think investors may want to apply a wait and see approach.
YCharts
Fund Analysis
SCHB is a good alternative to the S&P 500 index
SCHB is a more diversified investment vehicle than the S&P 500 index as it includes 2,500 largest stocks in the United States. On the other hand, the S&P 500 index only includes 500 stocks. Therefore, SCHB is a better representation of the broader market than the S&P 500 index. Like S&P 500 index, SCHB also had an abysmal 2022. The fund delivered a total loss of nearly 25% from the peak in the beginning of 2022 to the trough reached in October 2022. The rebound in late 2022 helped narrow the loss to 15.6%. In contrast, S&P 500's total loss since the beginning of 2022 was about 14.8%. The difference is not a lot.
YCharts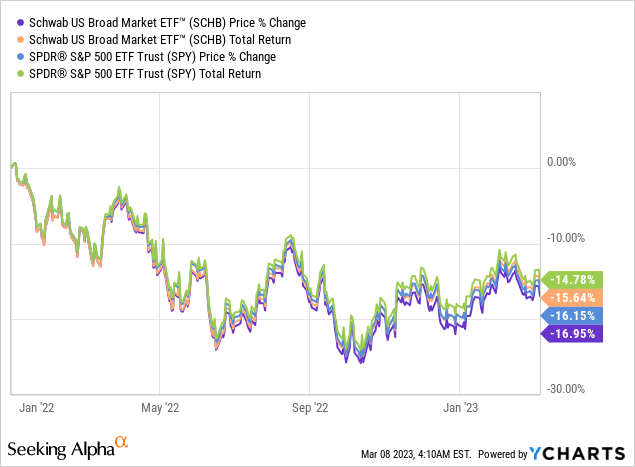
If we compare how SCHB performed in the long run with the SPDR S&P 500 ETF (SPY), we will notice that both have similar results. In fact, SCHB outperformed SPY slightly. As can be seen from the chart below, SCHB's total return of 392.7% since its inception was slightly higher than the SPY's total return of 388.9%. A significant portion of this difference is due to their expense ratios. SCHB's expense ratio of 0.03% is significantly lower than SPY's 0.1%.
YCharts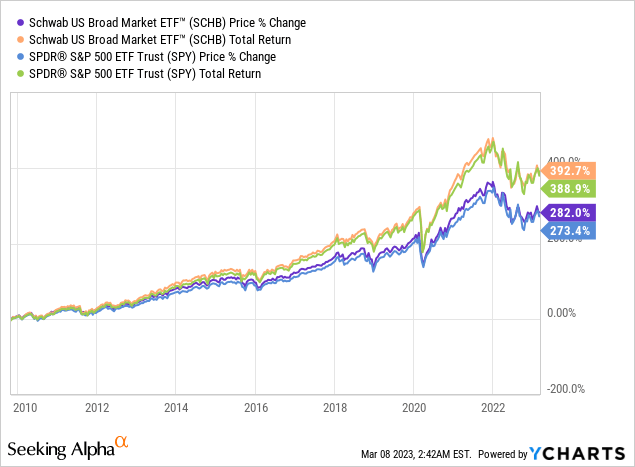
Is SCHB's valuation attractive?
There are many ways that we can evaluate SCHB's valuation. One is to look at stocks in its portfolio and compare their P/E ratios with historical average. However, doing this approach with 2,500 stocks is an arduous task. Therefore, we will propose to use the Buffett Indicator to evaluate SCHB's valuation.
In a Forbes interview in December 2001, Warren Buffett suggests using the ratio of market capitalization to GDP to evaluate whether the broader stock market is overvalued or undervalued. If the market capitalization to GDP ratio is in the range of 75% to 90%, the market is fairly valued. If this ratio is above 90%, the stock market is overvalued. On the other hand, if this ratio is above 120%, the stock market is very expensive.
Since SCHB's performance tend to be in line with the broader market, using Buffett Indicator to evaluate seems to be a good fit. As can be seen from the chart below, the current market capitalization to GDP ratio is about 152.3%. This is way above 120%. Therefore, the market appears to be very expensive. However, one may argue that since Buffett introduced this indicator in 2001, the Federal Reserve has significantly expanded its balance sheet to over $8 trillion. Therefore, a simple market capitalization to GDP ratio may not be accurate. If we take these assets owned by the Federal Reserve, the equation becomes total market capitalization to GDP and Fed Assets ratio. Using this equation, we derive the current ratio to be 115.3%. This ratio is still way above the fairly valued range of 75% - 90%. Hence, SCHB appears to be expensive right now.
GuruFocus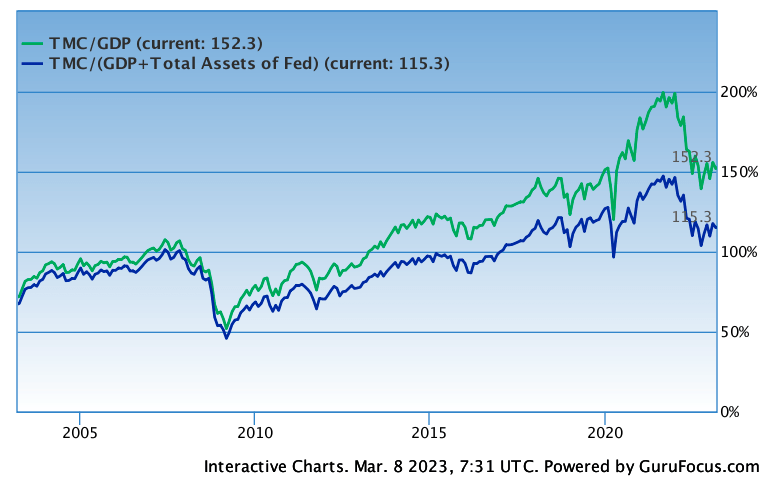
U.S. economy may enter a recession in 2023
Besides expensive valuation, current macroeconomic environment does not appear to be favorable. The hot job market and persistent inflation will force the Federal Reserve to continue its rate hike trajectory in the upcoming few meetings. A terminal rate above 6% may not be unlikely. In addition, rates will likely be kept elevated for a lengthy period. This has the danger to tip the economy over to a recession. If a recession occurs, earnings of the stocks in SCHB's portfolio will be revised downward. As a result, SCHB's fund price will have been under pressure.
Investor Takeaway
SCHB appears to be a good alternative to the S&P 500 index as it has comparable performance and a much more diversified portfolio. However, its valuation appears to be expensive according to the Buffett Indicator. In addition, 2023 may be a challenging year for many stocks in its portfolio. Therefore, we recommend investors to patiently wait on the sidelines.
This article was written by

Disclosure: I/we have no stock, option or similar derivative position in any of the companies mentioned, and no plans to initiate any such positions within the next 72 hours. I wrote this article myself, and it expresses my own opinions. I am not receiving compensation for it (other than from Seeking Alpha). I have no business relationship with any company whose stock is mentioned in this article.
Additional disclosure: This is not financial advice and that all financial investments carry risks. Investors are expected to seek financial advice from professionals before making any investment.