FCEF: A Fund Of Funds Beating Competitors

Summary
- First Trust CEF Income Opportunity ETF is an actively managed fund of funds.
- It has outperformed its competitors YYY and PCEF since 2016.
- Distribution growth has outpaced inflation, but share price has lagged it.
- The main issues of this fund are size and liquidity.
- Bonus: a solution to avoid capital decay in CEFs.
- Quantitative Risk & Value members get exclusive access to our real-world portfolio. See all our investments here »
SusanneB
This ETF review series aims at evaluating products regarding the relative past performance of their strategies and quality of their current portfolios. As holdings and their weights change over time, updated reviews are posted when necessary.
FCEF strategy and portfolio
First Trust CEF Income Opportunity ETF (NASDAQ:FCEF) is an actively managed fund of funds. It was launched on 9/27/2016 and changed names in April 2022. It has 58 holdings and a 12-month distribution yield of 7.08%. Distributions are paid monthly. The total expense ratio is 2.2%: 0.85% in ETF management fees, plus 1.35% in acquired fund expenses. The fund “seeks to provide current income with a secondary emphasis on total return”. It holds primarily closed-end funds and possibly ETFs traded in the U.S.
Assets under management (“AUM”) are thin: about $27M. An ETF with AUM staying so low too long is at risk of being delisted and redeemed. Here, the high management fees may increase the probability of survival. Trading volume is also very low, with a daily average of 8.2K shares (source: Finviz).
As described by First Trust, the portfolio is actively managed with a quantitative approach:
“The Fund’s investment advisor generally takes a systemic approach to investing, including the utilization of a proprietary model that identifies, sorts and scores closed-end funds and ETFs based upon various market metrics and economic factors (…) The specific metrics and factors considered depend upon the investment advisor’s current economic outlook and will vary from time to time, as will the importance assigned to each factor in the scoring and weighting process.”
The top 10 holdings represent about 34% of portfolio value. They are listed in the next table with their weights, distribution yields and discounts to net asset value (“NAV”).
Ticker | Name | Weight | Yield% | Discount/NAV% |
Eaton Vance Tax-Advantaged Global Dividend Income | 4.15% | 7.55 | 9.09 | |
Ares Dynamic Credit Allocation Fund | 3.69% | 10.25 | 9.82 | |
Eaton Vance Tax-Advantaged Dividend Income | 3.43% | 7.65 | 4.78 | |
John Hancock Tax-Advantaged Dividend Income | 3.37% | 7.18 | -0.22 | |
Cohen & Steers REIT and Preferred and Income | 3.32% | 7.65 | 0.33 | |
Tekla Healthcare Opportunities Fund | 3.31% | 7.25 | 11.21 | |
Eaton Vance Tax-Advantaged Global Dividend Opportunities | 3.24% | 7.46 | 8.11 | |
The Gabelli Dividend & Income Trust | 3.24% | 6.65 | 14.80 | |
Source Capital | 3.24% | 5.84 | 9.13 | |
Tekla Healthcare Investors | 2.95% | 9.46 | 11.47 |
Closed-end funds are often chosen by investors for their distribution yield. They also have a few metrics that are not applicable to stocks and ETFs. Two of them are more important than the yield:
- Discount to NAV (higher is better).
- Relative discount = Discount to NAV minus its 12-month average (higher is better).
The next table compares the averages of 47 holdings for which I have these data, with the full CEF universe.
Average discount% | Average relative discount% | |
47 FCEF holdings | 10.00 | 1.02 |
CEF universe | 8.61 | 1.36 |
Calculation using Portfolio123
They have a better average discount than the CEF universe, but the average relative discount is a bit lower.
Performance
The next chart compares the total return of FCEF since inception with two competitors: Amplify High Income ETF (YYY) and Invesco CEF Income Composite Portfolio ETF (PCEF). FCEF beats both of them, the latter by a shorter margin.
FCEF vs competitors since inception, price return (Seeking Alpha)
FCEF has been much better than its competitors at preserving capital. The share price is close to break-even, whereas YYY and PCEF are deeply in decay (see next chart).
FCEF vs competitors since inception, price return (Seeking Alpha)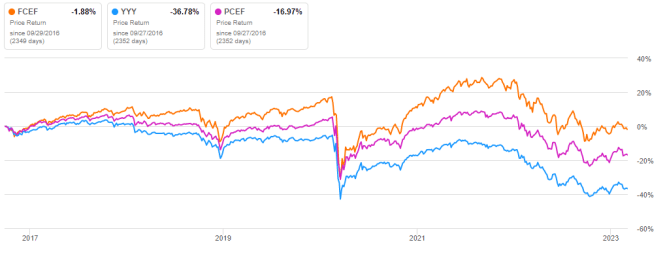
However, the cumulative inflation from September 2016 to January 2023 has been about 24% (based on CPI). Therefore, even FCEF has suffered a significant decay in inflation-adjusted value.
The annual sum of distributions was $1.08 per share in 2017 and $1.40 in 2022. It is a 29.6% growth in 5 years, whereas the cumulative inflation from December 2017 to December 2022 has been about 20%. Therefore, FCEF distribution growth has beaten inflation.
FCEF has high management fees, justified by a sophisticated (and undisclosed) process. I wanted to compare it to a simple strategy with a similar portfolio size: the 60 CEFs with higher yields among those with an average volume above $100’000 per day and a positive discount to NAV, rebalanced quarterly in equal weights. Since the fund’s inception, the simple strategy beats the sophisticated fund by 15 percentage points in total return (see table below). A note of caution: FCEF return is real, my simulation is hypothetical. To make it realistic, I have introduced a 0.5% drag per trade (spread and slippage).
Since 9/29/2016 | Total Return |
FCEF | 39.98% |
Simple 60 CEFs strategy | 55.59% |
Past performance is not a guarantee of future returns. Simulation: Portfolio123
Takeaway
FCEF holds mostly closed-end funds and occasionally ETFs selected by an actively managed process. Since inception, it has beaten its more popular competitors PCEF and YYY, and its distribution growth has outpaced inflation. However, the share price shows a material decay in inflation-adjusted value. The main concern about this fund is its low AUM and liquidity: survival is not guaranteed.
Bonus: a solution to avoid capital decay in CEFs
Capital decay is an issue in many closed-end funds, and more generally in many high-yield investments. However, it can be avoided or mitigated by rotational strategies, instead of using CEFs as buy-and-hold instruments. I designed a 5-factor ranking system in 2016, and monitored its performance during 5 years. I started publishing the eight best ranked CEFs in Quantitative Risk & Value (QRV) after the March 2020 market meltdown. The list is updated every week. Its average dividend yield varies around 7-8%. It's not a model portfolio: trading the list every week is too costly in spreads and slippage. Its purpose is helping income investors find funds with a good entry point. In the table and chart below, I give the hypothetical example of starting a portfolio on 3/25/2020 with my initial “Best 8 Ranked CEFs” list and updating it every three months since then, ignoring intermediate updates. Return is calculated using closing prices, with holdings in equal weights on rebalancing days. Dividends are reinvested at the beginning of every three-month period.
since 3/25/2020 | Total Return | Annual Return | Drawdown | Sharpe ratio |
Best 8 CEFs quarterly | 131.59% | 32.91% | -20.60% | 1.39 |
FCEF | 11.97% | 3.90% | -22.87% | 0.25 |
SPY | 68.30% | 19.29% | -24.50% | 0.88 |
This simulation is not a real portfolio and not a guarantee of future return.
The usual disclaimer says that past performance (real or simulated) is not representative of future return. The 2020 meltdown resulted in price dislocation and exceptional opportunities in the CEF universe. This is unlikely to be reproducible in a near future. However, I think a discount-driven rotational strategy in CEFs has a much better chance to protect both capital and income against erosion and inflation than any high-yield passive investment.
Quantitative Risk & Value (QRV) features data-driven strategies in stocks and closed-end funds outperforming their benchmarks since inception. Get started with a two-week free trial now.

This article was written by

Step up your investing experience: try Quantitative Risk & Value for free now (limited offer).
I am an individual investor and an IT professional, not a finance professional. My writings are data analysis and opinions, not investment advice. They may contain inaccurate information, despite all the effort I put in them. Readers are responsible for all consequences of using information included in my work, and are encouraged to do their own research from various sources.
Disclosure: I/we have no stock, option or similar derivative position in any of the companies mentioned, and no plans to initiate any such positions within the next 72 hours. I wrote this article myself, and it expresses my own opinions. I am not receiving compensation for it (other than from Seeking Alpha). I have no business relationship with any company whose stock is mentioned in this article.