Bulls kept the markets charged up for the second straight session but there was pressure at the higher levels which drove the benchmark indices off the day's high at the close on March 6.
This may be indicating that the healthy strength is yet get build up, though we have a two-day rally. The index has formed small bodied bullish candle with long upper shadow which resembles the shooting star kind of a pattern on the daily charts, which is a bearish reversal pattern.
The Nifty almost hit 17,800 but failed to hold on to the same, and closed at 17,711 with 117 points gain with above average volumes for the second day in a row. In the current month so far, the index gained more than 400 points from nearly four-and-a-half-month lows.
Going ahead, 17,800 is expected to be crucial resistance area as closing above this may take the index towards the psychological 18,000 mark, with crucial support area at 17,350-17,400 in the coming sessions, experts said.
"The Nifty tested the 200-DMA (17,413) multiple times and has managed to defend this crucial support point. On the weekly charts, it has kept its head above the 50-week MA (moving average) which is at 17,345," Foram Chheda, Technical Research Analyst and Founder of ChartAnalytics.co.in, said.
Over the coming weeks, she feels the Nifty is likely to stay largely rangebound in 17,350-18,000 range. While any runaway up move is unlikely, as long as the index does not take out 18000 levels convincingly, it has support in the zone of 17,350-17,400 levels, she said.
While the markets may continue to oscillate in this broad, but defined range and runaway up moves seen as unlikely, one will also need to keep a vigilant eye on India VIX which is at one of its lowest levels (12.26) seen since July 2021, she advised.
India VIX, the fear index fell significantly from its recent high of 16 levels on February 23 to 12.26 levels, giving the comfort for bulls.
"The Option data broadly indicated that the Nifty50 may remain in a range of 17,400-17,850," Shivangi Sarda, Senior Executive Analyst at Motilal Oswal Financial Services, said.
On the weekly Call side, there is maximum open interest at 17,800 strike followed by 18,000 strike with writing at 17,800 strike and then 17,950 strike, whereas on the Put side, there is maximum open interest at 17,500 strike followed by 17,600 strike, with writing at 17,700 strike and then 17,600 strike.
We have collated top 10 trading ideas from women experts on Dalal Street. Returns are based on the March 6 closing prices:
Foram Chheda, Technical Research Analyst and Founder of ChartAnalytics.co.in
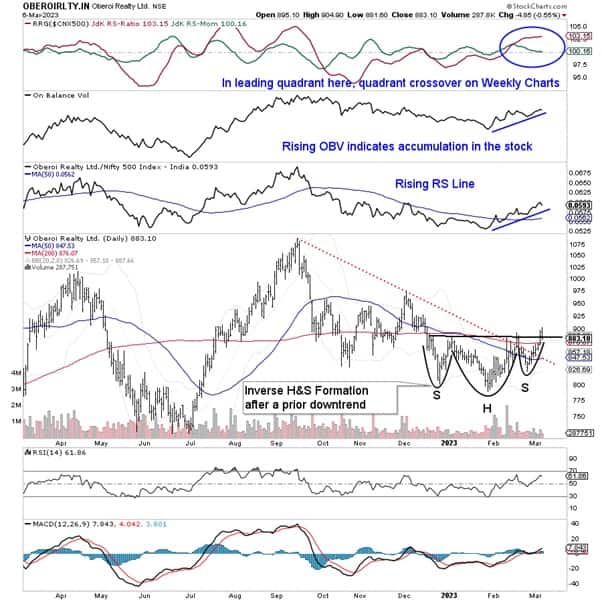
Oberoi Realty: Buy | LTP: Rs 885 | Stop-Loss: Rs 827 | Target: Rs 970 | Return: 9.6 percent
Oberoi Realty seems to be breaking out from a bullish Inverse Head and Shoulders pattern which emerged following a corrective move. The stock has crossed above the 200-DMA (daily moving average) which stands at Rs 876 and this DMA was almost acting as a proxy neckline for this formation.
The MACD (moving average convergence divergence) stays in continuing buy mode. While the stock was within this formation, OBV (on-balance volume) was rising; this indicated positive accumulation in the stock.
While the stock remains inside the leading quadrant of the RRG (relative rotation graphs); it has seen quadrant crossover on the higher time frame charts. RS (relative strength) line has changed its trajectory and seems moving higher while crossing above the 50-period MA (moving average).
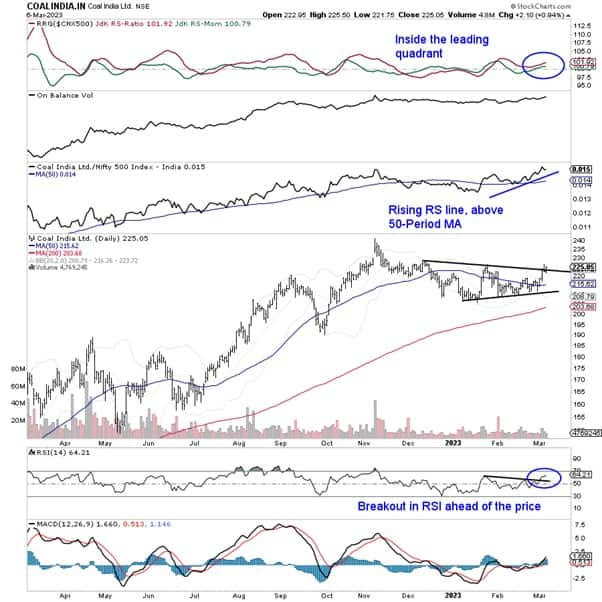
Coal India: Buy | LTP: Rs 225 | Stop-Loss: Rs 216 | Target: Rs 248 | Return: 10.2 percent
Coal India's primary uptrend was interrupted in November last year at Rs 242; after that, the stock traded in a defined range between Rs 200-240 levels. The recent price move shows the stock trying to break out from an area pattern; it seems to be penetrating the falling trendline that begins from Rs 224-225 levels and joined the subsequent lower tops.
Signals on the charts indicate that the stock is in for a resumption of an uptrend. RSI (relative strength index) has already staged a breakout from a formation ahead of the price breakout which is bullish.
The stock is inside the leading quadrant of the RRG; it may relatively outperform the broader markets. RS line is in an uptrend; remains above the 50-Period MA.
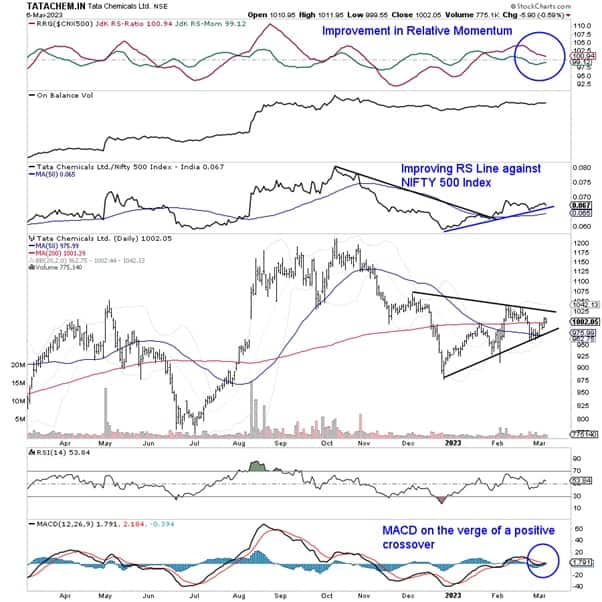
Tata Chemicals: Buy | LTP: Rs 1,002 | Stop-Loss: Rs 966 | Target: Rs 1,060 | Return: 6 percent
The price action in Tata Chemicals over the past several weeks has developed a Symmetrical Triangle pattern. Although this is a neutral pattern and can resolve with the price moving in either direction, one can reasonably anticipate the possible directional bias with the support of other pieces of evidence on the chart.
A narrowing Histogram shows MACD on the verge of a positive crossover. The stock is inside the weakening quadrant; however, the improvement in its Relative Momentum against the broader Nifty500 index shows resilience in the technical setup.
On the weekly timeframe, Tata Chemicals has seen a quadrant crossover on RRG. The RS line has reversed its trajectory and it is seen moving higher.
Expert: Swati A Hotkar, Assistant Vice President, Equity Technical Research - Retail at Nirmal Bang
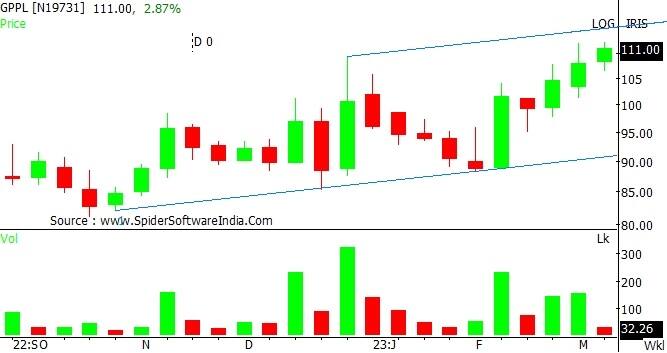
Gujarat Pipavav Port: Buy | LTP: Rs 111 | Stop-Loss: Rs 100 | Target: Rs 130 | Return: 17 percent
Weekly chart indicates that stock is trading in upward rising channel suggesting potential up move in near term. The stock is well placed above all the important moving averages i.e. 50, 100 and 200 DMA indicates strength.
We believe up move is likely to extend its leg towards Rs 130 and above levels.
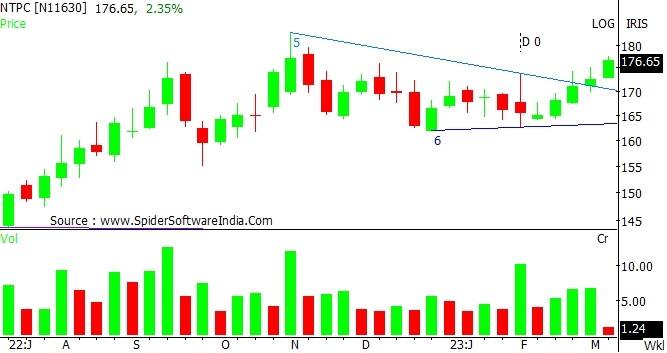
NTPC: Buy | LTP: Rs 176.80 | Stop-Loss: Rs 164 | Target: Rs 200 | Return: 13 percent
Technically, weekly chart suggests that stock has given the breakout of Pennant pattern. Daily chart indicates that stock is trading above all the important moving averages suggesting potential up move in near term.
Interesting fact is that stock is on the verge of showing positive RSI crossover.
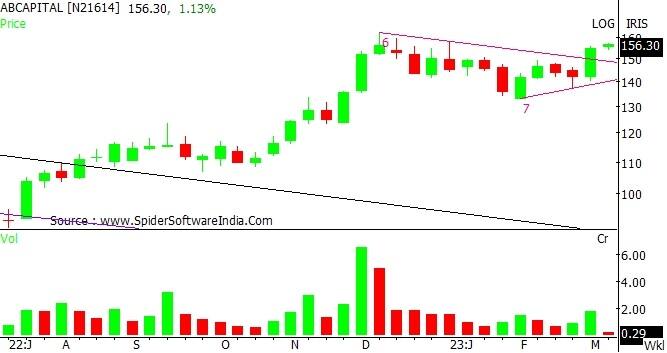
Aditya Birla Capital: Buy | LTP: Rs 156 | Stop-Loss: Rs 144 | Target: Rs 175-180 | Return: 15 percent
Weekly charts indicates that stock has given the breakout of Pennant pattern suggesting bullish view in near term. Technically, stock has shown a strong reversal from 200-DMA with decent volumes.
Looking towards technical setup, we believe positive momentum is likely to continue towards Rs 175-180 levels.
Expert: Vaishali Parekh, Vice President - Technical Research at Prabhudas Lilladher
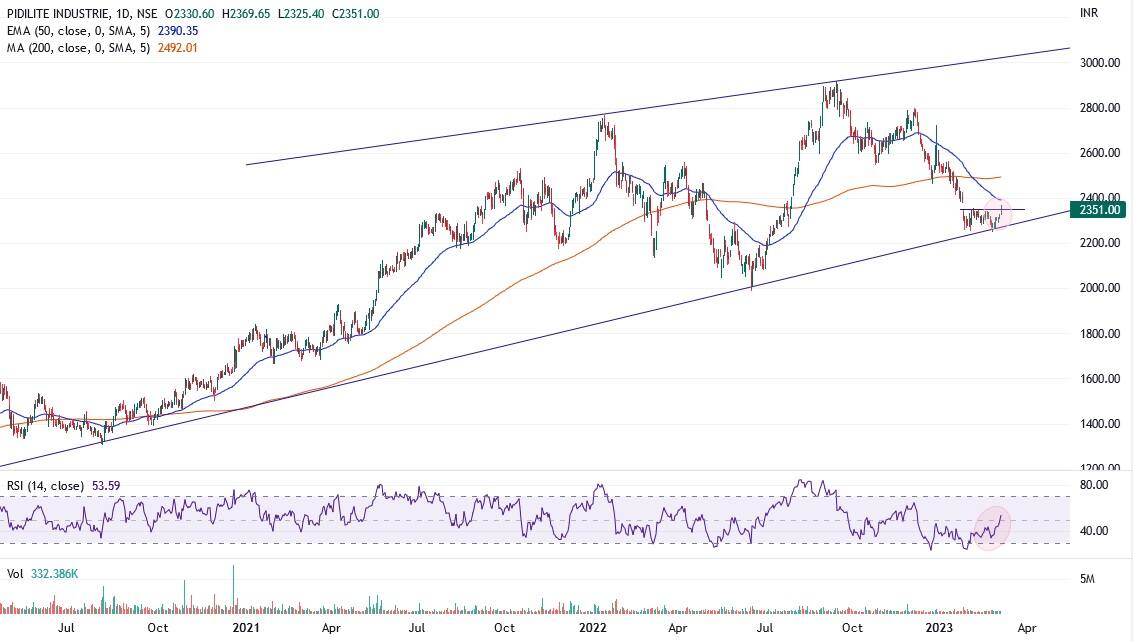
Pidilite Industries: Buy | LTP: Rs 2,351 | Stop-Loss: Rs 2,250 | Target: Rs 2,750 | Return: 17 percent
The stock has witnessed a decent erosion from Rs 2,800 zone to bottom out and consolidate near the long term trendline support zone of Rs 2,250 levels and has indicated a pullback to improve the bias gradually.
The RSI is well placed to show strength and has immense upside potential to carry on the momentum still further upside.
The chart looks very attractive and with a move past the important 50-day EMA (exponential moving average) level of Rs 2,390 shall further strengthen the trend and trigger for further upward move for next target of Rs 2,490 of the 200-DMA level.
Further breakout above the 200-DMA level can take the stock to Rs 2,700-2,750 levels.
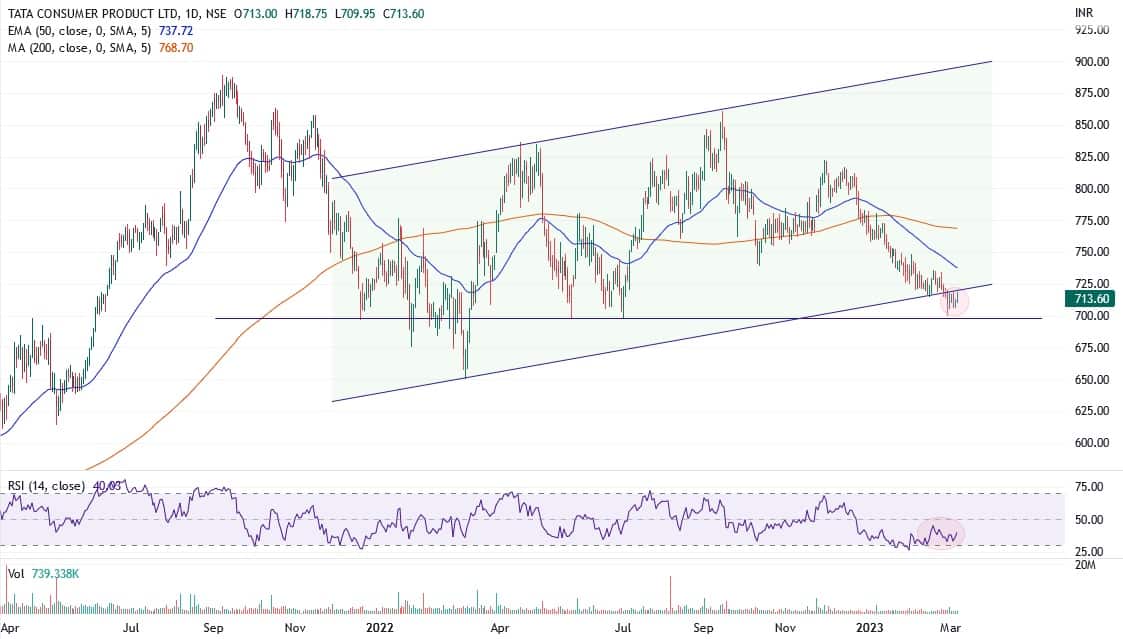
Tata Consumer Products: Buy | LTP: Rs 713.6 | Stop-Loss: Rs 685 | Target: Rs 785 | Return: 10 percent
The stock has witnessed a gradual erosion from Rs 820 levels to show signs of bottoming out and consolidating near Rs 690-700 zone which is a strong support base as seen from the past historical chart pattern on the daily chart.
The RSI is placed near the oversold zone and with some improvement witnessed has immense upside potential to carry on the momentum still further upside.
The chart looks very attractive. With a decisive move past Rs 735 levels would suggest further strengthen and can trigger for further upward move for next target of Rs 785 in the coming days. With further upside move with strength indicated, one can expect for Rs 820-850 levels in the short term time frame.
Dishman Carbogen Amcis: Buy | LTP: Rs 120 | Stop-Loss: Rs 107 | Target: Rs 145-150 | Return: 25 percent
The stock after the decent correction has bottomed out near Rs 80 levels and has given a decent strong pullback to improve the bias and trend moving past the significant 200-DMA of Rs 107 indicating strength.
The stock has consolidated near Rs 120 zone maintaining the support near Rs 115 zone with decent volume participation witnessed anticipating for further upward move in the coming days.
The RSI has shoot up from the highly oversold zone and now from the overbought zone has again slipped to stabilise and indicate strength to regain the upward march.
The chart looks attractive, and we suggest to buy and accumulate the stock for an upside target of Rs 145-150 levels with stop-loss maintaining near Rs 107 zone.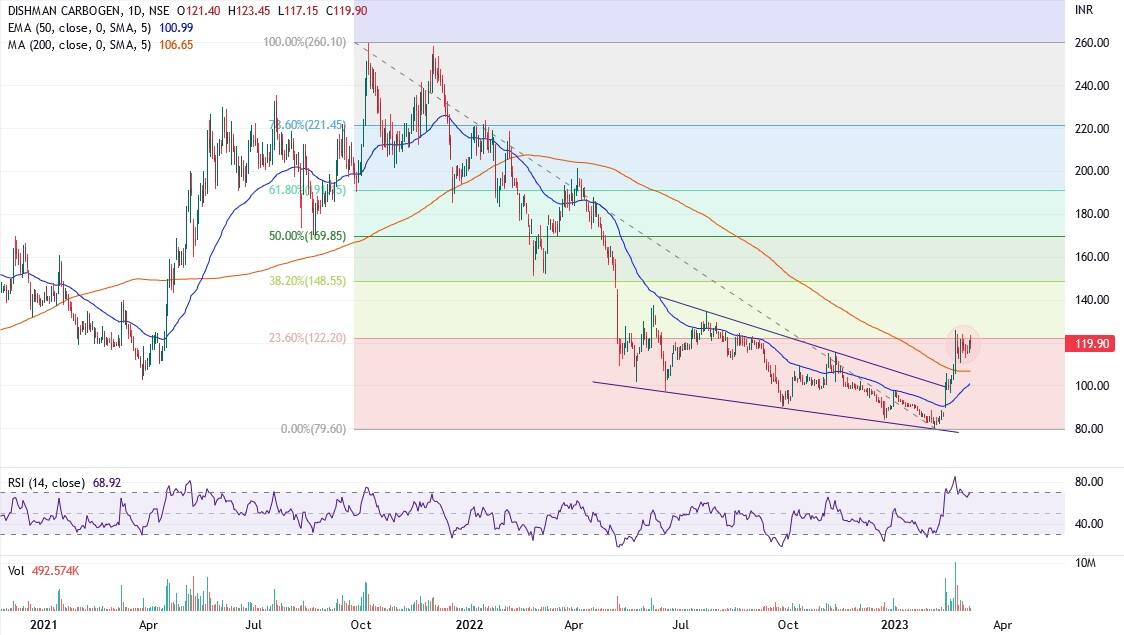
Expert: Shivangi Sarda, Senior Executive | Analyst at Motilal Oswal Financial Services
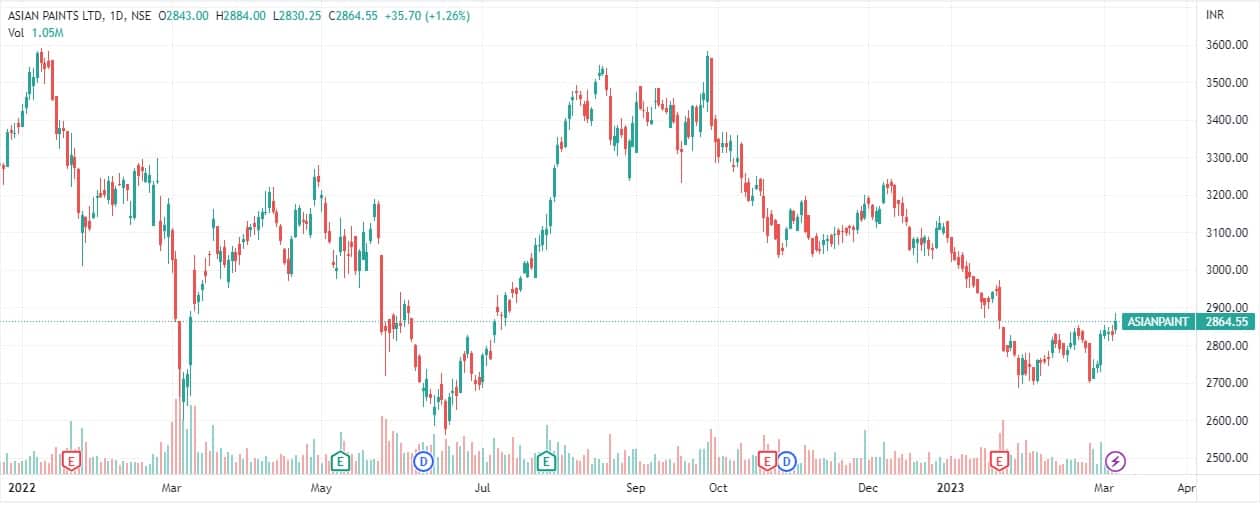
Asian Paints: Buy | LTP: Rs 2,864 | Stop-Loss: Rs 2,764 | Target: Rs 3,064 | Return: 7 percent
The stock has been making higher lows from the last 15 years indicating clear outperformance in the market and a must have in the portfolio.
On monthly frame it has negated its lower lows formation of the last six months, providing a good risk reward at these levels.
It is coming out of its consolidation on weekly frame and surpassed its previous resistance of Rs 2,850 zone.
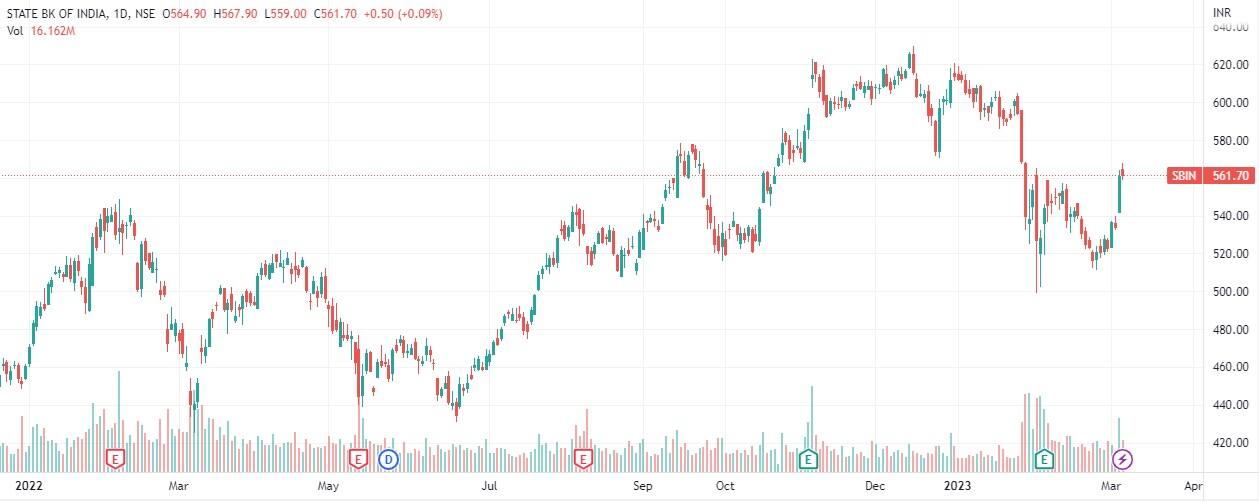
State Bank of India: Buy | LTP: Rs 562 | Stop-Loss: Rs 540 | Target: Rs 600 | Return: 7 percent
The PSU pack has been in momentum and banking names are leading Bank Nifty out of which SBI has been a contributor. The stock has comfortably crossed its hurdle zones and bottoming out on weekly frame which provides a good risk reward ratio.
Price volume surge and follow up buying on daily frame is making the stock attractive for a room of more upside.
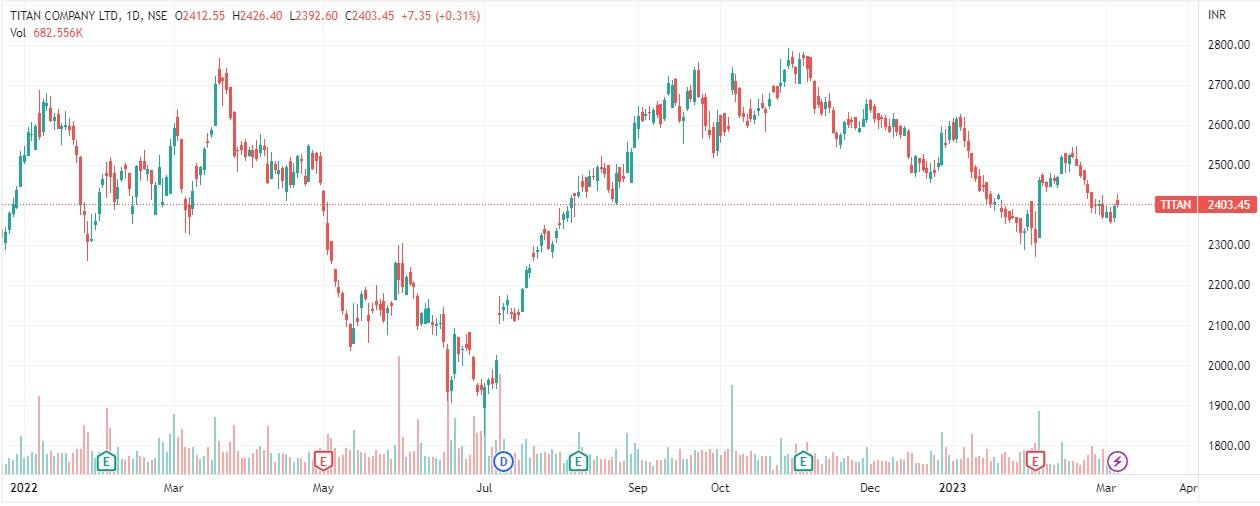
Titan Company: Buy | LTP: Rs 2,403 | Stop-Loss: Rs 2,320 | Target: Rs 2,570 | Return: 7 percent
Gradual base formation can be seen in the stock and negation of lower lows of the last four months. The stock has witnessed good buying interest and positive divergence in RSI indicator at support zones and getting ready to shine in the coming few weeks.
Disclaimer: The views and investment tips expressed by investment experts on Moneycontrol.com are their own and not those of the website or its management. Moneycontrol.com advises users to check with certified experts before taking any investment decisions.