SMDV: The Paradox Of Expensiveness And Unsatisfactory Quality

Summary
- SMDV is a passively managed dividend growth-focused fund favoring U.S. mid- and small-caps.
- Since my previous coverage, the index SMDV tracks has been reconstituted in June and then rebalanced in September and December 2022 (with the next rebalanced due this March).
- Cases when generous multiples come with vulnerable margins are comparatively rare. SMDV, despite its focus on dividend growth that should secure class-leading profitability, is one example.
- In spite of the fund outperforming the market since my March 2022 coverage, I do not see a meaningful reason to upgrade it to a Buy as its quality and valuation characteristics are unsatisfactory.
malerapaso
ProShares Russell 2000 Dividend Growers ETF (BATS:SMDV) is a passively managed dividend growth-focused fund favoring U.S. mid and small caps.
As explained in the summary prospectus, a ten-year dividend growth steak is an essential prerequisite for a Russell 2000 index component to qualify for inclusion in its underlying index comprising the cohort of the "dividend growers," though there are exceptions. There are market cap and liquidity considerations as well. Constituents are weighted equally, with no single sector allowed to account for more than 30%.
The previous time I covered SMDV was precisely a year ago, when I highlighted a few essential points why the ETF is better to be avoided, from unjustifiably rich valuation to unsatisfactory quality, a combination I saw as a precarious amid a raging bear market, and fairly strange, especially for a dividend growth-focused portfolio. There was also nothing specific about its past performance for a bullish thesis to be premised on.
Unfortunately, after examining the current version of its portfolio carefully, I would not say that its characteristics have improved to the extent of the ETF becoming a Buy. Quality is still a gnawing concern, while valuation (if measured using the earnings yield amongst other metrics) has not improved, even though the weighted-average dividend yield has advanced by about 30 bps since then to ~2.9%.
Although its performance in 2022 was certainly robust by bear market standards as it has outpaced the S&P 500 since my note, this alone is insufficient to dispel my doubts.
Seeking Alpha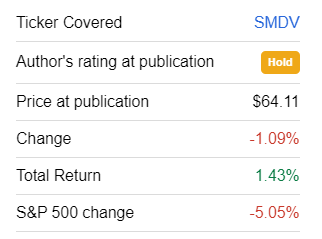
I am not convinced of its potential to continue to outperform as well as to deliver ample growth in distributions. Now let me discuss all of the above in greater depth.
Reasons for skepticism are multifold as SMDV has a rare combination of expensiveness and questionable quality
Since my previous coverage, the Russell 2000 Dividend Growers index has been reconstituted in June, and then rebalanced in September and December 2022 (with the next rebalanced due this March), so the fund’s holdings have also been obviously reshuffled, with a few additions and deletions. More specifically, as of March 5, SMDV had 96 holdings, with the major ten accounting for 12.6%, in contrast to only 88 holdings (with the top ten cohort having 13.8%) that could be found in its portfolio in March 2022.
Digging deeper, seven stocks (~8.3% weight) were removed, including Premier Financial Corp. (PFC), BancFirst (BANF), and Lakeland Financial Corporation (LKFN), while fifteen (~15.9% weight currently) were added, like Alamo Group (ALG), Kadant (KAI), and CNO Financial Group (CNO).
As of writing the previous article, the weighted-average market cap stood at $2.6 billion; at the moment, it is teetering at around $2.87 billion. And here, confidence that portfolio adjustments might result in a better valuation begins to dissipate. The weighted-average dividend yield has gone up from 2.61% to 2.85%, but the share of stocks with no less than a B- Quant Valuation rating has compressed from over 32% to ~27%, while the amount of those priced questionably (D+ and lower) has contrarily increased to almost 47% from 28.5%. Here it is worth remarking that the level is not an intolerably high, but certainly not perfect for a small/mid-cap basket. That is to say, I am disappointed.
Interestingly, the additions have not only not contributed to better valuation but even detracted from it, as just two stocks in this fourteen-strong group have an either A or B rating, namely Cogent Communications (CCOI) with B- and Peoples Bancorp (PEBO) with B+.
It is also worth noting that the weighted-average earnings yield, as per my calculations, equals to only 5.2%, which is almost on par with the market. Again, this is too low for the portfolio, which is essentially a slice of the Russell 2000 index.
Investors have reason to regard the earnings yield as an imperfect metric for capital-intensive businesses, and I agree completely here. Debt is of critical importance, too. In this regard, I decided to look at EV/EBITDA. The issue here is that financials account for around 28.7% of this portfolio, which meaningfully complicates the process as the ratio is inapplicable for most players in the sector. One of the possible solutions here is to remove financials entirely and create a model where their weights would be redistributed equally between other positions. This is precisely what I have done. This theoretical portfolio would be overweight in industrials (32%), with an estimated 16.2x EV/EBITDA and a 7.2% Return on Total Capital. Is this a duo appealing enough? Hardly.
Is this valuation backed by strong quality of growth? Alas. ~33.7% have a B- Profitability rating and better, an improvement from ~20.4% seen last March, as most additions have solid margins and are capable of delivering strong returns on capital, like Exponent (EXPO), a research & consulting company, and Agree Realty (ADC), a REIT. Nevertheless, this is too low for my taste.
Next, the Return on Equity/Return on Assets spread is worth addressing briefly, as it allows to uncover whether the debt issue is acute or not. It is at about 11.5%, as per my analysis, with ROE of 16% and ROA of 4.5%; nevertheless, both metrics are bleak. The scatter plot below was created to provide better context, with a caveat that Insperity (NSP) with its over 451% ROE (its Debt/Equity exceeds 547%, so I was not surprised) was removed to improve readability. As it can be seen, most holdings have sub-5% ROA, an obviously poor result.
Created by the author using data from Seeking Alpha, Morningstar, and the fund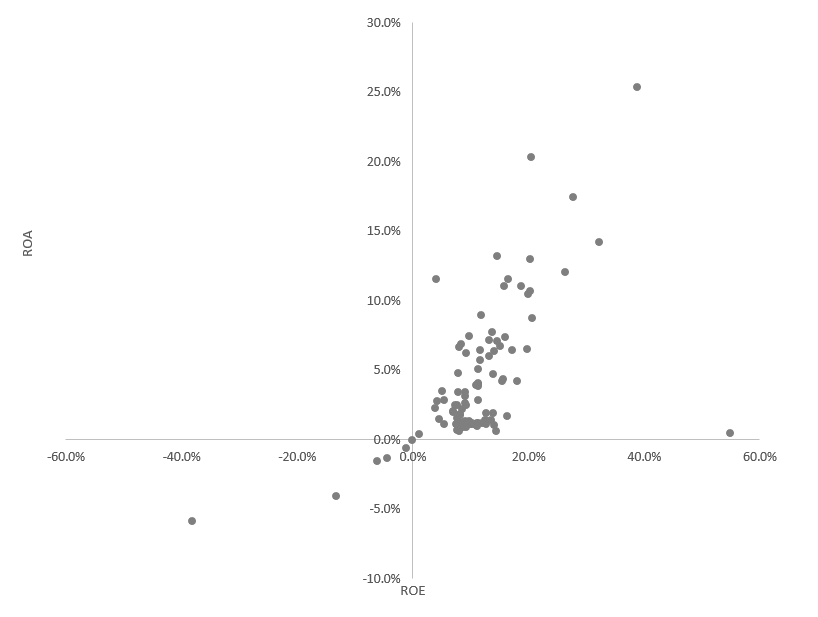
Speaking about growth, a 9% WA forward EPS and 7% forward revenue growth rate are also far from stellar.
Final thoughts
In fairness, SMDV has demonstrated that it is capable of navigating the market environment dominated by high inflation and high interest rates. To corroborate, SMDV outperformed the iShares Core S&P 500 ETF (IVV) almost every month in 2022 notwithstanding March, July, and November. During the March 2022 - February 2023 period, it easily beat IVV that was in the red, also with a lower standard deviation, which a nice surprise for a mid-cap-heavy portfolio.
| Portfolio | SMDV | IVV |
| Initial Balance | $10,000 | $10,000 |
| Final Balance | $10,272 | $9,217 |
| CAGR | 2.72% | -7.83% |
| Stdev | 21.58% | 23.88% |
| Best Year | 5.43% | 3.58% |
| Worst Year | -2.57% | -11.02% |
| Max. Drawdown | -13.06% | -20.28% |
| Sharpe Ratio | 0.1 | -0.34 |
| Sortino Ratio | 0.17 | -0.46 |
| Market Correlation | 0.94 | 1 |
Created by the author using data from Portfolio Visualizer
All these are worth appreciating. Anyway, in spite of the fund outperforming the market since my March 2022 coverage, I do not see a meaningful reason to upgrade it to a Buy. In my view, quality is the very foundation of a solid dividend strategy, especially of those in the DGI league. Expensive valuation and excellent profitability are merely always proximate, and cases when generous multiples come with vulnerable margins are comparatively rare. SMDV, despite its focus on dividend growth that should secure class-leading profitability, is one example. Next, its 2.4% dividend yield is hardly appealing, especially assuming interest rates have all chances to go much higher than initially anticipated. In sum, SMDV ETF does not deserve a Buy rating.
This article was written by

Disclosure: I/we have no stock, option or similar derivative position in any of the companies mentioned, and no plans to initiate any such positions within the next 72 hours. I wrote this article myself, and it expresses my own opinions. I am not receiving compensation for it (other than from Seeking Alpha). I have no business relationship with any company whose stock is mentioned in this article.