KRE: Nasty Yield Spreads Pressure Regional Banks, Technical Support Tested

Summary
- The 10yr/3mo yield spread has collapsed to more than a full percentage point inversion.
- Regional banks with significant lending operations may be hurt by the move.
- I see technical risks ahead, but the valuation continues to draw me in.
- I'm a hold for now when assessing all the risks.
leightrail
Following recent troubling inflation data and hawkish words from Fed Chair Powell at this week’s Congressional testimony, yield spreads have plunged. The 10-year/3-month difference is now at 107 basis points, according to YCharts. That does not bode well for regional banks. And the KRE ETF has responded accordingly with bearish price action.
A Sharply Inverted Yield Curve
YCharts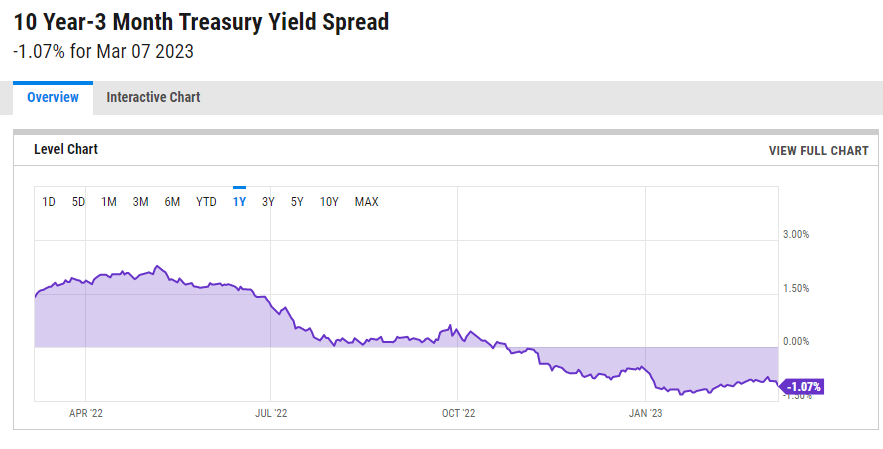
According to the issuer, the SPDR S&P Regional Banking ETF (NYSEARCA:KRE) offers investors exposure to the regional banking segment of the S&P Total Market Index. The fund uses an equal-weight approach, so it is effectively a small to mid-cap fund compared to the broader Financials sector ETF (XLF), which encompasses all the sector’s industries, and it is market cap weighted. Regional banks are often more cyclical and tied to changes in the Treasury rate curve compared to large money-center banks and financials with significant investment banking and wealth management operations.
KRE falls in the small-cap value area on the Morningstar style box with the bulk of its assets in the far-left area. The factor profile on KRE is decidedly valued with an above-market yield. The ETF yields close to 3% and trades at less than 10 times earnings per Morningstar. With a solid double-digit long-term earnings growth rate, the PEG ratio is quite attractive under 1. Key for banks, the price/book ratio on KRE is not as appealing at 1.3. Many large banks trade at less than one 1 times book. Still, I continue to see the space as sporting a strong valuation case. And recent weak price action only further supports the valuation case.
KRE: Portfolio & Factor Profiles
Morningstar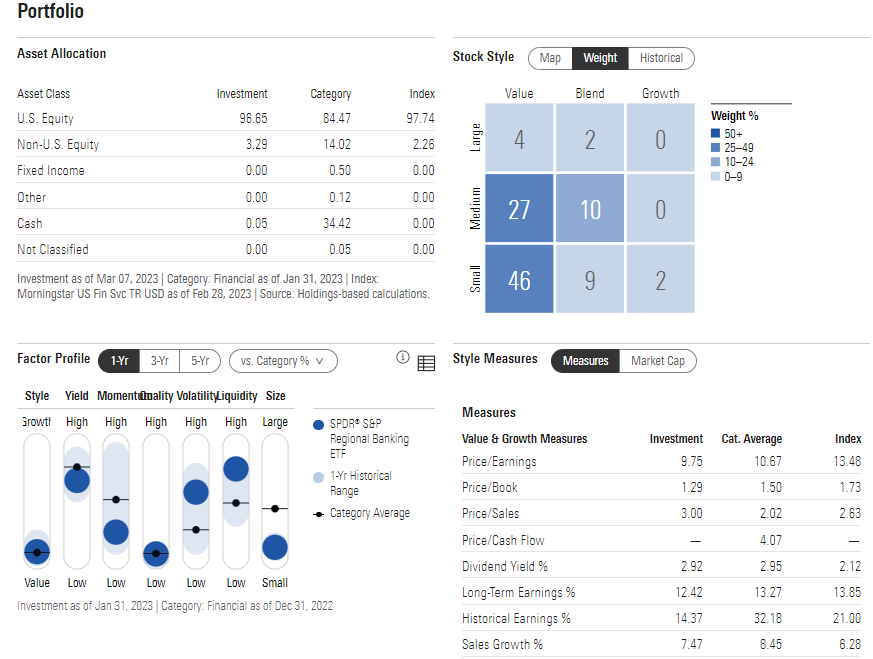
Troubling, though, is an ever-inverted 3mo-10yr yield curve – key for small lenders. The 2s10s spread gets all the press, but it is really the difference between the 3-month T-bill's rate and the 10-year Treasury yield that matters. An inversion of more than a full percentage point no doubt pressures banks that borrow short and lend long. The macro backdrop could hurt the earnings of these firms. The top 10 stocks in KRE would no doubt be dinged should this yield curve structure persist for many quarters. Finally, negative trends in commercial real estate are not a good harbinger of profits among holdings in KRE.
KRE Top 10 Holdings
SSGA Funds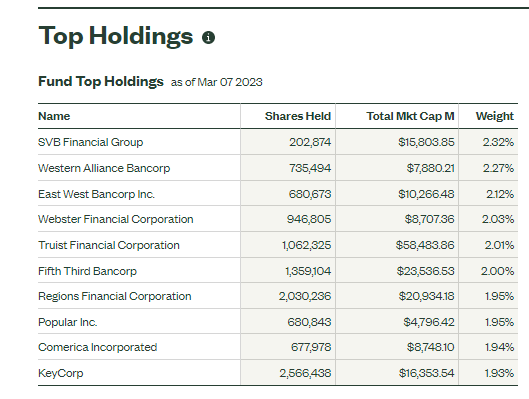
Seasonally, now is an unexciting time to own KRE, according to data from Equity Clock. Notice in the chart below that the fund tends to trade sideways during what is a bullish time for the broad market. Downside price action then often takes place from late April through August. So, this is a bearish factor to consider.
KRE Seasonality Not Ideal Now Through August
Equity Clock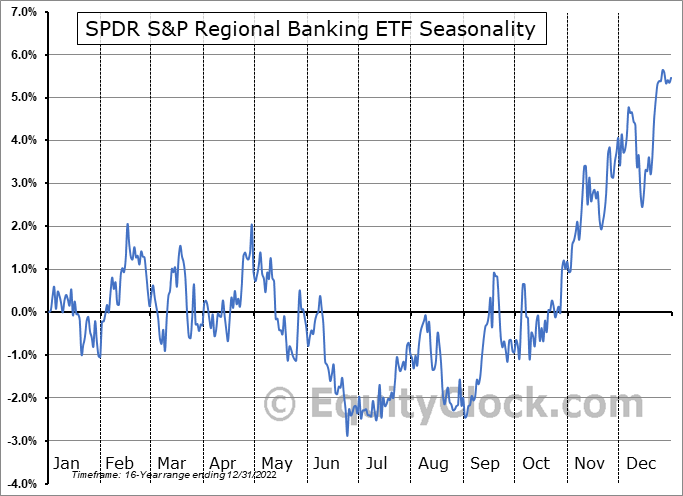
KRE is also turning south on a relative price action basis versus the broad market. The ETF is close to its weakest position compared to the S&P 500 ETF (SPY) since late 2020 after periods of strength in the last two years. This is certainly a cautionary sign.
KRE Relative Strength Gone On The 4-Year Chart
Stockcharts,com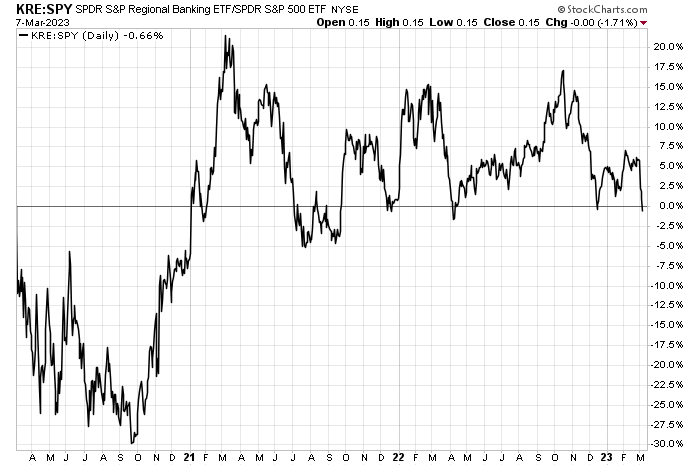
Finally, the absolute chart of KRE is likewise a risk. I see key support in the $56 to $57 range. That’s critical because there is not a high amount of volume by price from $56 down to about $41. If KRE breaks support, there’s not much demand from previous price action to support the fall. I see a downward-sloping resistance line that comes into play around $64 which is near-term resistance. Finally, take a look at how volume has spiked lately amid a downside move in price. Yet another yellow flag for the bulls.
KRE: Descending Triangle Formation, Eyeing $56 Support
Stockcharts.com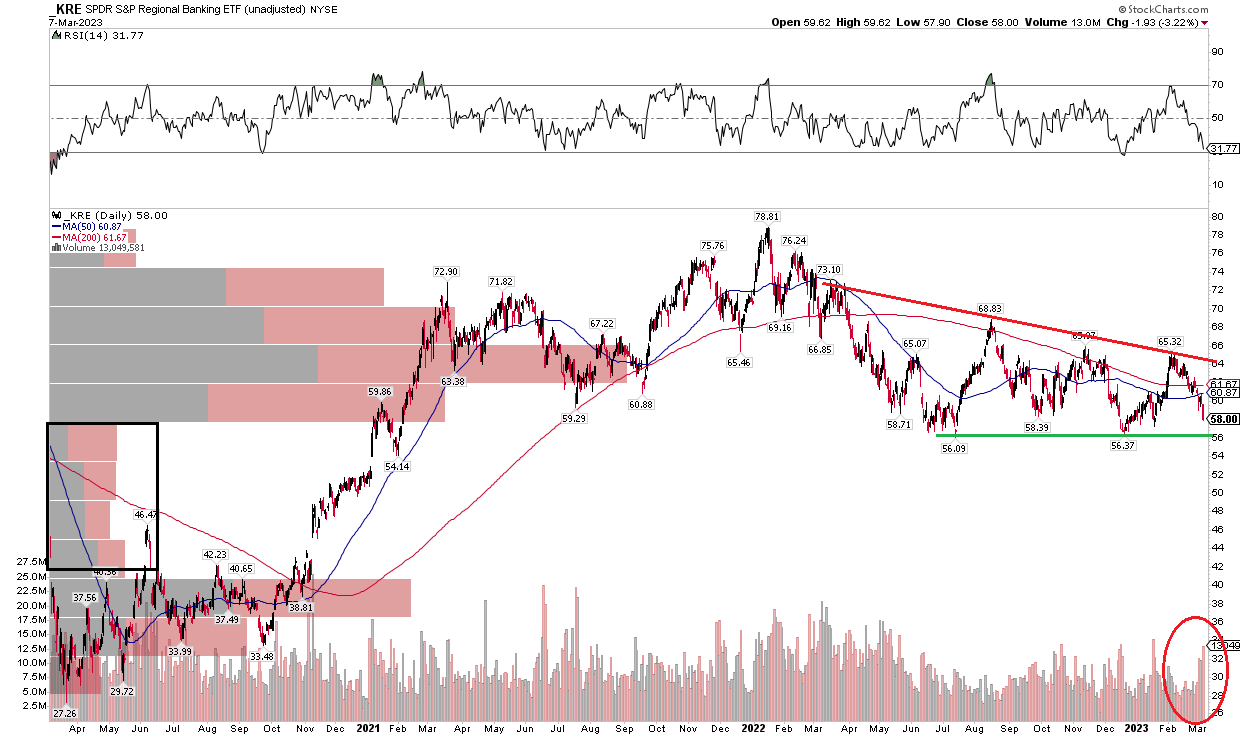
The Bottom Line
I reiterate my hold recommendation on KRE. The valuation remains compelling, but unfavorable rate moves and weakening relative strength are fundamental and technical concerns at the moment.
This article was written by

Disclosure: I/we have no stock, option or similar derivative position in any of the companies mentioned, and no plans to initiate any such positions within the next 72 hours. I wrote this article myself, and it expresses my own opinions. I am not receiving compensation for it (other than from Seeking Alpha). I have no business relationship with any company whose stock is mentioned in this article.