The 'High-High-Low' Closed-End Fund Report, February 2023

Summary
- Only funds with yields over 8%, coverage higher than 90% and trading at a discount are considered.
- Top lists of discount, yield, DxY and DxYxZ are given.
- The top DxY funds are HFRO, HNW, and AOD.
- Looking for a helping hand in the market? Members of CEF/ETF Income Laboratory get exclusive ideas and guidance to navigate any climate. Learn More »
NicoElNino
Author’s note: This article was released to CEF/ETF Income Laboratory members on Feb. 28, 2023. Please check latest data before investing.
"High-High-Low" Closed-End Fund Report
Quantitative screens help to rapidly narrow down attractive candidates from the database of 500+ closed-end funds (CEFs) for further due diligence and investigation. The "High-High-Low" report was inspired by a member of CEF/ETF Income Laboratory, who wrote:
Stanford, you should do a follow up article on CEF that distribute 8%+, have 90% or more coverage and trade under NAV. What does that look like in today's world? How many funds are doing that?
What are the Z scores? I think many investors would be interested who are pushing for higher yield to identify best in class of aggressive funds that are coming close to covering dividends. Allows people to reevaluate risk/reward.
Income Lab
The "High-High-Low" report, therefore, screens for the following three attributes that we would like to screen for:
- High distributions (>8%) (i.e., 8% or higher yields)
- High coverage (>90%) (i.e., 90% or better coverage)
- Low premium/discount value (<0%) (i.e., trading at a discount)
Note that the above thresholds are subject to change based on the number of eligible CEFs there are that satisfy all three of the criteria. I try to aim for a minimum of at least 20 eligible funds so that the "top 10" list actually means something (top 50% of the screen).
As for the Quality CEF report, I should mention some caveats about using coverage as a screen. Firstly, the coverage ratios are calculated using earnings data from CEFConnect. No efforts have been made to independently verify the coverage ratios from the individual fund annual/semi-annual reports themselves. Secondly, having a coverage ratio >90% does not guarantee that the fund's distribution is secure. Many funds reduce their distributions periodically in line with market conditions in order to maintain good coverage. Thirdly, a coverage cut-off ratio of 90% is, ultimately, an arbitrary number. A fund with 89.9% coverage will be excluded from the rankings, whereas funds with 90.1% coverage will be considered, even though only a sliver of difference separates the two.
The coverage ratio is calculated by dividing the earnings/share number provided by CEFConnect on the "distributions" tab by the distribution/share. CEFData also provides earnings coverage numbers as well.
I should note that having both high yields and less than 100% coverage (though greater than 80%) makes this a more aggressive screen compared to the Quality report (which only selects for >100% coverage). Furthermore, note that because the universe of eligible funds is pretty small, some of the CEFs will appear in multiple top lists, just in a different order...
I hope that these rankings of "high-high-low" CEFs will provide fertile grounds for further exploration.
Key to table headings:
P/D = premium/discount
Z = 1-year z-score
Cov = coverage
1Y NAV = 1-year NAV total return
Lev = leverage
BE = baseline expense
Data were taken from the close of Feb. 24, 2023.
1. Top 10 widest "high-high-low" discounts
The following data show the 10 CEFs with the widest discounts, yield >6.5% and coverage >85%. Z-scores, leverage and baseline expense are shown for comparison.
| Fund | Ticker | Category | P/D | Yield | Z | Cov | 1Y NAV | Lev | BE |
| Highland Income Fund | (HFRO) | Senior Loans | -30.58% | 9.49% | -1.9 | 166% | 10.7% | 13% | 1.61% |
| MainStay CBRE Glob Infra Megatrends Fund | (MEGI) | Sector Equity | -14.13% | 9.15% | -0.2 | 91% | -5.0% | 28% | 1.47% |
| abrdn Total Dynamic Dividend | (AOD) | Global Equity | -12.66% | 8.55% | -0.5 | 103% | -5.2% | 1% | 1.14% |
| BNY Mellon High Yield Strategies Fund | (DHF) | High Yield | -11.86% | 8.07% | -0.5 | 110% | -10.7% | 30% | 1.28% |
| abrdn Global Dynamic Dividend | (AGD) | Global Equity | -11.61% | 8.19% | 0.0 | 99% | -6.5% | 5% | 1.16% |
| Pioneer Diversified High Income | (HNW) | High Yield | -11.48% | 10.37% | -0.8 | 109% | -10.1% | 30% | 1.58% |
| Western Asset High Income Opportunity | (HIO) | High Yield | -10.07% | 8.98% | 1.5 | 93% | -6.0% | 0% | 0.93% |
| Western Asset Emerging Markets Debt | (EMD) | Emerging Market Income | -10.01% | 10.63% | 0.8 | 95% | -11.6% | 31% | 1.30% |
| Ares Dynamic Credit Allocation Fund | (ARDC) | Senior Loans | -9.58% | 10.27% | 0.8 | 105% | -7.5% | 22% | 2.08% |
| Pioneer High Income | (PHT) | High Yield | -9.55% | 9.99% | 0.4 | 104% | -7.2% | 32% | 1.14% |
Income Lab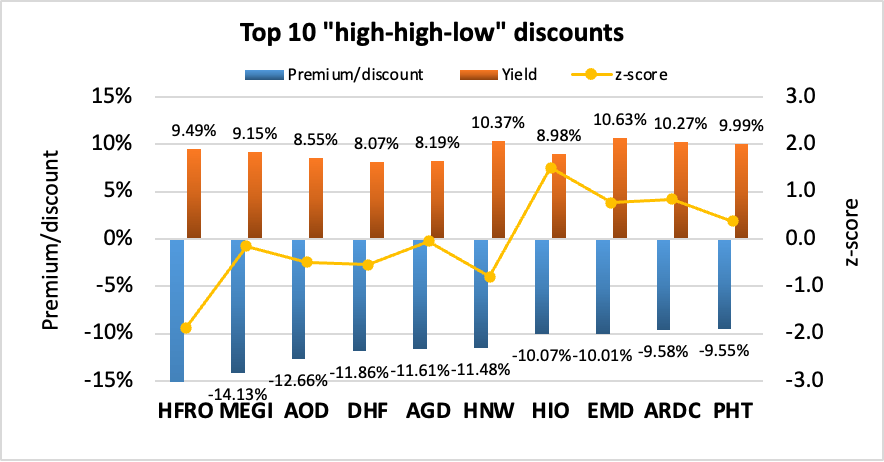
2. Top 10 lowest "high-high-low" z-scores
The following data show the 10 CEFs with the lowest z-scores, yield >6.5%, coverage >85% and premium/discount <+5%. Leverage and baseline expense are shown for comparison.
| Fund | Ticker | Category | Z | P/D | Yield | Cov | 1Y NAV | Lev | BE |
| Highland Income Fund | (HFRO) | Senior Loans | -1.9 | -30.58% | 9.49% | 166% | 10.7% | 13% | 1.61% |
| Pioneer Diversified High Income | (HNW) | High Yield | -0.8 | -11.48% | 10.37% | 109% | -10.1% | 30% | 1.58% |
| BNY Mellon High Yield Strategies Fund | (DHF) | High Yield | -0.5 | -11.86% | 8.07% | 110% | -10.7% | 30% | 1.28% |
| abrdn Total Dynamic Dividend | (AOD) | Global Equity | -0.5 | -12.66% | 8.55% | 103% | -5.2% | 1% | 1.14% |
| KKR Income Opportunities Fund | (KIO) | High Yield | -0.2 | -6.10% | 10.99% | 94% | -70.7% | 66% | 2.18% |
| MainStay CBRE Glob Infra Megatrends Fund | (MEGI) | Sector Equity | -0.2 | -14.13% | 9.15% | 91% | -5.0% | 28% | 1.47% |
| abrdn Global Dynamic Dividend | (AGD) | Global Equity | 0.0 | -11.61% | 8.19% | 99% | -6.5% | 5% | 1.16% |
| ArrowMark Financial Corp | (BANX) | Sector Equity | 0.2 | -9.24% | 8.30% | 142% | 4.7% | 26% | 3.41% |
| Pioneer High Income | (PHT) | High Yield | 0.4 | -9.55% | 9.99% | 104% | -7.2% | 32% | 1.14% |
| Western Asset Emerging Markets Debt | (EMD) | Emerging Market Income | 0.8 | -10.01% | 10.63% | 95% | -11.6% | 31% | 1.30% |
Income Lab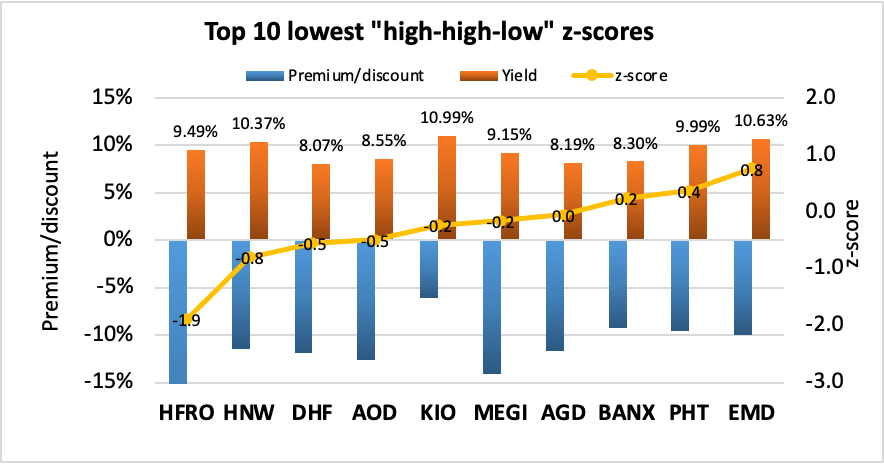
3. Top 10 highest "high-high-low" yields
The following data show the 10 CEFs with the highest yields, coverage >85% and premium/discount <+5%. z-scores, leverage, and baseline expense are shown for comparison.
| Fund | Ticker | Category | Yield | P/D | Z | Cov | 1Y NAV | Lev | BE |
| TCW Strategic Income | (TSI) | Multisector Income | 11.47% | -4.71% | 1.0 | 109% | -7.3% | 0% | 0.91% |
| KKR Income Opportunities Fund | (KIO) | High Yield | 10.96% | -11.31% | -0.9 | 109% | -20.5% | 39% | 2.18% |
| Western Asset Diversified Inc Fund | (WDI) | Multisector Income | 10.82% | -8.20% | 1.8 | 106% | -18.1% | 33% | 1.64% |
| Western Asset Global High Income | (EHI) | High Yield | 10.65% | -6.02% | 1.4 | 121% | -18.4% | 36% | 1.50% |
| Ares Dynamic Credit Allocation Fund | (ARDC) | Senior Loans | 10.40% | -10.78% | -0.2 | 110% | -12.4% | 22% | 2.08% |
| Western Asset Emerging Markets Debt | (EMD) | Emerging Market Income | 10.04% | -10.90% | 0.4 | 113% | -17.9% | 30% | 1.30% |
| Pioneer Diversified High Income | (HNW) | High Yield | 9.98% | -10.73% | -0.5 | 109% | -15.9% | 30% | 1.58% |
| Pioneer High Income | (PHT) | High Yield | 9.90% | -11.10% | -0.5 | 104% | -13.5% | 32% | 1.14% |
| Barings Global Short Duration High Yield | (BGH) | High Yield | 9.38% | -9.69% | 0.5 | 120% | -13.3% | 25% | 1.42% |
| Western Asset High Yield Defined Opps | (HYI) | High Yield | 9.05% | -3.91% | 0.5 | 94% | -11.5% | 0% | 0.92% |
Income Lab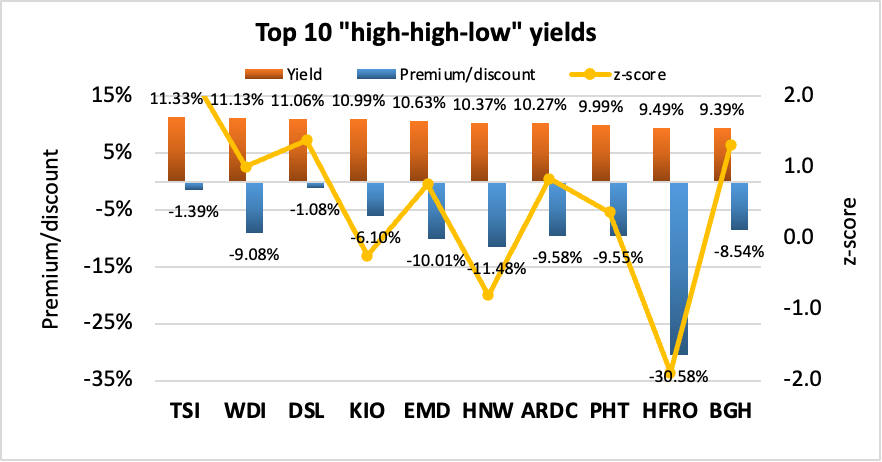
4. Top 10 best combination of "high-high-low" yield and discount
For possible buy candidates, it's probably a good idea to consider both yield and discount. Buying a CEF with both a high yield and discount not only gives you the opportunity to capitalize from discount contraction, but you also get "free" alpha as a result of the distribution being paid out. This is because paying out a distribution is effectively the same as liquidating part of the fund at NAV and returning the capital to the unitholders. I considered several ways to rank CEFs by a composite metric of both yield and discount. The simplest would be yield + discount, however I disregarded this because yields and discounts may have different ranges of absolute values and a sum would be biased towards the larger set of values. I finally settled on the multiplicative product, yield x discount. This is because I consider a CEF with 7% yield and 7% discount to be more desirable than a fund with 2% yield and 12% discount, or 12% yield and 2% discount, even though each pair of quantities sum to 14%. Multiplying yield and discount together biases towards funds with both high yield and discount. Since discount is negative and yield is positive, the more negative the "DxY" metric, the better. Only funds with >6.5% yield, >85% coverage and <+5% premium/discount are considered.
| Fund | Ticker | Category | P/D | Yield | Z | DxY | Cov | 1Y NAV | Lev | BE |
| Highland Income Fund | (HFRO) | Senior Loans | -30.58% | 9.49% | -1.9 | -2.90 | 166% | 10.7% | 13% | 1.61% |
| MainStay CBRE Glob Infra Megatrends Fund | (MEGI) | Sector Equity | -14.13% | 9.15% | -0.2 | -1.29 | 91% | -5.0% | 28% | 1.47% |
| Pioneer Diversified High Income | (HNW) | High Yield | -11.48% | 10.37% | -0.8 | -1.19 | 109% | -10.1% | 30% | 1.58% |
| abrdn Total Dynamic Dividend | (AOD) | Global Equity | -12.66% | 8.55% | -0.5 | -1.08 | 103% | -5.2% | 1% | 1.14% |
| Western Asset Emerging Markets Debt | (EMD) | Emerging Market Income | -10.01% | 10.63% | 0.8 | -1.06 | 95% | -11.6% | 31% | 1.30% |
| Western Asset Diversified Inc Fund | (WDI) | Multisector Income | -9.08% | 11.13% | 1.0 | -1.01 | 99% | -12.0% | 33% | 1.64% |
| Ares Dynamic Credit Allocation Fund | (ARDC) | Senior Loans | -9.58% | 10.27% | 0.8 | -0.98 | 105% | -7.5% | 22% | 2.08% |
| BNY Mellon High Yield Strategies Fund | (DHF) | High Yield | -11.86% | 8.07% | -0.5 | -0.96 | 110% | -10.7% | 30% | 1.28% |
| Pioneer High Income | (PHT) | High Yield | -9.55% | 9.99% | 0.4 | -0.95 | 104% | -7.2% | 32% | 1.14% |
| abrdn Global Dynamic Dividend | (AGD) | Global Equity | -11.61% | 8.19% | 0.0 | -0.95 | 99% | -6.5% | 5% | 1.16% |
Income Lab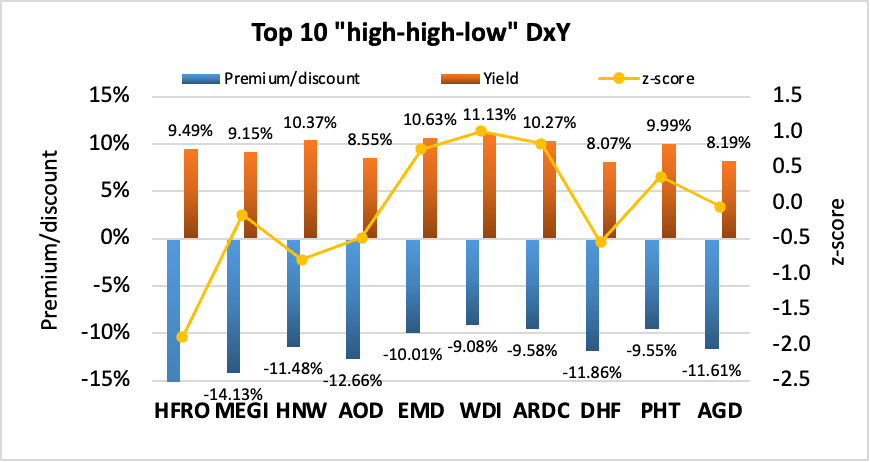
5. Top 10 best combination of "high-high-low" yield, discount and z-score
This is my favorite metric because it takes into account all three factors that I always consider when buying or selling CEFs: Yield, discount and z-score. The composite metric simply multiplies the three quantities together. As both discount and z-score are negative while yield is positive, the more positive the "DxYxZ" metric, the better. Only funds with >7% yield, >85% coverage and <+5% premium/discount are considered.
| Fund | Ticker | Category | P/D | Yield | Z | DxYxZ | Cov | 1Y NAV | Lev | BE |
| Highland Income Fund | (HFRO) | Senior Loans | -30.58% | 9.49% | -1.9 | 5.48 | 166% | 10.7% | 13% | 1.61% |
| Pioneer Diversified High Income | (HNW) | High Yield | -11.48% | 10.37% | -0.8 | 0.95 | 109% | -10.1% | 30% | 1.58% |
| abrdn Total Dynamic Dividend | (AOD) | Global Equity | -12.66% | 8.55% | -0.5 | 0.53 | 103% | -5.2% | 1% | 1.14% |
| BNY Mellon High Yield Strategies Fund | (DHF) | High Yield | -11.86% | 8.07% | -0.5 | 0.53 | 110% | -10.7% | 30% | 1.28% |
| MainStay CBRE Glob Infra Megatrends Fund | (MEGI) | Sector Equity | -14.13% | 9.15% | -0.2 | 0.21 | 91% | -5.0% | 28% | 1.47% |
| KKR Income Opportunities Fund | (KIO) | High Yield | -6.10% | 10.99% | -0.2 | 0.16 | 94% | -70.7% | 66% | 2.18% |
| abrdn Global Dynamic Dividend | (AGD) | Global Equity | -11.61% | 8.19% | 0.0 | 0.05 | 99% | -6.5% | 5% | 1.16% |
| DoubleLine Income Solutions Fund | (DSL) | Global Income | -1.08% | 11.06% | 1.4 | -0.16 | 107% | -15.8% | 29% | 1.51% |
| ArrowMark Financial Corp | (BANX) | Sector Equity | -9.24% | 8.30% | 0.2 | -0.18 | 142% | 4.7% | 26% | 3.41% |
| Pioneer High Income | (PHT) | High Yield | -9.55% | 9.99% | 0.4 | -0.35 | 104% | -7.2% | 32% | 1.14% |
Income Lab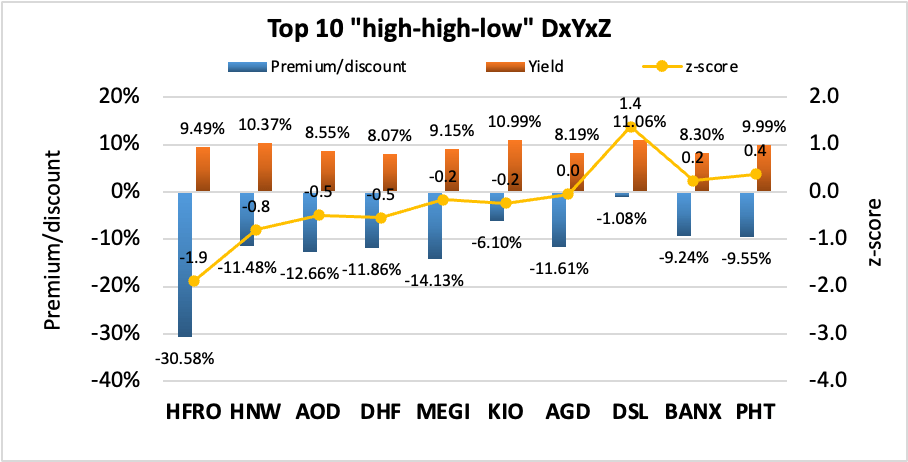
Top DxYxZ funds
The top DxY funds are HFRO, HNW, and AOD.
The Highland Income Fund (HFRO) is a relatively complex, hedge fund-like CEF that invests in a few, highly-concentrated positions. It has an attractive set of valuation metrics, including a discount of -30.85%, yield of 9.50% and z-score of -1.9, however investors should consider HFRO's history and management before investing (see HFRO: Thoughts On The Conversion Proposal).
Pioneer Diversified High Income Fund (HNW) is a high-yield CEF. It trades at a discount of 11.48%, a yield of 10.37% (with 109% coverage) and a 1-year z-score of -0.8. It last reduced its distribution in November 2022, when it cut its monthly payout from $0.11 to $0.09 (-18.2%).
abrdn Total Dynamic Dividend Fund (AOD) is a global equity fund that uses a dividend capture strategy to fund its high distribution yield. It trades with a discount of -12.66%, a yield of 8.07% and a 1-year z-score of -0.5.
Editor's Note: This article covers one or more microcap stocks. Please be aware of the risks associated with these stocks.
Profitable CEF and ETF income and arbitrage ideas
 At the CEF/ETF Income Laboratory, we manage market-beating closed-end fund (CEF) and exchange-traded fund (ETF) portfolios targeting safe and reliable ~8% yields to make income investing easy for you. Check out what our members have to say about our service.

To see all that our exclusive membership has to offer, sign up for a free trial today!
This article was written by

CEF/ETF Income Laboratory is a premium newsletter on Seeking Alpha that is focused on researching profitable income and arbitrage ideas with closed-end funds (CEFs) and exchange-traded funds (ETFs). We manage model safe and reliable 8%-yielding fund portfolios that have beaten the market in order to make income investing easy for you. Check us out to see why one subscriber calls us a "one-stop shop for CEF research.”
Click here to learn more about how we can help your income investing!
The CEF/ETF Income Laboratory is a top-ranked newsletter service that boasts a community of over 1000 serious income investors dedicated to sharing the best CEF and ETF ideas and strategies.
Our team includes:
1) Stanford Chemist: I am a scientific researcher by training who has taken up a passionate interest in investing. I provide fresh, agenda-free insight and analysis that you won't find on Wall Street! My ultimate goal is to provide analysis, research and evidence-based ways of generating profitable investing outcomes with CEFs and ETFs. My guiding philosophy is to help teach members not "what to think", but "how to think".
2) Nick Ackerman: Nick is a former Financial Advisor and has previously qualified for holding Series 7 and Series 66 licenses. These licenses also specifically qualified him for the role of Registered Investment Adviser (RIA), i.e., he was registered as a fiduciary and could manage assets for a fee and give advice. Since then he has continued with his passion for investing through writing for Seeking Alpha, providing his knowledge, opinions, and insights of the investing world. His specific focus is on closed-end funds as an attractive way to achieve income as well as general financial planning strategies towards achieving one’s long term financial goals.
3) Juan de la Hoz: Juan has previously worked as a fixed income trader, financial analyst, operations analyst, and economics professor in Canada and Colombia. He has hands-on experience analyzing, trading, and negotiating fixed-income securities, including bonds, money markets, and interbank trade financing, across markets and currencies. He is the "ETF Expert" of the CEF/ETF Income Laboratory, and enjoys researching strategies for income investors to increase their returns while lowering risk.
4) Dividend Seeker: Dividend Seeker began investing, as well as his career in Financial Services, in 2008, at the height of the market crash. This experience gave him a lot of perspective in a short period of time, and has helped shape his investment strategy today. He follows the markets passionately, investing mostly in sector ETFs, fixed-income CEFs, gold, and municipal bonds. He has worked in the Insurance industry in Funds Management, helping to direct conservative investments for claims reserves. After a few years, he moved in to the Banking industry, where he worked as a junior equity and currency analyst. Most recently, he took on an Audit role, supervising BSA/AML Compliance teams for one of the largest banks in the world. He has both a Bachelors and MBA in Finance. He is the "Macro Expert" of the CEF/ETF Income Laboratory.
Disclosure: I/we have a beneficial long position in the shares of ARDC either through stock ownership, options, or other derivatives. I wrote this article myself, and it expresses my own opinions. I am not receiving compensation for it (other than from Seeking Alpha). I have no business relationship with any company whose stock is mentioned in this article.