MOAT: Wide Moat Companies Deserve Consideration

Summary
- The MOAT ETF provides exposure to companies Morningstar deems to have wide economic moats.
- The ETF has impressively outperformed the S&P 500 over 1/3/5/10Yr time frames, with an incredible 95% batting average on rolling 5Yr returns.
- In 2022, the MOAT ETF outperformed the S&P 500 by over 450 bps despite having nominal allocations to top performing sectors like Energy and Utilities.
BargotiPhotography
The VanEck Morningstar Wide Moat ETF (BATS:MOAT) gives investors exposure to companies deemed to have sustainable economic advantages by Morningstar. The MOAT ETF has outperformed the market over 1/3/5/10Yr time frames. Impressively, MOAT was able to outperform in 2022 despite having nominal exposure to top performing sectors like Consumer Staples, Energy, and Utilities. This speaks to the superior security selection of Morningstar's process.
MOAT's long-term outperformance stems from its focus on high quality companies with strong economic moats that enjoy superior business economics. I believe the MOAT ETF deserves an allocation in long-term investors' portfolios.
Fund Overview
The VanEck Morningstar Wide Moat ETF gives investors exposure to companies that are considered to have durable competitive advantages, according to Morningstar's equity research team. The MOAT ETF tracks the Morningstar Wide Moat Focus Index ("Index"), an index designed to measure the performance of companies with sustainable competitive advantages.
VanEck has been fairly successful with the MOAT ETF, with $7.3 billion in the fund. The MOAT ETF charges a modestly high 0.46% expense ratio.
How Is Economic Moat Determined By Morningstar?
Morningstar has more than 100 equity analysts globally covering hundreds of companies using the same consistent research methodology. One of the key to Morningstar's research process is the concept of Economic Moat. Five key attributes go into the determination of a company's moat: switching costs, intangible assets, network effect, cost leadership, and efficient scale (Figure 1).
Figure 1 - Morningstar's five sources of moat (vaneck.com)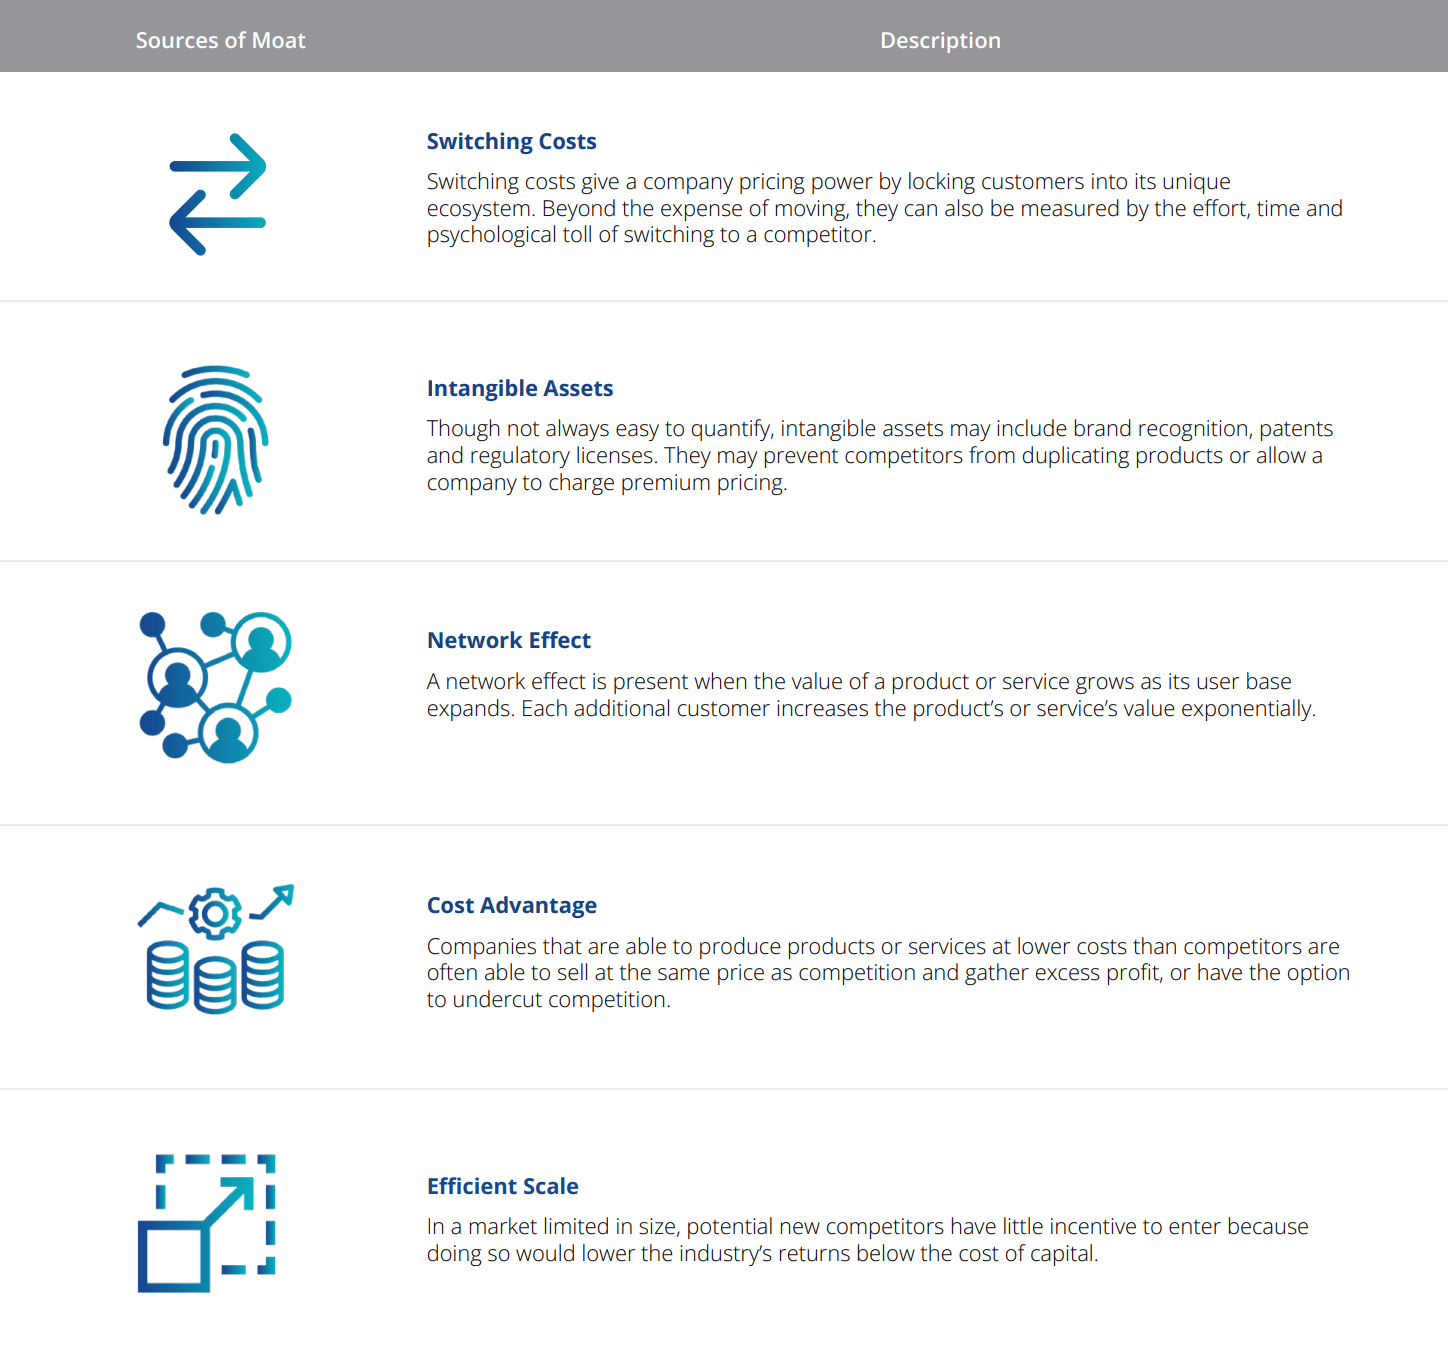
Morningstar analysts systematically go through their research coverage and assess each company's economic moat on a scale of wide, narrow, and none.
Companies considered to have a wide moat scores well on one or more of the attributes mentioned above and is expected to be able to sustain its competitive advantage for at least 20 years. Narrow moat companies are expected to maintain an economic advantage for 10 years, while companies without an economic moat has either no advantage or one that is expected to disappear quickly.
Out of Morningstar's equity research coverage, only 10-15% of companies have a wide moat designation.
Portfolio Holdings
Figure 2 shows the MOAT ETF's sector allocation as of February 28, 2023. The fund's biggest weights are in Information Technology (33.7%), Industrials (17.3%), Financials (11.5%), and Health Care (10.9%). The MOAT ETF notably has no holdings in the Energy sector, because energy companies tend to be price takers without significant economic moats. It is also underweight Consumer Staples and Utilities for similar reasons.
Figure 2 - MOAT sector allocation (vaneck.com)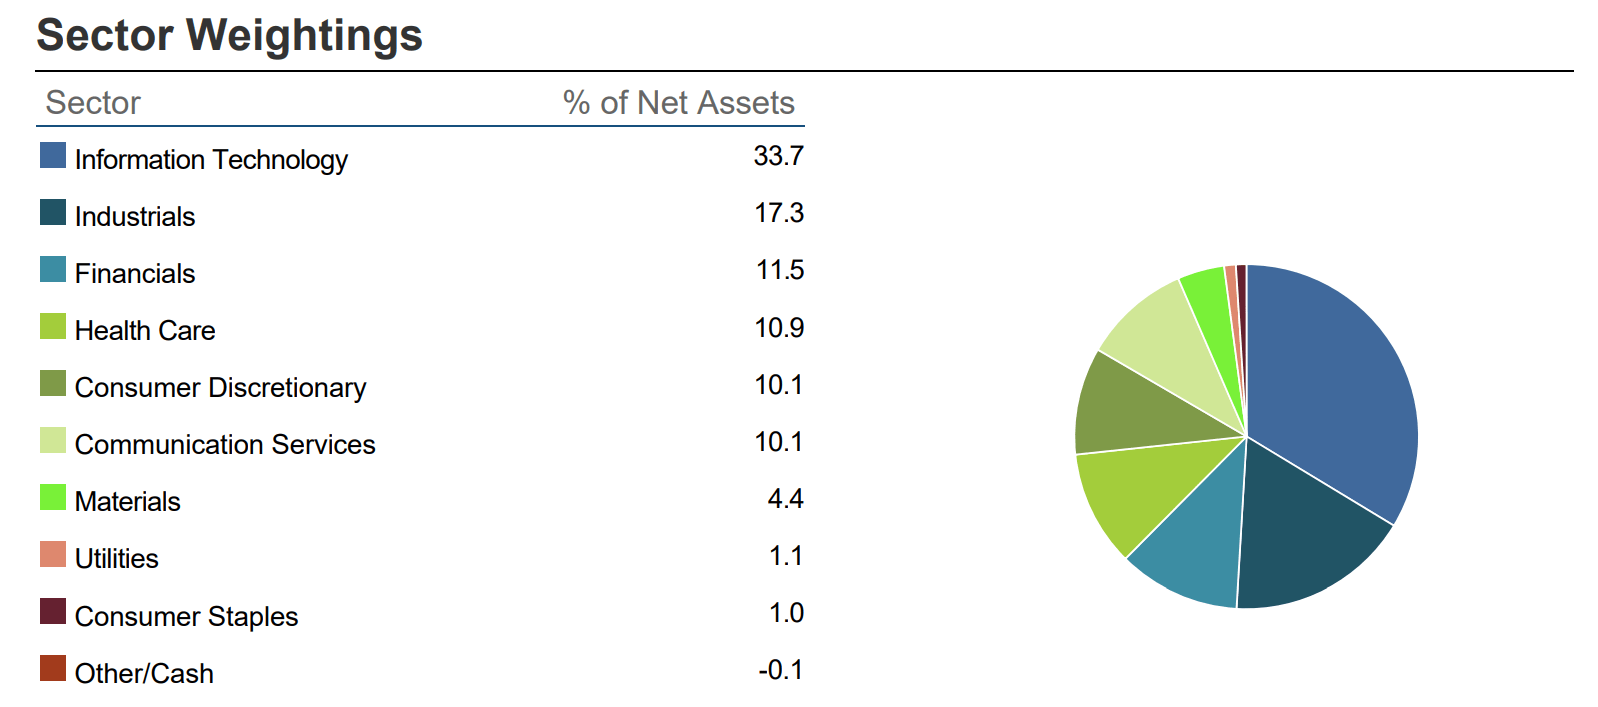
In total, the MOAT ETF has 49 holdings with the top 10 holdings shown in figure 3 accounting for 27.9% of the fund. The fund's top holdings include household names like Meta Platforms Inc. (META) which owns some of the world's largest social networks in Facebook, WhatsApp, and Instagram, and MercadoLibre (MELI), the largest online marketplace in Latin America.
Figure 3 - MOAT top 10 holdings (vaneck.com)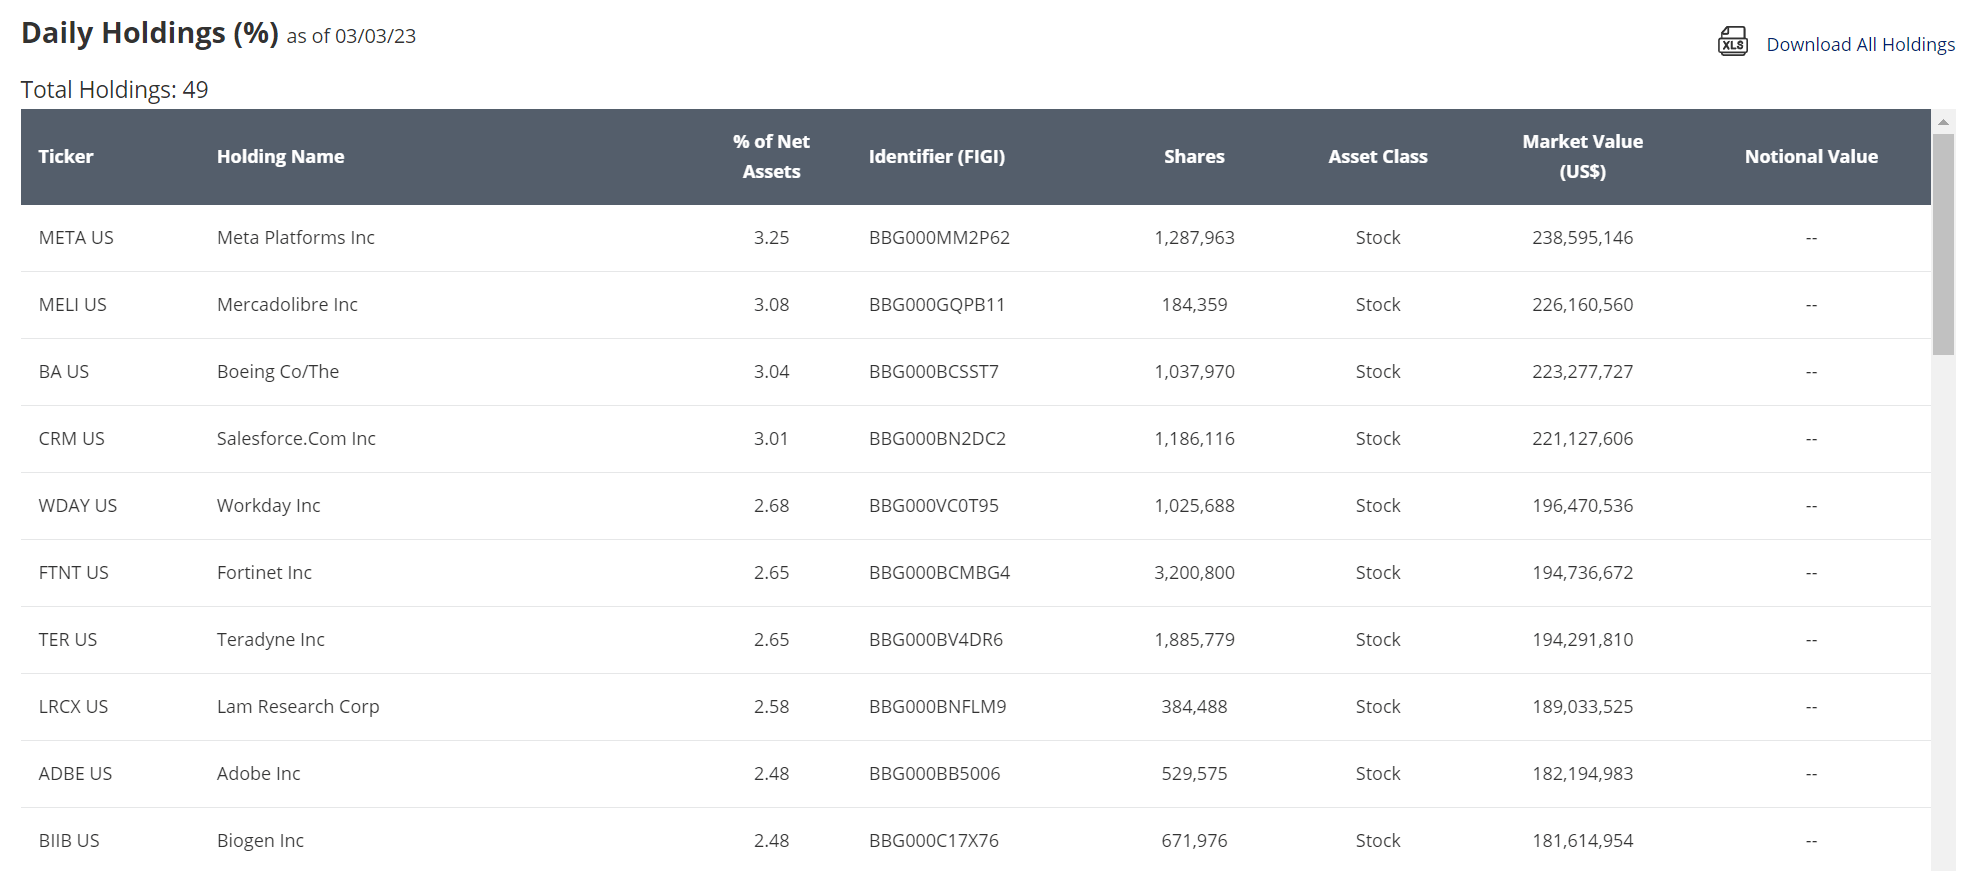
Distribution & Yield
The MOAT ETF pays a nominal annual distribution. For 2022, the distribution was $0.8119 or 1.1%.
Returns
Figure 4 shows the MOAT ETF's historical performance. MOAT has done very well, with 3/5/10Yr average annual returns of 13.5%/12.0%/13.5% respectively to February 28, 2023.
Figure 4 - MOAT historical returns (morningstar.com)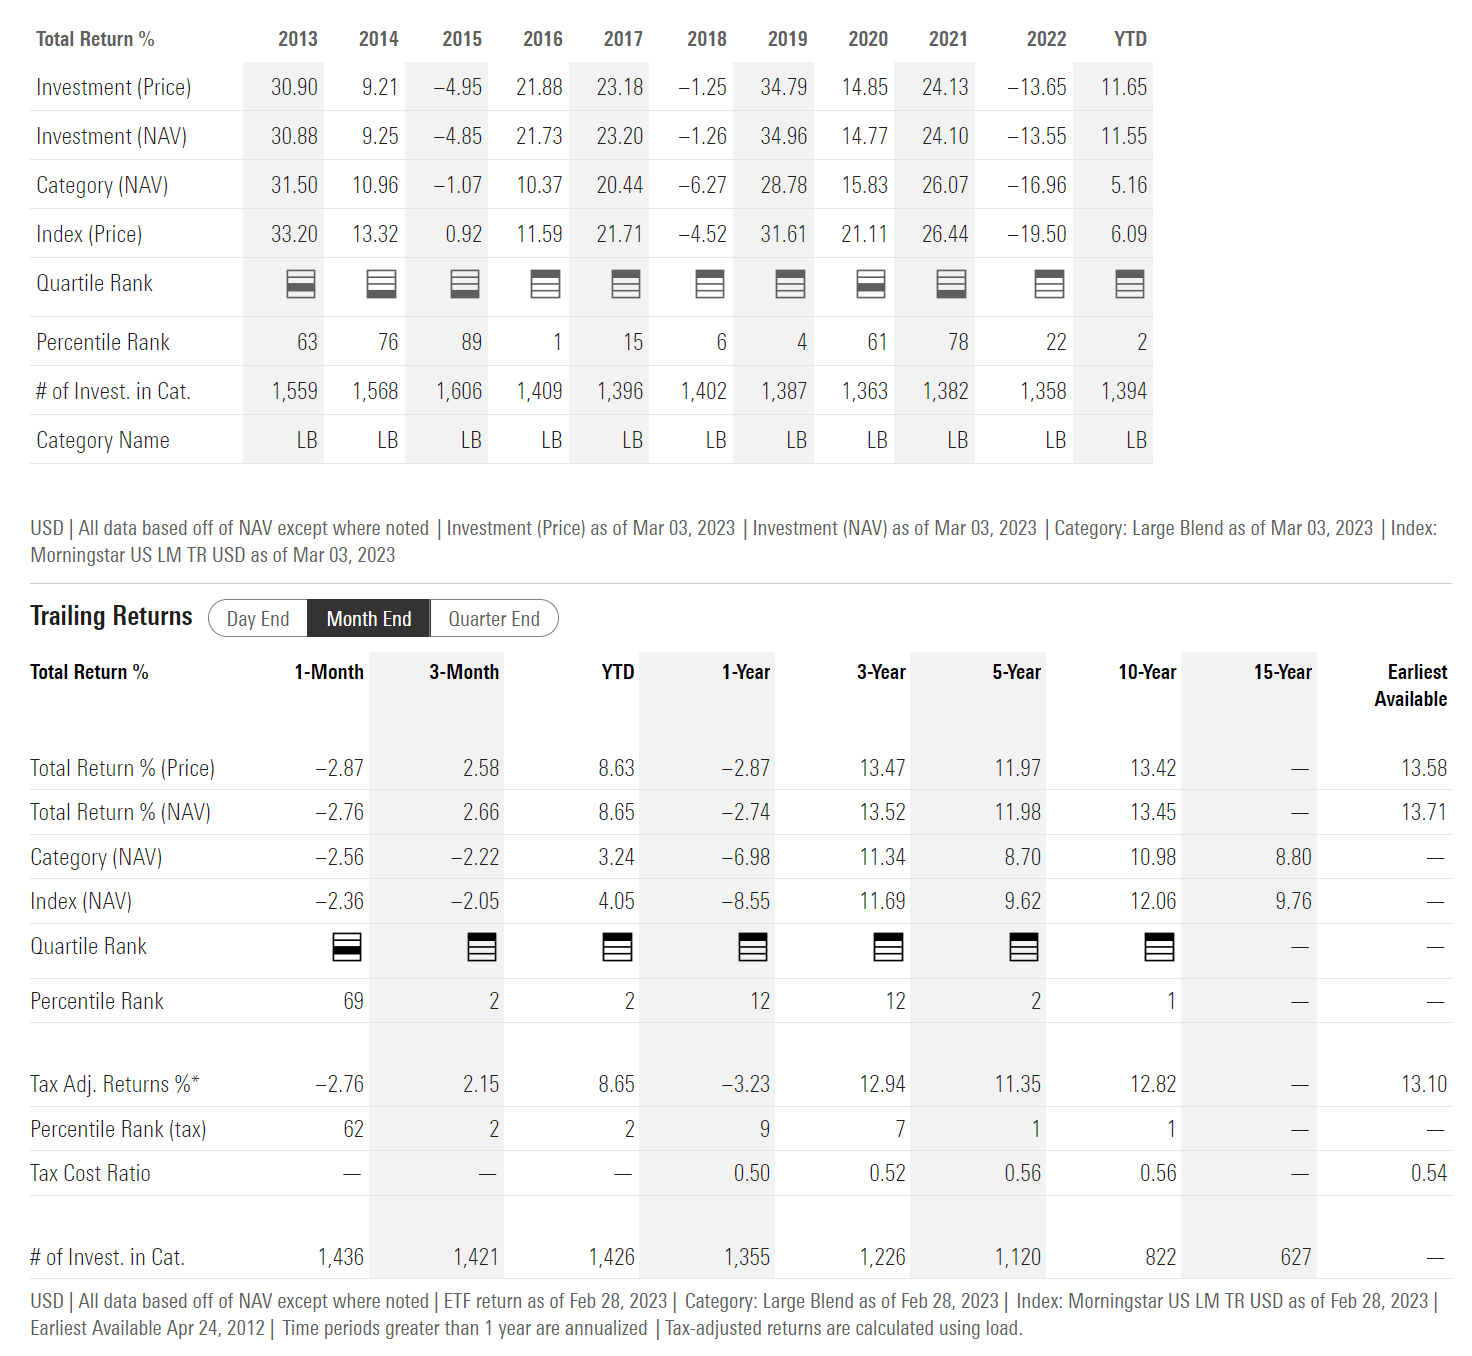
Figure 5 shows the historical returns of the SPDR S&P 500 Trust ETF (SPY) for comparison. The MOAT ETF has impressively outperformed the SPY ETF on a 1/3/5/10Yr timeframe.
Figure 5 - SPY historical returns (morningstar.com)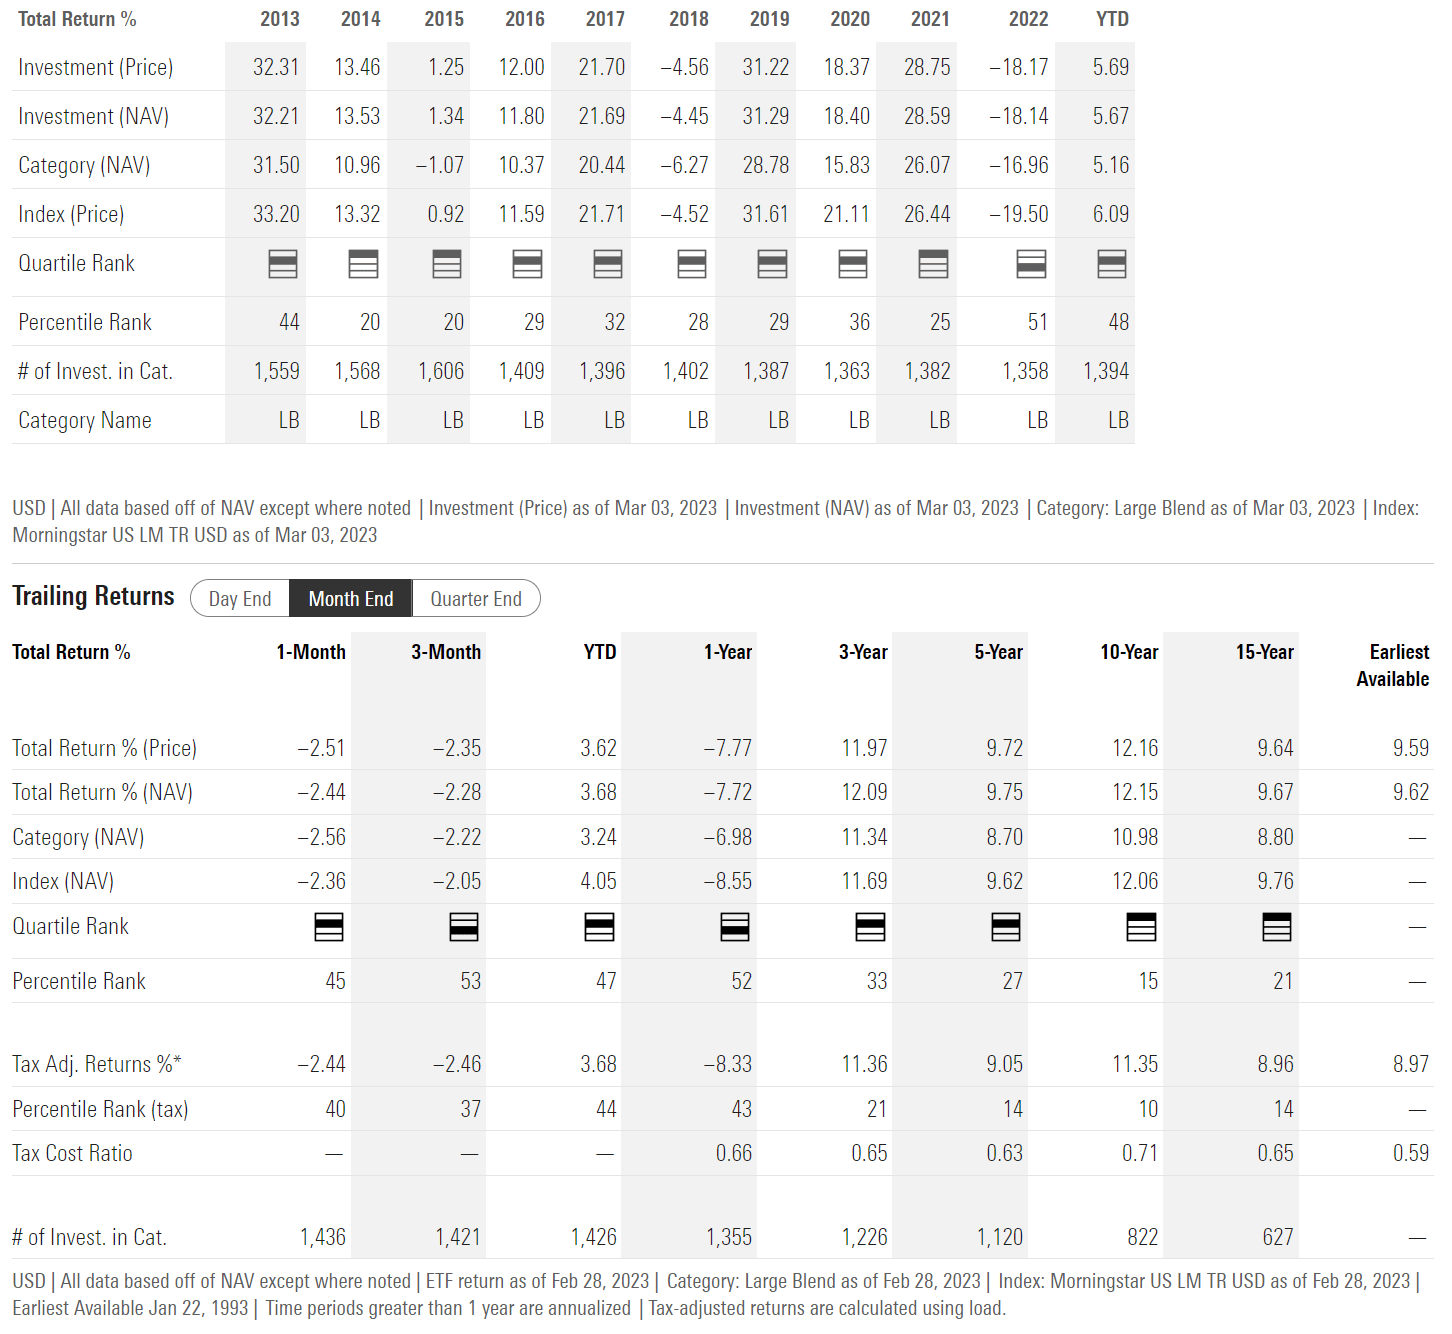
MOAT Outperformed In 2022 With Minimal Weights In Best Performing Sectors
Impressively, the MOAT ETF was able to outperform the SPY ETF in 2022 despite having a combined portfolio weight of only 2.1% in Consumer Staples, Energy, and Utilities, which were the top performing sectors in 2022 (Figure 6). This outperformance suggest the MOAT ETF benefits from the superior security selection of Morningstar's economic moat analysis.
Figure 6 - Consumer Staples, Energy, and Utilities were the top 3 performing sectors in 2022 (sectorspdr.com)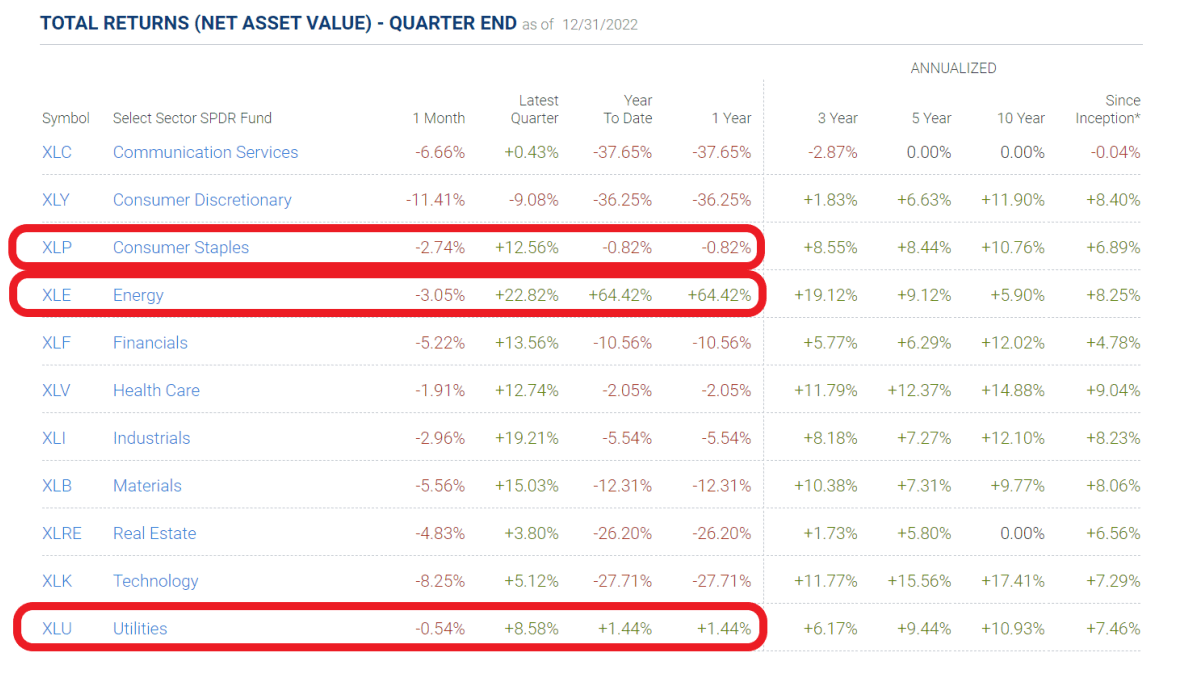
Why Do High Moat Companies Outperform?
As mentioned above, a company with a wide economic moat has a sustainable competitive advantage versus its peers, derived from a variety of sources. This allows the company to maintain its market share or earn extra-ordinary profits over time.
For example, consider META, currently the top holding in the MOAT ETF. META owns 2 of the largest social networks (Facebook and Instagram) in the world, plus a messaging app (WhatsApp) used by hundreds of millions of people. Despite the company stumbling in 2022 from a combination of management mistakes (ill-advised pursuit of the Metaverse) and changing market dynamics (Apple making it more difficult for Meta's apps to track users and target ads), Meta was still able to generate $117 billion in revenues and $34 billion in operating profits.
Meta's moat from network effects (the more people using its social networks, the more valuable and locked-in) allowed the company to weather mismanagement and challenges that might have sunk lesser competitors.
In fact, as the company announced layoffs and cost cuts in recent months and walked back its Metaverse ambitions, META's stock price has more than doubled from its November lows, suggesting META's underlying business is still very strong (Figure 7).
Figure 7 - META has rallied sharply as management dialed back investments in the Metaverse (stockcharts.com)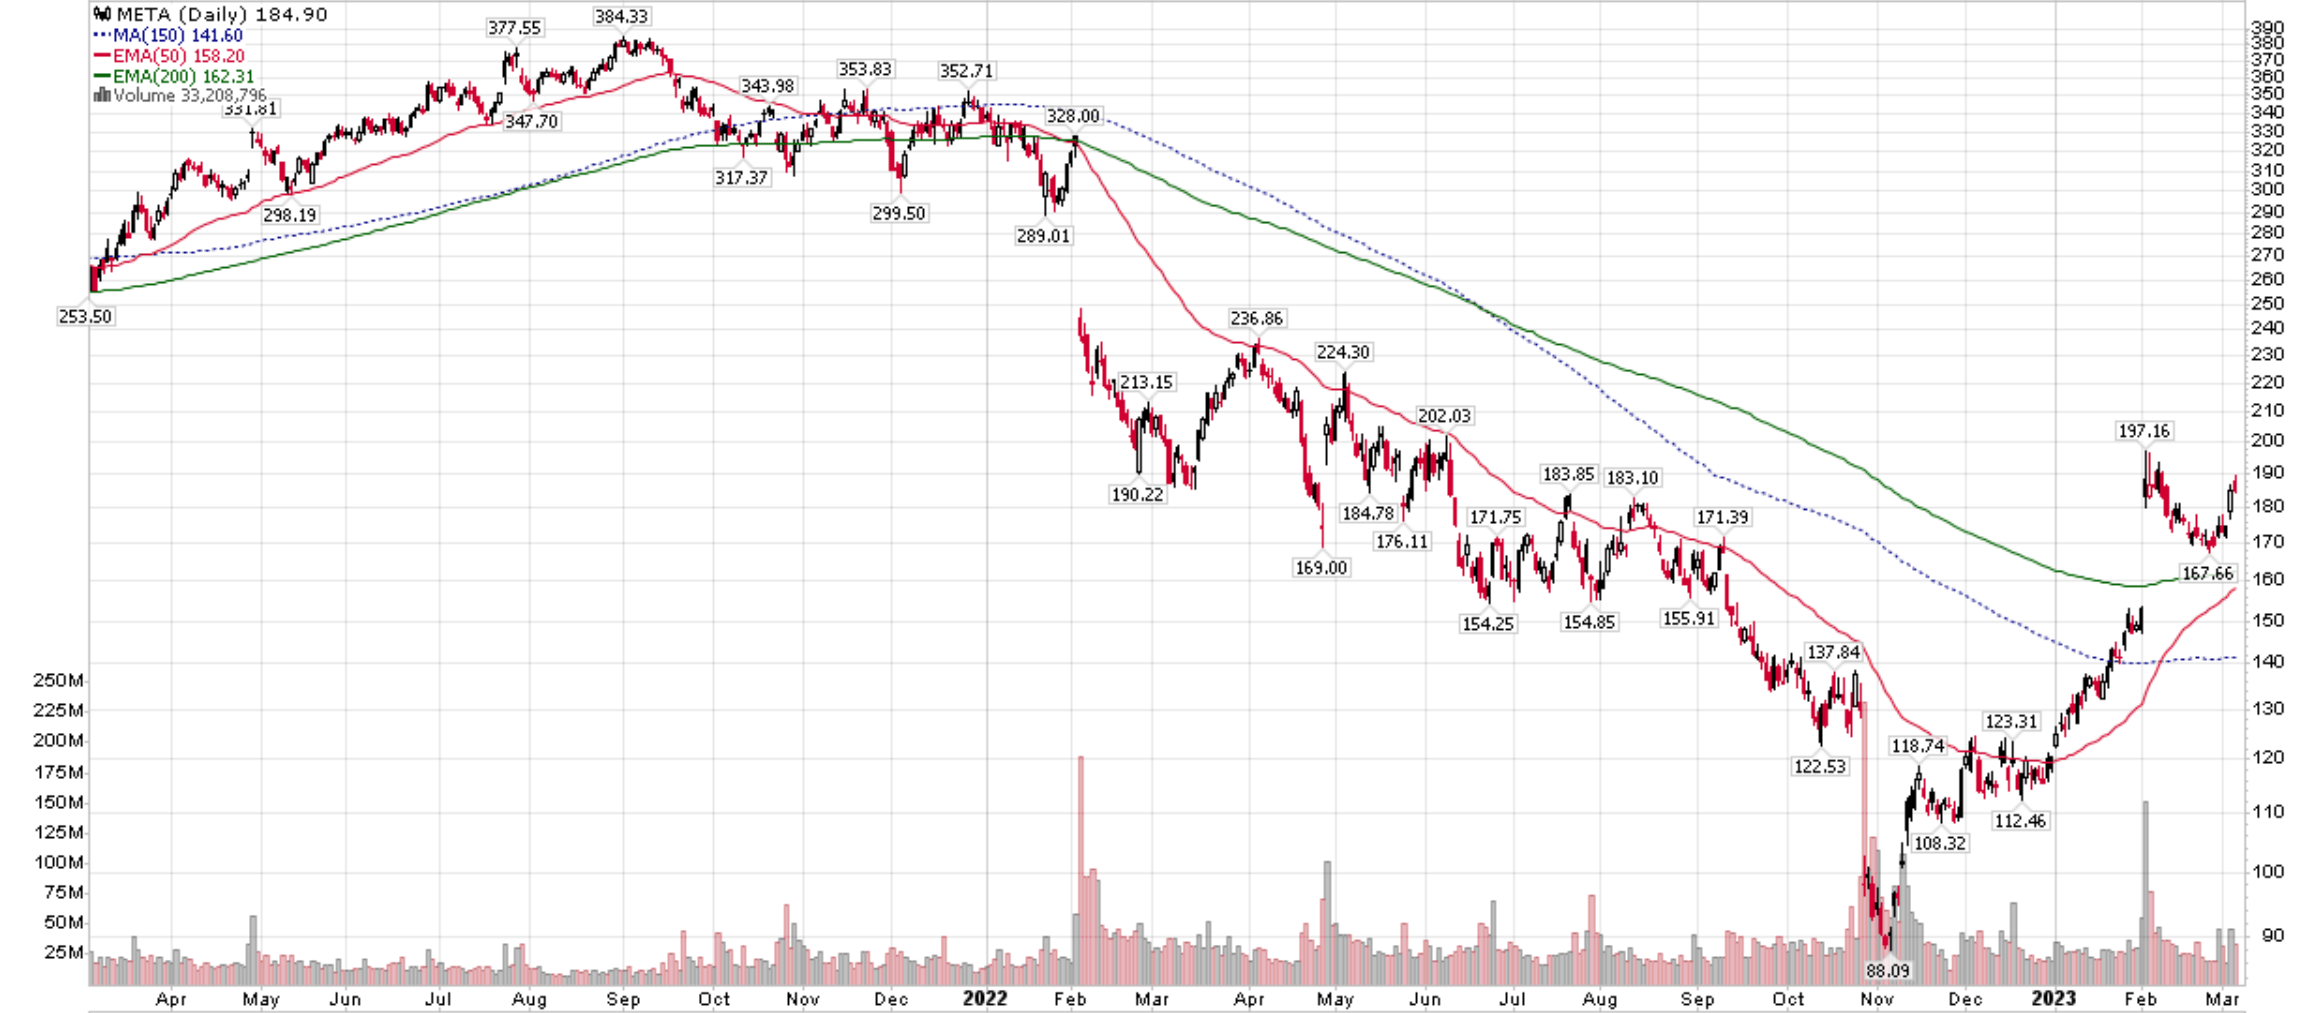
Over the long-run, investing in companies with wide economic moats have been proven to be very lucrative. For example, the MOAT ETF's underlying index has outperformed the S&P 500 Index by over 200% since inception in 2007, despite markets suffering from the 2008/2009 Great Financial Crisis and the 2020 Covid-19 pandemic (Figure 8).
Figure 8 - MOAT Index has outperformed S&P 500 by over 200% since inception (vaneck.com)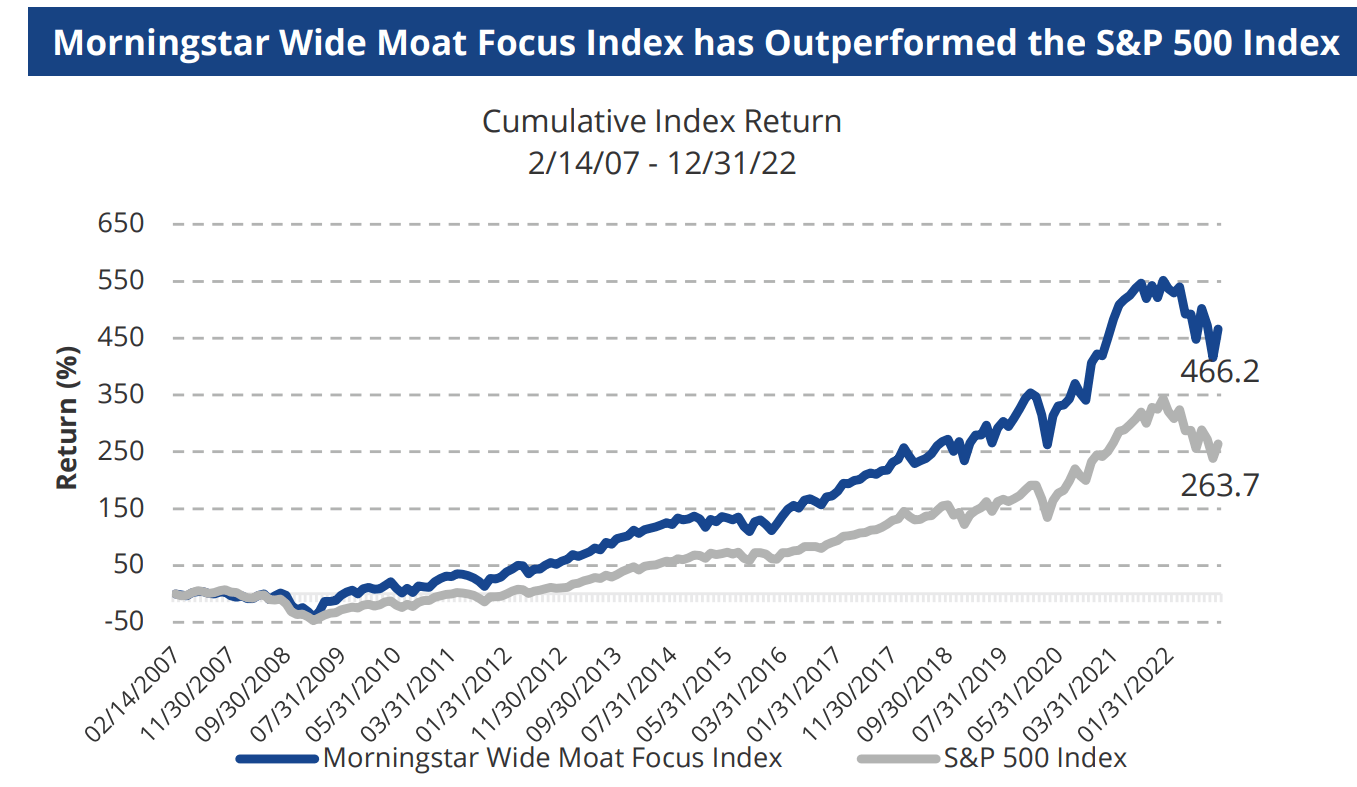
Not only has the index outperformed, the truly remarkable thing is the consistency of MOAT's outperformance. While markets can be irrational over short-time periods, if we analyze the long-term performance of the index against the S&P 500 Index, we can see that the MOAT Index has outperformed 84% of the time on a rolling 3-year time horizon and 95% of the time on a rolling 5 year time horizon (Figure 9).
Figure 9 - MOAT outperforms consistently (vaneck.com)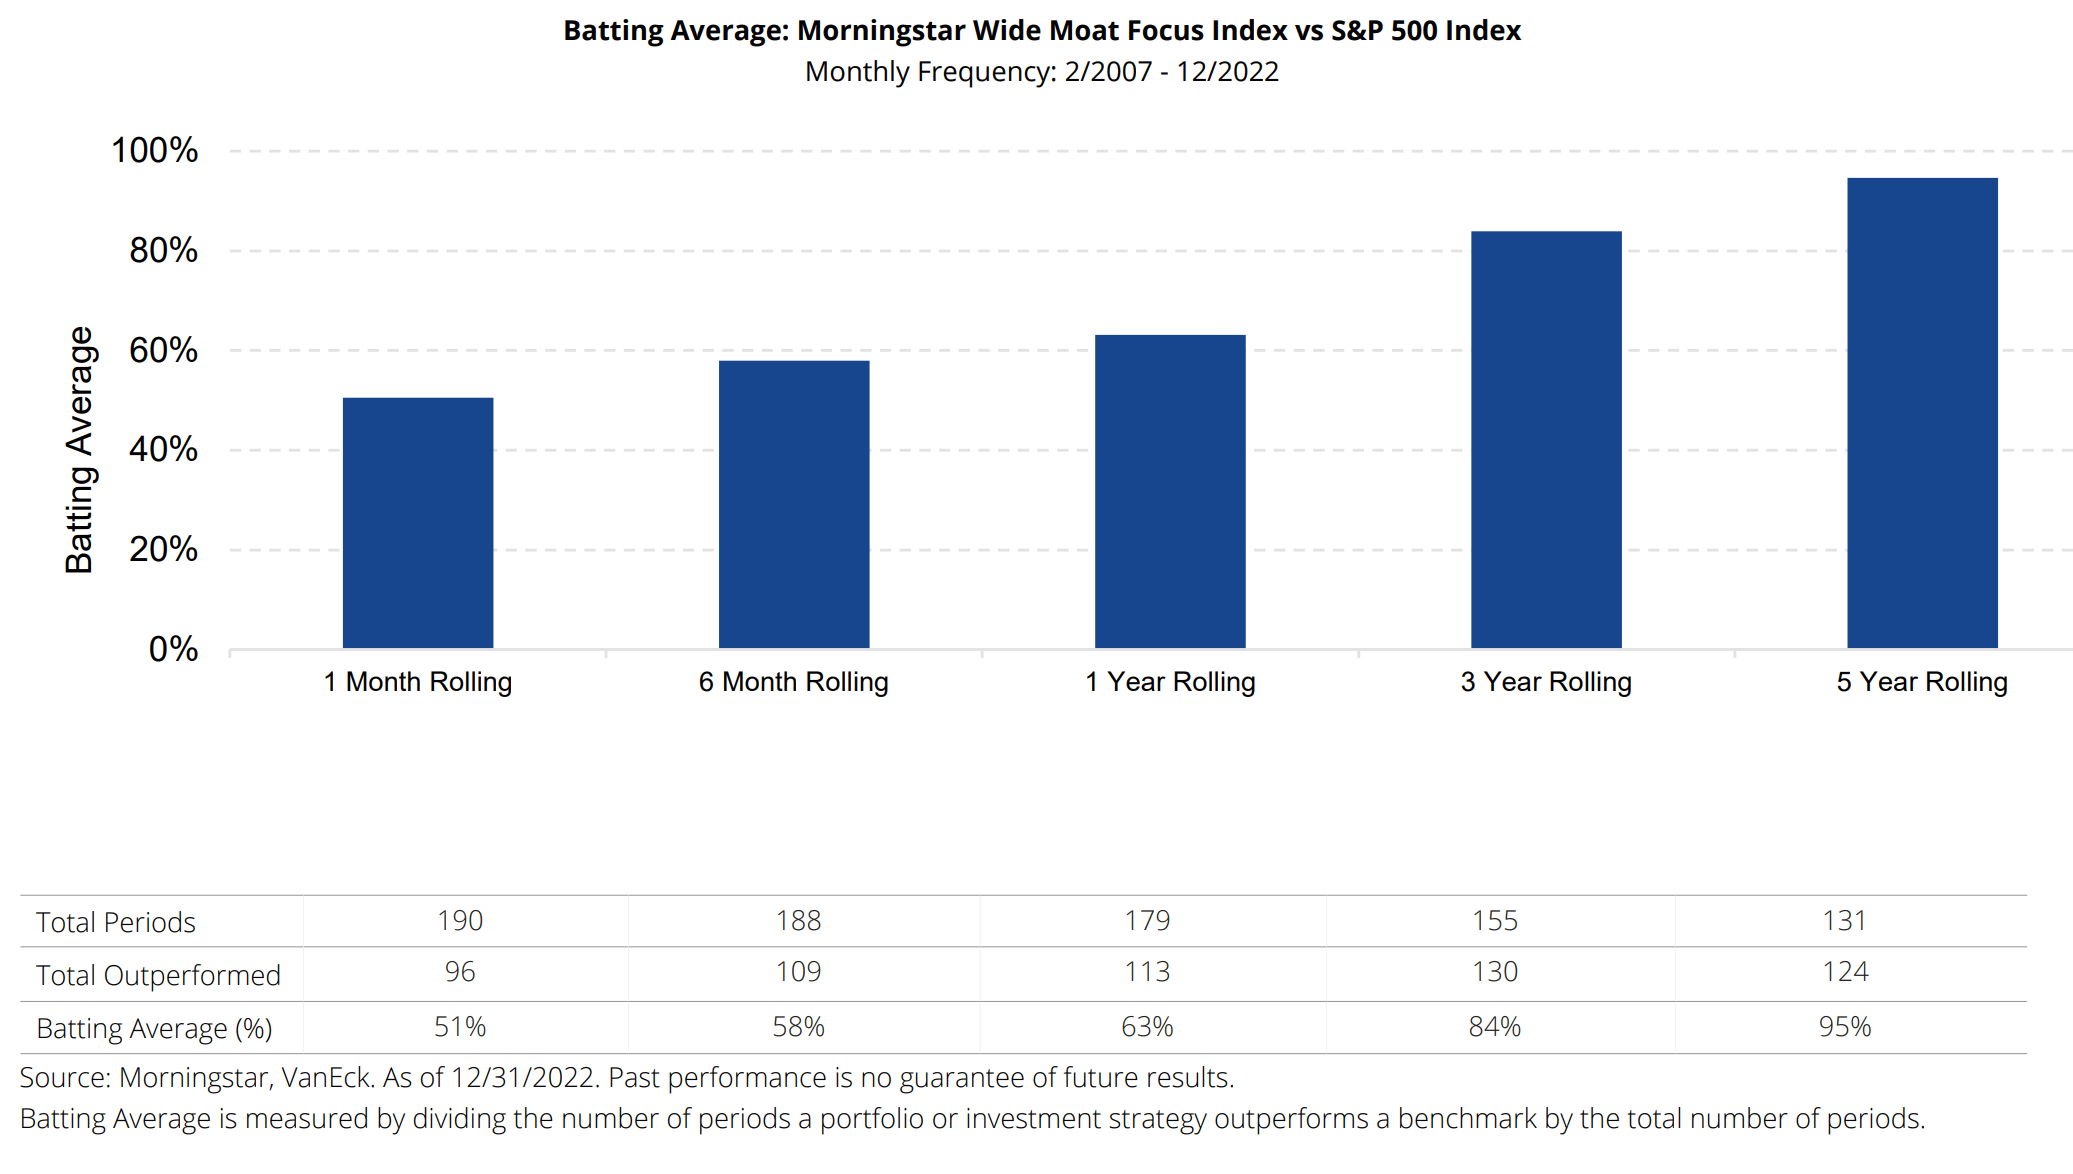
Conclusion
The MOAT ETF gives investors exposure to companies deemed to have superior economic advantages by Morningstar's team of over 100 equity analysts. The MOAT ETF has strong historical returns that have outperformed the SPY ETF over 1/3/5/10Yr time frames. In fact, what I find most impressive about the MOAT ETF is that it was able to outperform the market in 2022 despite having nominal weights in the top performing Consumer Staples, Energy, and Utilities sectors.
I believe MOAT's outperformance stems from its focus on high quality companies with strong economic moats that enjoy superior business economics over the long run. MOAT's attractiveness shines through if we look at the ETF's performance over the long-run, as it has outperformed the S&P 500 Index 95% of the time on a rolling 5 year basis. I believe the MOAT ETF deserves an allocation in long-term investors' portfolios.
This article was written by

Disclosure: I/we have no stock, option or similar derivative position in any of the companies mentioned, but may initiate a beneficial Long position through a purchase of the stock, or the purchase of call options or similar derivatives in MOAT over the next 72 hours. I wrote this article myself, and it expresses my own opinions. I am not receiving compensation for it (other than from Seeking Alpha). I have no business relationship with any company whose stock is mentioned in this article.