The Rule Of 20 And Why Stocks Could Fall 10-20%

Summary
- Powell was unsurprisingly hawkish this week as economic data continues to surprise to the upside.
- Inflation data has also moved higher. We get CPI data next week. Any disappointment could be met harshly by investors.
- The economy is strengthening. Both ISM and S&P Manufacturing data have improved, with Services data particularly robust. Consumers still want to travel, shop and dine out.
- Large-cap stocks remain at elevated valuations, which is particularly surprising given the rate and inflation picture.
- Below we discuss the Rule of 20 and its strong track record of signaling entry points in stocks.
- Looking for a helping hand in the market? Members of Cash Flow Compounders get exclusive ideas and guidance to navigate any climate. Learn More »

cemagraphics
The Rule of 20
We all know that interest rates are the “gravity” to equity valuations. Higher interest rates rightly correlate to lower P/E ratios. Bonds become more interesting than stocks when they are yieldier, and of course we all know that stock values are (at least theoretically) the present value of their future cash flows. Higher discount rates naturally equate to lower equity valuations.
One simplistic measure of this is Peter Lynch’s Rule of 20.
This suggests that stocks are attractively priced when the sum of inflation and market P/E ratios fall below 20. Today CPI is running at 6.4% year over year, and P/Es for the S&P 500 are 18.3x. That totals 25, a bubbly type figures for the markets.
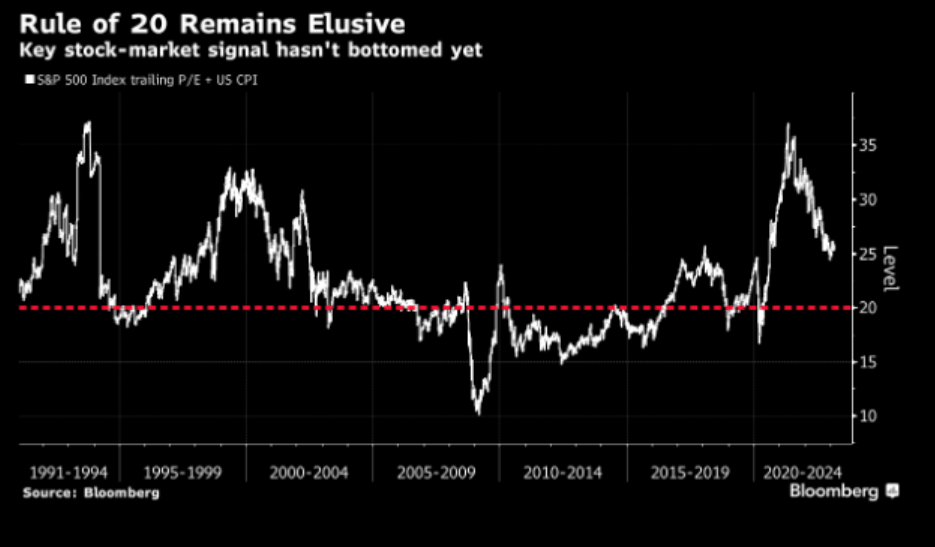
Rule of 20 Chart (Bloomberg)
While simplistic, this measure has a solid track record of signaling buying opportunities in the market. Today, stocks look quite pricey.
There is an argument to be made (we have) that housing prices are wrongly calculated (they are) in the CPI data. Still, per our adjustments/estimates, last month’s inflation reading implies 3.5-5% type run rate inflation (depending on how you measure shelter costs). Those adjustments still put the measure well over 22. No bargains, at least for the S&P 500.
To get to a sub 20 level, assuming inflation falls to 3.5%, we need stocks roughly to trade to 16x earnings.
From current levels, that is roughly 3500 on the S&P 500, down 10%. If inflation becomes stickier, then at 5% CPI and stocks could re-rate to 14x earnings, or down 20% from here.
Of course, the market can stay irrational for a long time, and we are not in the business of predicting valuations. Simply put, stocks are not cheap, at least for the S&P 500.
Below we will compare small and midcap valuations to the S&P. In short, they appear far more interesting today.
Investment Grade Bonds and Systemic Risk With Respect to US Government Debt
Below are yields on the investment grade bond index.
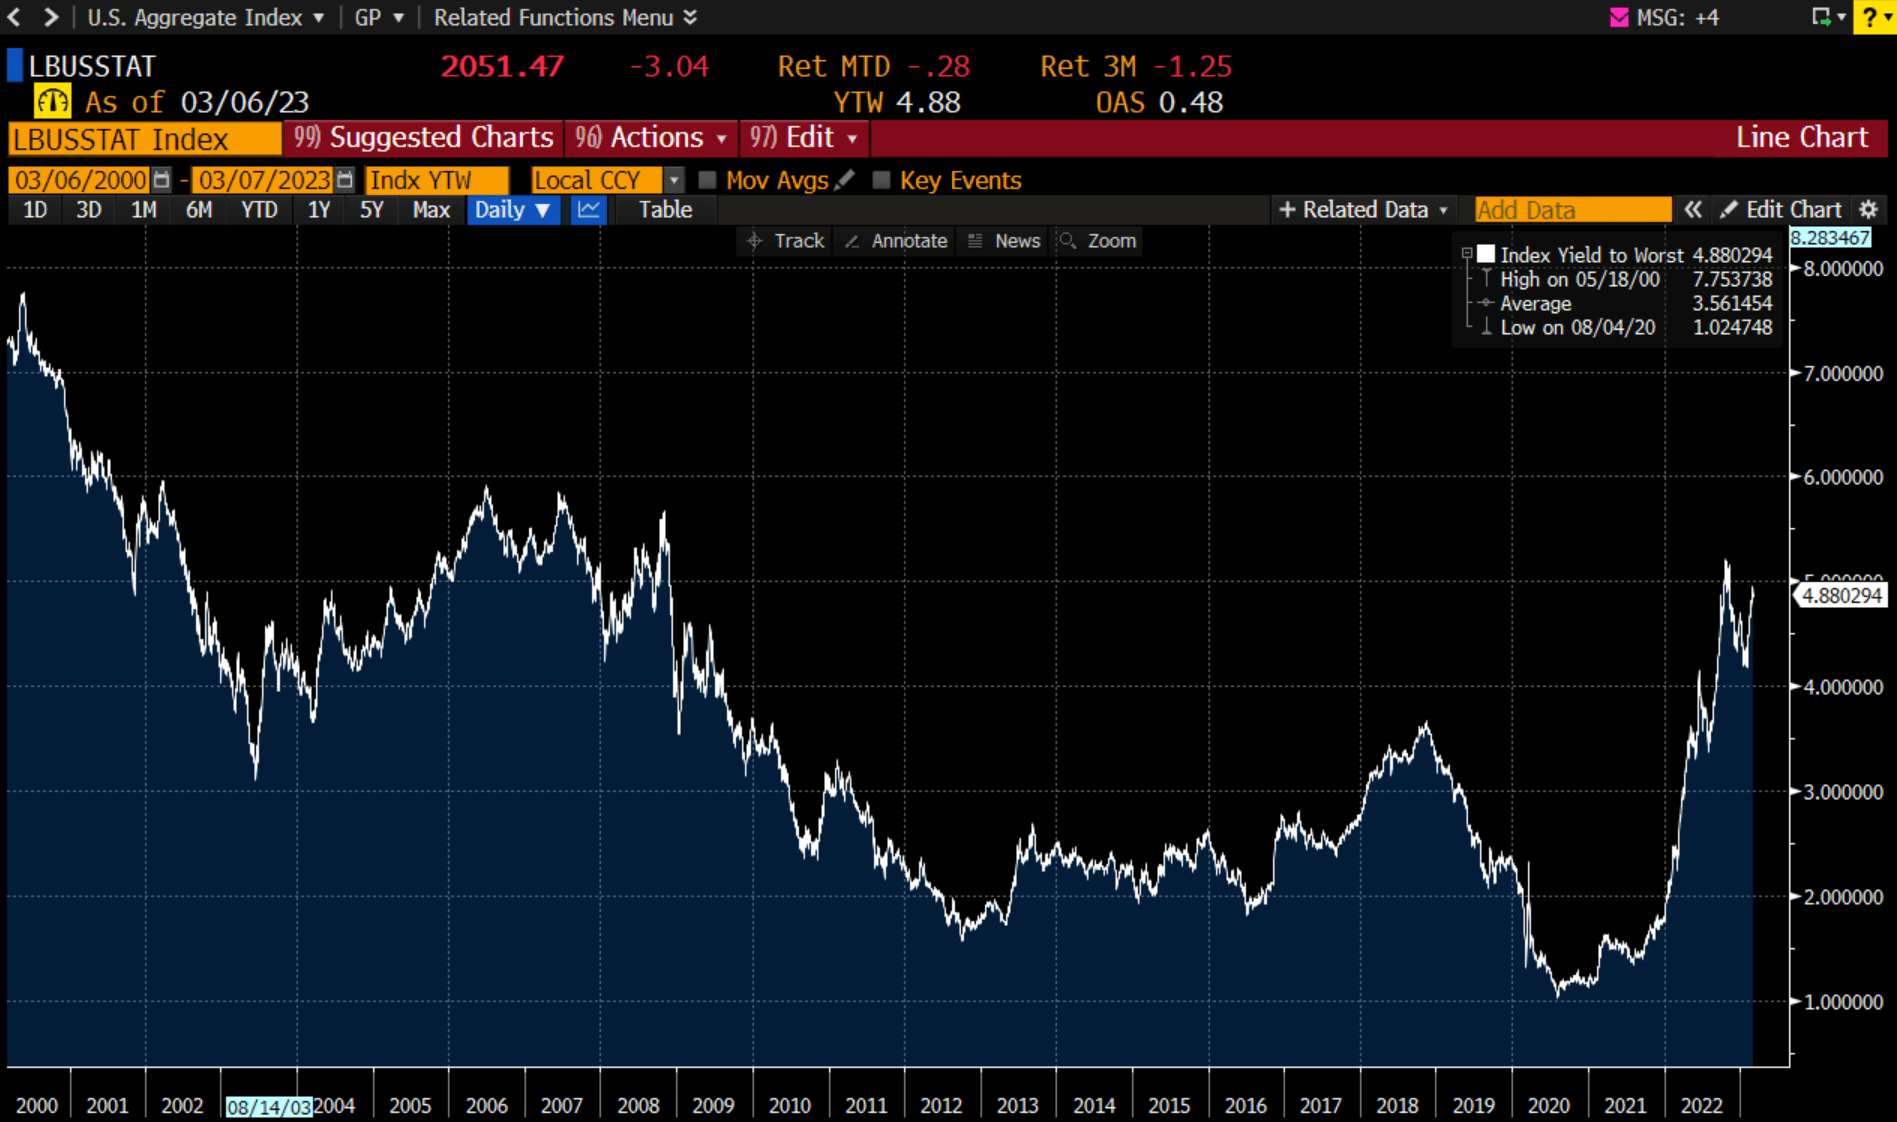
IG Bond Yields (Bloomberg)
At 4.9% investment grade bond yields, we are seeing attractive names that we are buying (and wrote about a nice ~7% yielding cash covered bond for subscribers).
Relative to Treasuries, spreads are actually a bit tighter than average. Spreads currently are 48 basis points vs a 10 year average of 54 basis points (that is, the extra yield one can earn on a corporate bond relative to a similar duration US Treasury bond).
We have written numerous times that the risk in the system today is more geared toward US government bonds. Consumer and corporate balance sheets are in better shape than they have ever been. However, prior and current administrations, plus a healthy dollop of excess Covid spending, have pushed US levels of debt to egregious levels.
Below is US Debt/GDP. Typically over 140% signals stress. We are in the high 130% ballpark.
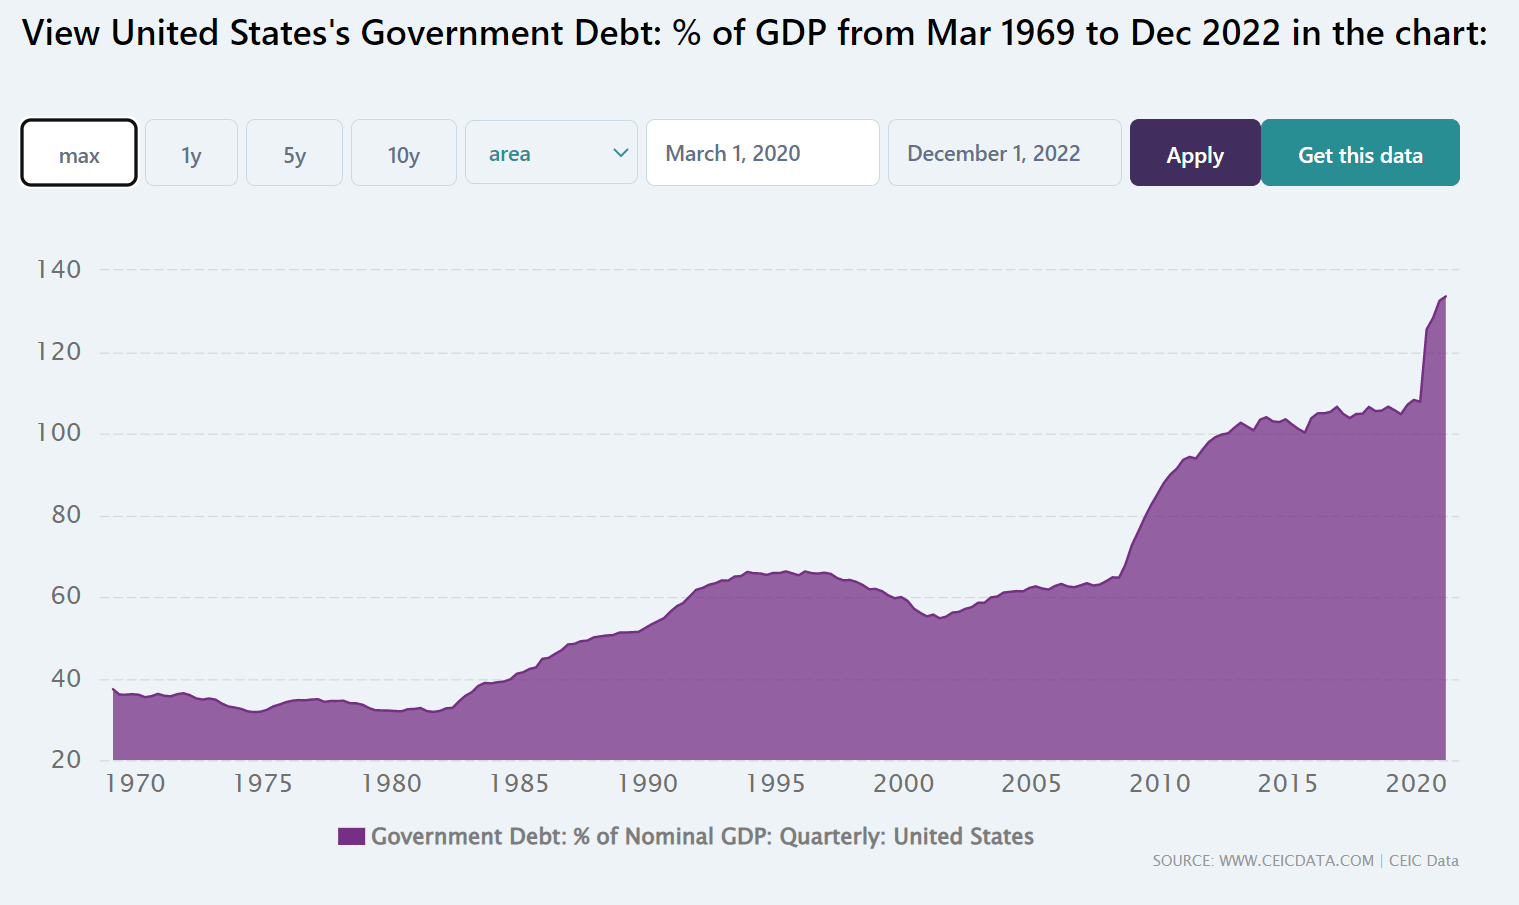
US Debt to GDP Ratio (CEIC Data)
The hypocrisy of US government regulations with respect to bank balance sheets is beyond the scope of today’s discussion. But it is abundantly clear that growing levels of public debt is a threat to the entire financial system. Long term, something will have to give. Either the US government cuts its deficits (dramatically) or simply inflates its way out of debt.
At 5.0% interest rates, $31.5 trillion in US debt works out to $1.6 trillion in interest payments each year (from $475 billion last year). The average duration of US government debt is roughly 5 years, so it will take about 10 years before all current debt is refinanced. But the pressure on our system will mount every year that yields stay elevated. This is worrisome in a higher for longer scenario. At $1.6 trillion in interest, the US is staring at a shocking 6% of GDP (just to cover servicing the debt).
We bring this up as we may even reach a tipping point in 2023. With Republicans pushing for spending cuts out of Washington, they plan to fight raising the debt ceiling. Partisan hostility in Congress has reached seemingly all-time highs, which could lead to a lot of systemic uncertainty later this year over the budget.
Goldman estimates that this battle will be waged in August. It is a complex game of chicken that could go awry. In the worst case scenario, the debt ceiling is not raised, forcing the government to shut down. Even a short term default scenario could have far reaching consequences (defaulting not only on Treasury maturities and interest payments but also on social security payments and government workers’ paychecks).
With only 3% of those surveyed worried about the debt picture, clearly there is a lot of complacency surrounding this issue.
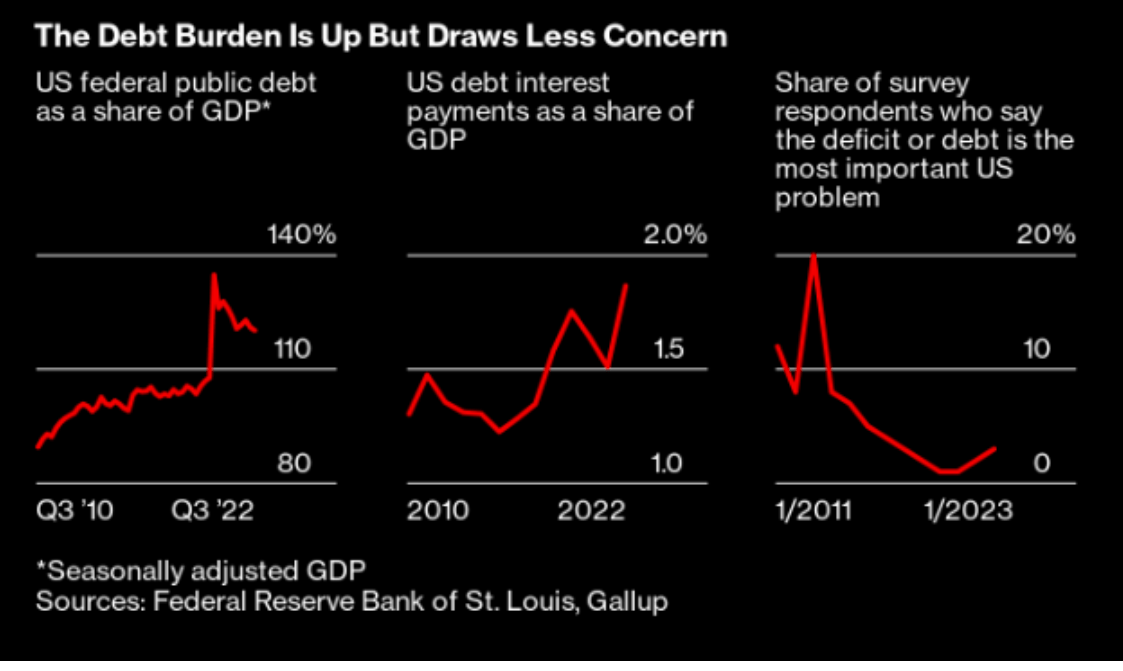
Bloomberg, Gallup. Federal Reserve
Any hiccups could induce a heavy dose of panic selling. In 2011, Standard & Poor’s downgraded US government bonds to AA+ from AAA. From the time when S&P put Treasuries on negative watch in April 2011, the stock market dropped 19% from peak to trough.
On the other hand, in October 2013, a spending showdown did not impact valuations for the S&P. Still, at the time equities were trading at 14x forward earnings roughly, valuations 30% lower than today (despite inflation being a non-issue back then).
What To Own in a Debt Driven Inflationary Spiral?
Other economies that have suffered through high sovereign debt levels followed by currency devaluation and inflation, suggests that the best means of protecting one’s wealth is to own other currencies, real estate, and equities with pricing power. Commodities can also hold their value, but the better bet there is to own commodity equities, not commodities outright (they underperform in virtually all long-term scenarios). Coca-Cola can raise prices in an inflationary world. Oil prices tend to rise during inflation. Bonds get destroyed.
So, we are overweight energy (still, despite cutting our E&P exposure) via MLPs/royalty trusts, long copper and a number of financials which will benefit from higher rates (as we view corporate and consumer loan risk as low).
Best to avoid US government long dated bonds or long duration municipal bonds (which are quite rich on a spread basis relative to history).
Valuations By Asset Class
Our updated valuations by asset class are below.
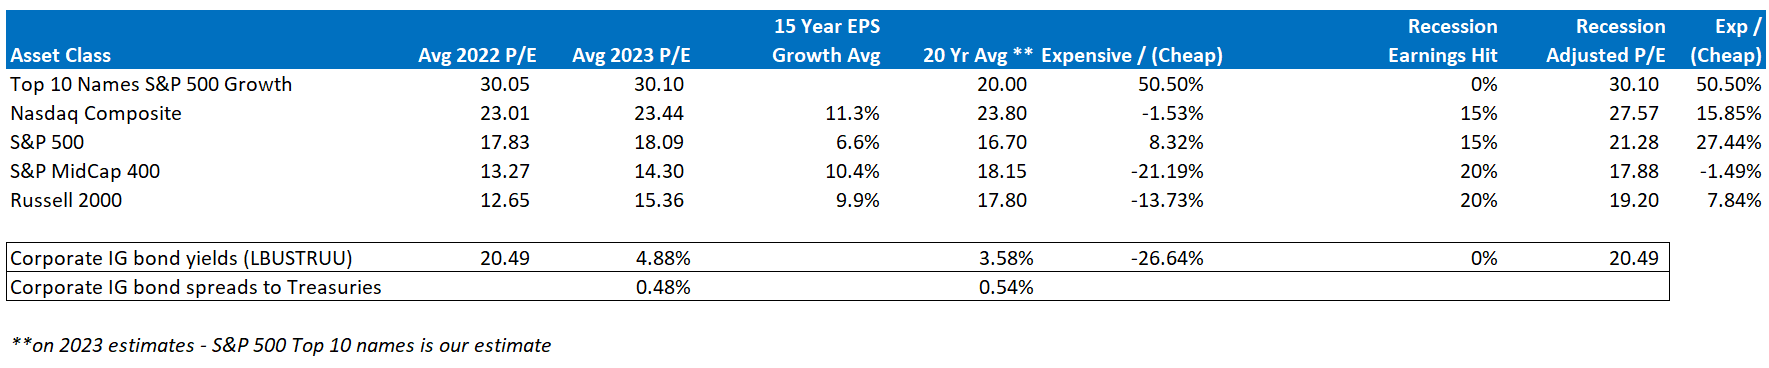
Valuations by Asset Class (Bloomberg/Author Spreadsheet)
Oddly, stock valuations are aligned by size. The bigger the market cap, the richer the valuation. This is contrary to the notion that higher growth companies should trade at a premium. History also suggests that smaller cap names, with their better growth track records, should trade higher. Does it make sense that the Nasdaq trades at 23x earnings and the MidCap 400 trades at 14.3x earnings? Growth has been similar over the past 15 years, and likely will be similar over the next 15.
Given this, we like small and midcap stocks, as well as investment grade and crossover high yield, short duration credit.
Per the Rule of 20, if inflation moderates to 4-5%, then small and midcap stocks look borderline cheap already. We have been migrating portfolios more and more to international names and smaller, out of favor equities.
Conclusion
The S&P 500 is trading about 10% rich to what history suggests is fair value. Inflation would need to drop to 1% for current equity levels to screen cheap/attractive. That said, we frankly have no idea when or if equities decline from current levels, but merely point out the risk to equities from here. The Fed is growing increasingly hawkish as inflation data remains elevated. Inflation in Europe moved higher last month to 0.8% month over month. CPI was up 8.5% year over year in the EU.
The rally in 2023 so far has been predominantly in higher beta/higher risk equities. We think it makes little sense that the Nasdaq is up 10% year to date and the Dow Jones down 1.5%. Healthcare stocks are down 7% year to date. Chasing riskier stocks today looks particularly dangerous indeed, especially if the Fed is forced to raise rates enough to cause a recession.
Thanks for reading! We seek out high quality stocks trading at attractive valuations in our Marketplace service entitled Cash Flow Compounders: The Best Stocks in the World. Our focus is high return on equity, high free cash flow stocks with a proven track record in compounding earnings at higher than market rates. There we provide in depth research, with 2-4 new, high quality ideas per month. My picks going back to 2011 have produced just under 30% annual returns, putting me well within the top 1% of bloggers (TipRanks). Sign up for a free 2 week trial to get my latest ideas!
This article was written by

I am a former hedge fund portfolio manager who trades for my personal account. I espouse Graham and Dodd/Buffett style investing, always on the lookout for high-quality equities at attractive valuations. A graduate of Vanderbilt University with an MBA from Northwestern's Kellogg School of Management, I lived in NYC for a decade before relocating to the Charlotte, NC area with my family.
I am collaborating with NJ Value Investor on my Marketplace service Cash Flow Compounders.
Disclosure: I/we have a beneficial short position in the shares of QQQ, SPY either through stock ownership, options, or other derivatives. I wrote this article myself, and it expresses my own opinions. I am not receiving compensation for it (other than from Seeking Alpha). I have no business relationship with any company whose stock is mentioned in this article.