Where Will Campbell Soup Stock Be In 4 Years?

Summary
- Campbell Soup has been a very slow growth business for the past decade.
- Slow growth businesses can be okay investments if the valuation is cheap enough, but are rarely good investments if the investor pays too much.
- In this article, I use an earnings-based method to analyze the valuation and estimate where the stock is likely to be in 4 years.
- Looking for a helping hand in the market? Members of The Cyclical Investor’s Club get exclusive ideas and guidance to navigate any climate. Learn More »
VelhoJunior
Introduction
I last covered Campbell Soup (NYSE:CPB) a few months ago with my "Sell" article "Campbell Soup Stock Is Dead Money". In the conclusion of that article, I didn't mince words with regard to Campbell's stock valuation.
Even if a person was generous and assumed a 3% earnings growth rate for Campbell long-term. The stock is trading at a P/E multiple over 18. That's a PEG ratio of 6! It doesn't make any rational sense for this business to trade at that multiple. None.
It has only been a few months since that article was published, but so far, Campbell has performed as expected:
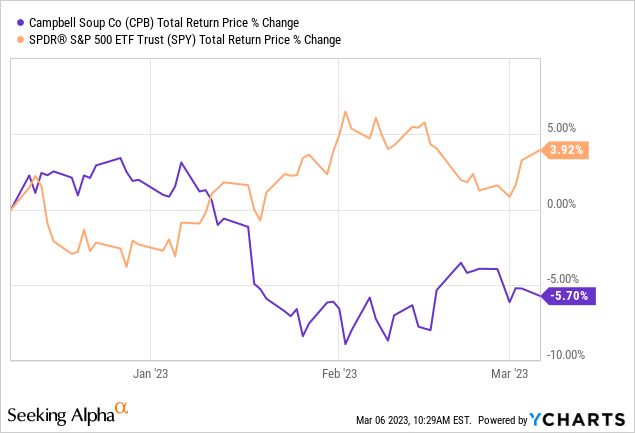
This is the sort of steady decline we might expect from an overvalued staples company in a rising interest rate environment.
It didn't appear that my last Campbell article changed many minds, so in this article, I'm going to perform a slightly different analysis that focuses on the likely four-year returns of Campbell stock compared to the S&P 500 index and cash (rather than a 10-year CAGR expectation as I used in my previous article). My hope is that framing the valuation as 4-year expected returns will be more immediate (four years instead of 10 years) and clearer (a total return instead of a CAGR estimate).
This article will be part of a new series I'm writing about the ability to roughly predict stock prices using valuations for steady-earning businesses over the medium term of four years. I often receive feedback on my articles that stock valuations of the sort I share on Seeking Alpha are not useful for predicting or improving one's returns. These critiques come in a couple of variations. One of them states that investors should just buy the stocks of quality businesses whenever they find them regardless of price. Another, the flip-side of this thought process, is that stocks shouldn't be sold based on valuation because that is "market timing" and it cannot be done successfully on a consistent basis. I strongly disagree with both critiques, so I will be systematically tracking the results of my 4-year return estimates for dozens of stocks like Campbell Soup in an effort to hopefully demonstrate the usefulness of earnings-based valuations. (More on this experiment later in the article.)
Valuation
The first thing I check with almost every stock before I start the valuation process is the business's historical earnings cyclicality. I generally require at least one recession as part of the data so I can see how earnings performed during that recession. Because 2020's recession was so unusual, I place most of the weight on the 2008/9 recession when examining the historical earnings cyclicality. This can also help me assess the long-term earnings trend, which I require to generally be growing over time. (I don't have any interest in buying the stock of shrinking businesses or turnaround stocks.)
FAST Graphs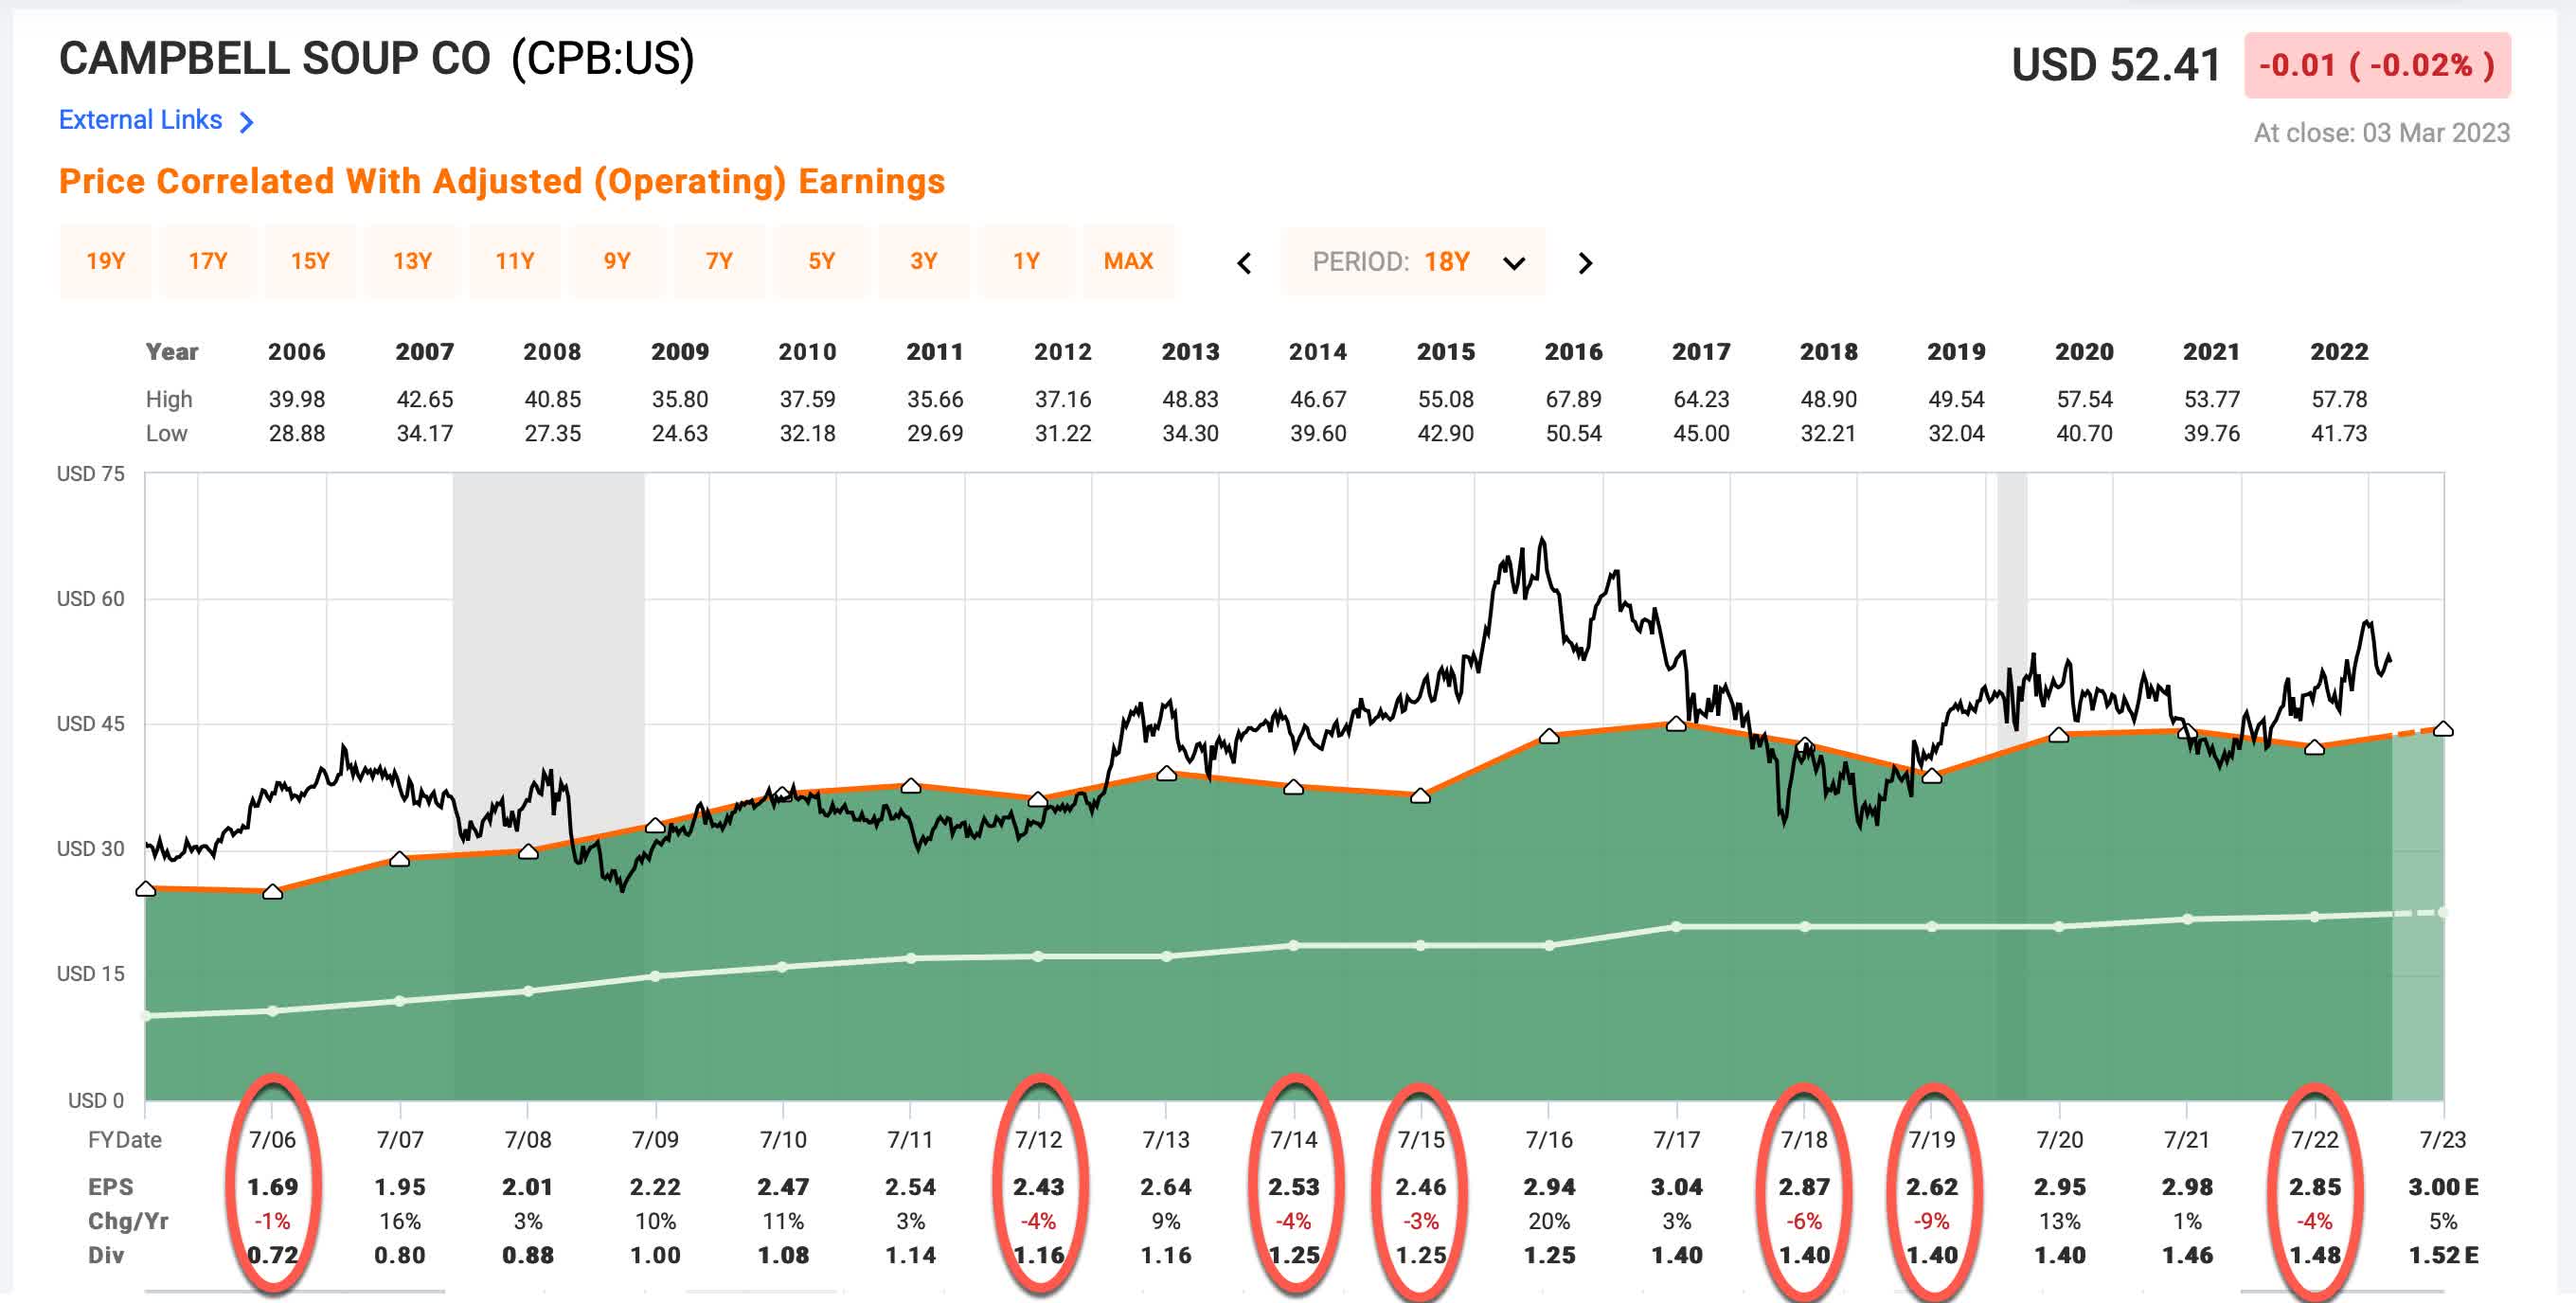
Since 2005 Campbell Soup has experienced seven years where EPS declined from the previous year. This is a very high number of years for an S&P 500 stock to experience EPS growth drawdowns. However, all the declines are less than -10% per year, so they are also extremely shallow. Additionally, while the stock price tends to decline in recessions, the earnings have grown during the past two recessions, which at least makes the business counter-cyclical to some degree, even if the stock hasn't necessarily been so.
In the end, Campbell's low earnings cyclicality means that it's pretty easy to use an earnings and earnings growth based valuation technique to value the stock, which is what I will do in this article.
Next, I need to select the historical time frame I want to use in order to estimate the earnings growth rate going forward. I will use a time frame from 2015 to 2023's expected earnings.
Because I'm going to use EPS in order to estimate earnings, I also check for any share buybacks that occurred over this period, because those will inflate the EPS growth rate by lowering the share count. (A rising share count, however, will already be incorporated in the EPS figure, so I won't make adjustments if the share count has risen.)
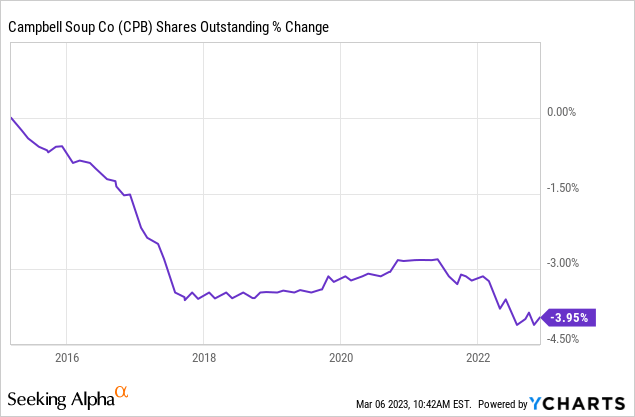
Campbell has bought back about 4% of the shares outstanding since 2015. I will make a small adjustment for those when I estimate earnings growth.
FAST Graphs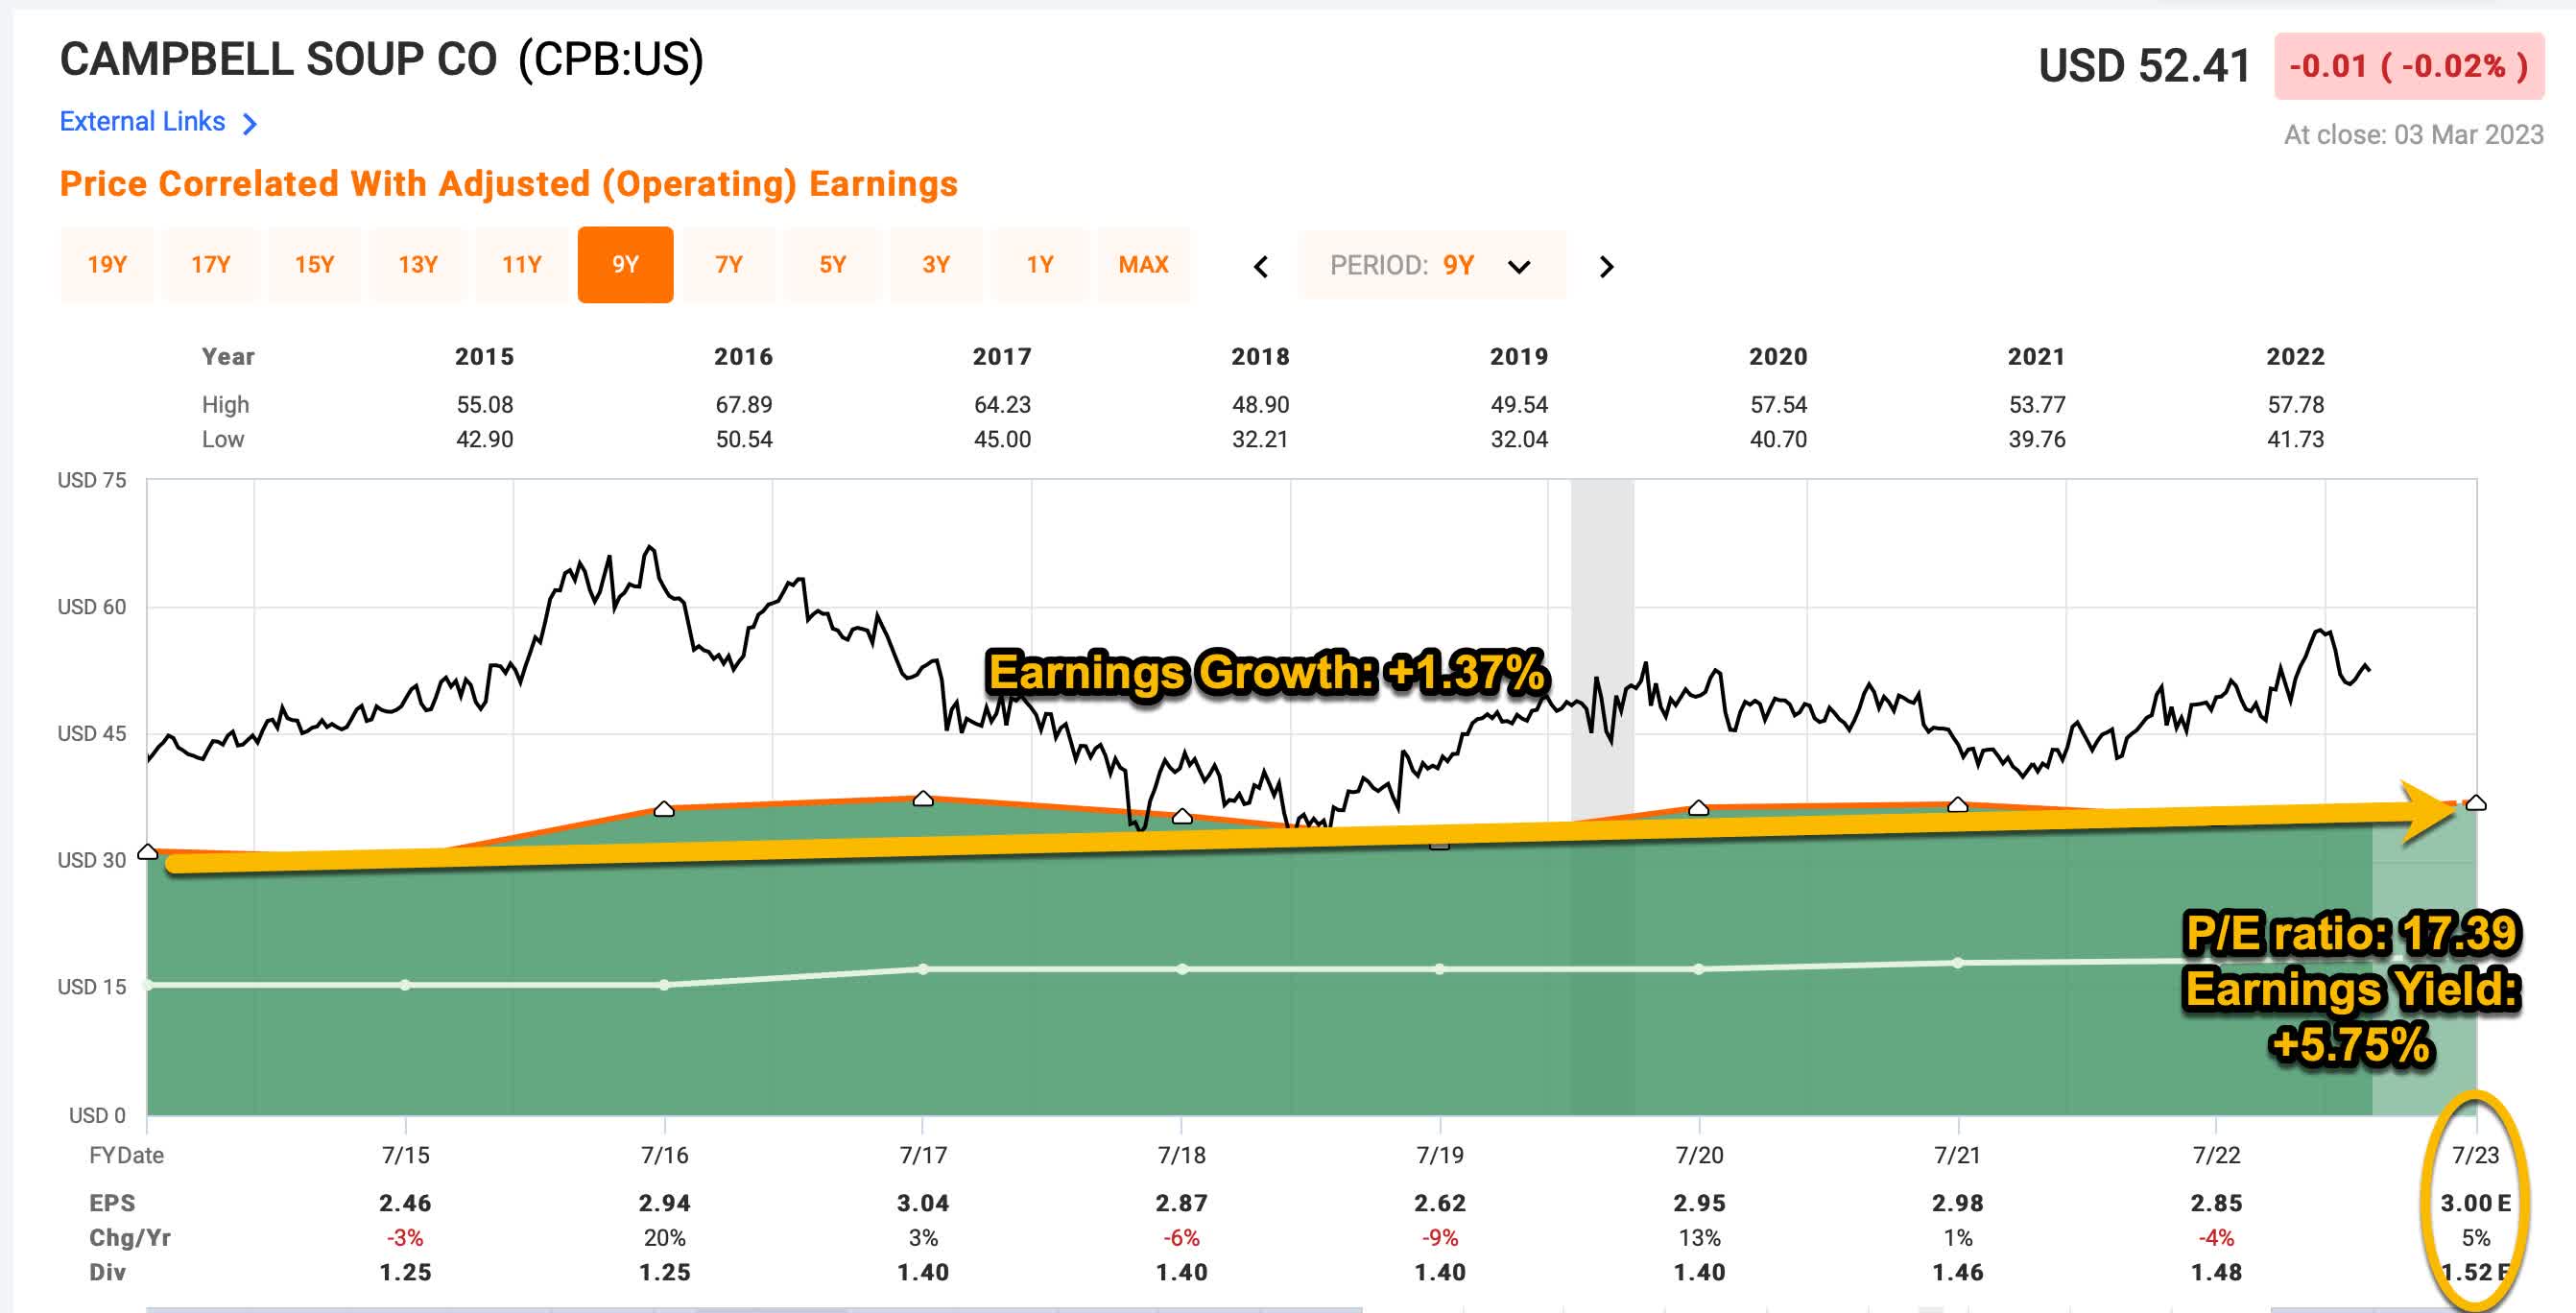
Above, I have another FAST Graph from the time period 2015 through 2023. I have annotated it with the data I will use for my 10-year collected earnings projections. Note that I am pulling forward 2023's expected EPS rate of $3.00 per share, which, at the current price translates to a P/E ratio of about 17.39, an earnings yield of +5.75%. The earnings growth rate from 2015 through 2023, has been about +1.37% if we take into account the negative growth years and the buybacks they've made. (This is only slightly more conservative than FAST Graph's calculation of +1.91% EPS growth which does not account for those things.)
The way I think about this is, if I bought CPB's whole business for $100, it would earn $5.83 the first year ($5.75 plus 1.37% growth), and that $5.83 would grow at a rate of +1.37% each year, for 10 years total.
Below is a table that shows the expected cumulative collected earnings on $100 over 10 years.
| Year | Earnings for Year | Cumulative Earnings |
1 | $5.83 | $5.83 |
| 2 | $5.91 | $11.74 |
| 3 | $5.99 | $17.72 |
| 4 | $6.07 | $23.80 |
| 5 | $6.15 | $29.95 |
| 6 | $6.24 | $36.19 |
| 7 | $6.32 | $42.51 |
| 8 | $6.41 | $48.92 |
| 9 | $6.50 | $55.42 |
| 10 | $6.59 | $62.01 |
| Total | $62.01 | $100 + $62.01 = $162.01 |
So, if you bought CPB at the current valuation for $100 and collected all the earnings for yourself you would have started with $100 and ended 10 years later with $162.01. This is a compound annual growth rate of about +4.94%.
Next, what I will do is take that long-term average earnings CAGR of +4.94% and figure out what that works out to after four years' time, since our goal is to estimate the returns over that time period. When I do that, it works out to a basic total return of +21.29%. So, over the next four years, if we disregard market sentiment and assume it stays the same, treating CPB more like a private business, we could expect our total return in collected earnings after four years to be valued at about +21.29% if we assume the earnings trend will continue for 10-years total.
This return is the absolute return expectation if we assume that market sentiment for the stock is similar to what it is right now. But I think it's also worth comparing this expected 4-year total return to alternative investments. The two alternatives I will compare it to are the SPDR S&P 500 Trust ETF and the iShares Treasury Floating Rate Bond ETF (TFLO), which is what I'm currently using as my cash equivalent for investment money. The reason we compare to alternatives is to see if there are better simple alternatives that don't require a lot of skill to analyze, which basically anyone could own instead of the individual stock.
Using a similar method that I used with CPB's earnings, I also track about half of the S&P 500 (SP500) stocks using this method, which represents about 2/3rds of the S&P 500 weighting. If I use that group of stocks to estimate their 4-year expected returns, I get an absolute expected total return for the index of about +27.48%. And, I generally expect TFLO, or short-term treasuries, to yield about 4% per year over this time, or to produce a 17.00% total return in four years. Let's see what sort of return CPB is likely to produce compared to these alternatives given these estimates.
| 4-Year No Mean Reversion | 4-year total return expectation | 4-year return expectation minus SPY's +27.48% | 4-year return expectation minus TFLO +17.00% |
| CPB | +21.29% | -6.19% | +4.29% |
Overall, if sentiment remains the same for CPB and the wider market, CPB should be expected to return similar returns as the wider market (21.29% vs. +27.48%).
It's always good to start with steady sentiment as a base for a valuation, but I've found that over the longer-term (and four years is starting to get into the "longer-term") stock earnings valuations tend to revert toward a mean of about a +7.00% 10-year earnings CAGR. (For a stock with the same earnings growth expectations as CPB of +1.37%, we would expect an average P/E ratio of about 11.15 to be the "normal" P/E the market would be likely to pay.)
In order for CPB's expected +4.94% 10-year CAGR expectation to get up to a 7.00% 10-year CAGR and the P/E down to 11.15, the stock price needs to come down because the price one pays for a stock has an inverse relationship to future returns. So, next, I will examine what would happen to the stock price if the P/E reverted from its current 17.39 level, to a much lower 11.15 level over the course of four years.
| With a Generic 7% 10-year Mean Reversion Assumption | 4-year total return expectation | 4-year return expectation minus SPY's +13.62% | 4-year return expectation minus TFLO's +17.00% |
| CPB | -14.03% | -27.65% | -31.03% |
Okay, this is where things get interesting. For comparison, if the S&P 500 index were to revert to a 7.00% CAGR expectation over four years it would produce a +13.62% total return based on my estimates. TFLO's returns would be expected to remain about the same as before with a +17% return. If CPB's business earnings produce an average return valuation by the market, it is likely to return about -14.03% over the next four years on a total return basis. This is -27.65% (or -2,765 basis points) of difference between the S&P 500's +13.62% expected 4-year return. That is a very big difference in expected returns. Additionally, the relative returns compared to TFLO are even worse, with a -31.03% (or -3,103 basis point) spread.
This implies that over the medium term on a relative basis, CPB is probably likely significantly overvalued compared to the S&P 500 and even more overvalued compared to the likely returns from a cash equivalent, if market sentiment reverts to something close to its historical mean at some point during the next four years.
Ratings & Explanations
Assuming my estimates are reasonably close, there are several ways to interpret these results. The things we don't know, even if the earnings return estimates end up being fairly accurate, are what sort of mood the market will be in and how the wider economic conditions might influence the returns in four years. If we are in a deep recession at that particular time, then we would naturally expect the earnings to be lower, while if we are in some sort of economic boom, we would expect them to be higher. So, using relative returns is a way to somewhat control for macroeconomics. If we are in a recession, then it's likely SPY will perform poorly as well, so the difference between those returns is what we care about if we want to control for macro conditions.
Using mean reversion, on the other hand, helps to account for how people feel about certain stocks at certain times and what sort of returns investors are willing to accept. In this case, CPB and SPY have a significant difference between the two of them, and SPY is expected to perform better.
Different investors might have different assumptions and expectations about sentiment and macro conditions will be, so that's why I also provided the expectation without assuming mean reversion first. That said, I do generally assume that after a period of four years, the chances are good that mean reversion will take place for most stocks, so, personally, I care about the mean reversion estimates the most. Additionally, I aim for a 4-year mean reversion expected return that is about 75% before I buy a stock based on earnings valuations. If I write about a stock (and earnings are not expected to drop because of a near-term recession) and it has a 75% 4-year return expectation, I will buy it, and those stocks will earn a "Strong Buy" rating from me.
Because I know I'm aiming for higher returns than many other market participants, I will rate stocks a "Buy" if the 4-year mean reversion total returns are 25% (2,500 basis points) higher than both SPY and TFLO, because these will likely be above market average returns and above cash average returns.
If the 4-year mean reversion returns are within 25% (+/- 2,500 basis points) of SPY, then I would consider that stock a "Hold." I don't consider any of my estimates superbly precise. They are meant to work as a rough guide, where we can take action if they reach extremes. So, within this range, I don't have a strong opinion about the stock one way or the other.
If the 4-year mean reversion returns are likely to underperform SPY or TFLO, i.e., cash, by -25% (-2,500 basis points) or more, then that stock would get a "Sell" rating from me.
And, finally, if a stock is likely to underperform both SPY and TFLO by more than -25% or (-2,500 basis points) over the course of four years then the stock would be a "Strong Sell."
I use -25% as the threshold because it's enough of a difference that a person could sell a stock, pay a full 20% long-term capital gains tax on the sale, and still come out ahead. If a person is dealing with a bigger tax bill than 20%, then they should do the math and figure out what that level is and use that as a guide for their selling threshold.
At today's price, Campbell Soup stock is expected to perform significantly worse than both the S&P 500 and US treasuries if the market sentiment gets closer to its historical mean. Because it is expected to underperform both alternatives by more than -2,500 basis points, I am rating this stock a "Strong Sell", as per my guidelines.
Conclusion
There are a lot of retirees, in particular, right now who are attracted to historically well-known brand-name companies that have a long history of paying dividends like Campbell Soup. Stocks like these can feel safe. And, if we measure "safe" in terms of avoiding gigantic losses, then it might be true that stocks like this are not likely to experience a quick and deep collapse. But the same can be said of short-term treasuries right now, which yield between 4.5% and 5%. Campbell Soup yields about +2.81%. Over the next four years, which is the focus of this article, Campbell's dividend would need to grow over 20% per year to produce the same returns as cash. So, for me, this is a pretty easy call for investors seeking to limit risk and maximize income, which is who I presume most investors who own this stock are. And with such a slow earnings growth rate, I would likely avoid this stock even if the valuation was much cheaper, simply because the earnings growth shows no sign of being able to keep up with inflation, which is the core metric I use to judge whether a business is high-enough quality for me to own.
In the end, I think this is a pretty easy sell for investors.
If you have found my strategies interesting, useful, or profitable, consider supporting my continued research by joining the Cyclical Investor's Club. It's only $30/month, and it's where I share my latest research and exclusive small-and-midcap ideas. Two-week trials are free.
This article was written by

My analysis focuses on the cyclical nature of individual companies and of markets in general. I've developed a unique approach to estimating the fair value of cyclical stocks, and that approach allows me to more accurately buy near the bottom of the cycle.
My academic background is in political science and I hold a Bachelor's Degree and a Master's Degree in political theory from Iowa State University. I was awarded a Graduate Research Excellence Award in 2015 for my research on conservatism.
Disclosure: I/we have a beneficial long position in the shares of TFLO either through stock ownership, options, or other derivatives. I wrote this article myself, and it expresses my own opinions. I am not receiving compensation for it (other than from Seeking Alpha). I have no business relationship with any company whose stock is mentioned in this article.