Wayfair: Why Its Future Could Be Bleak

Summary
- Post-pandemic, Wayfair is faced with declining active customer base and deteriorating revenues.
- Meanwhile, its lack of financial discipline is evident in its spending on customer acquisition.
- A comprehensive turnaround plan is proposed, which can unlock hidden value in Wayfair. An unwavering leadership commitment and overcoming short-term liquidity crunch are needed for its success.
jetcityimage
In the first section, I cover Wayfair’s (NYSE:W) current business model, and value them as I see their state of affairs continuing forward. Viewing from this lens, I find Wayfair to be worth about $10/share, much lower than the current price of $39. In the subsequent section, I expound on what a turnaround at Wayfair should look like and what the valuation could be should such a scenario were to unfold.
Wayfair Business Model
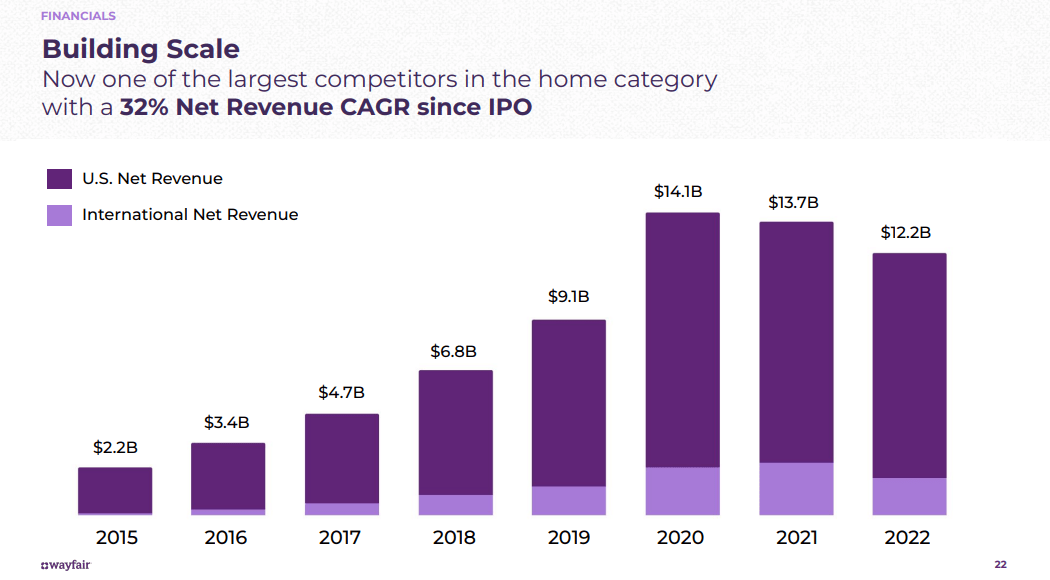
Wayfair is an online retailer for all things “Home”. The company was founded in 2011 (after operating specialty online stores for ~10 years) and went public in 2014. Its primary market remains the US, accounting for ~85% of its net revenues but Wayfair is expanding internationally. It has presence in Canada, UK, and Germany. It just launched in Ireland and is planning to enter Austria next. Recently, Wayfair also started dabbling into physical retail as well as B2B services.
Wayfair Q4 2022 Earnings Presentation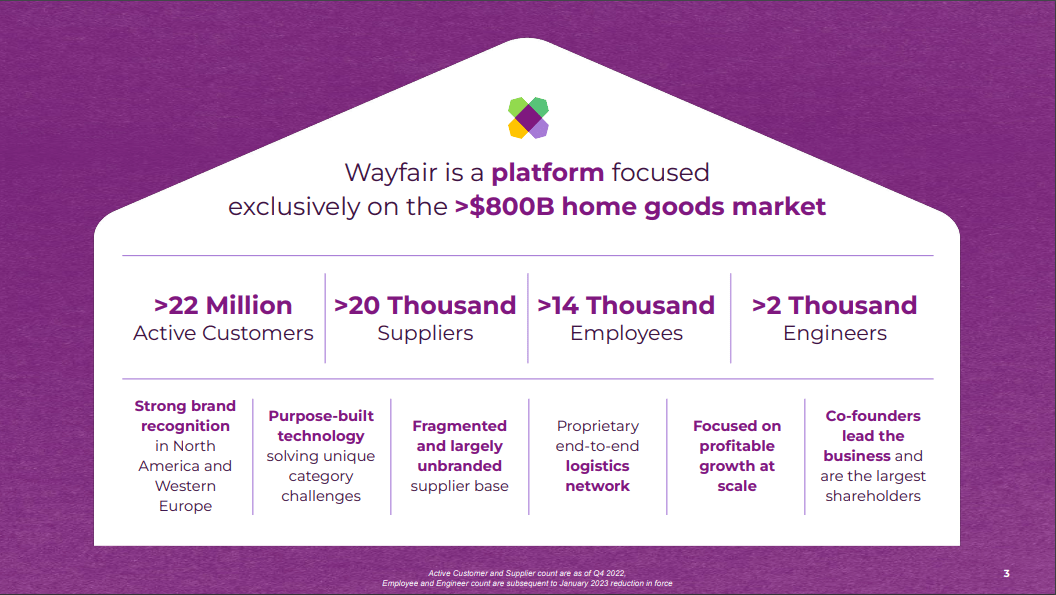
Wayfair primarily operates under 5 brands. It has started to sell under its own exclusive brands as well.
Wayfair Brands (Wayfair Q4 2022 Earnings Presentation)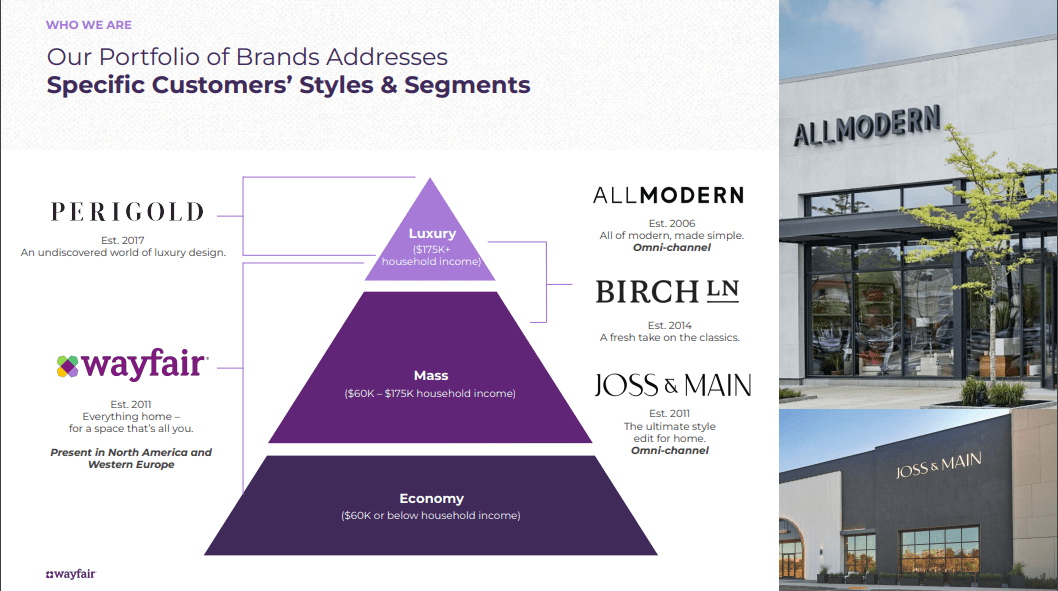
Wayfair boasts of over 22 million active customers, though this number has reduced from 27 million just a year ago, and 31 million in Q4 of 2020. Both its active customers and the order/customer have retreated to their pre-pandemic trajectory. Similar trend is apparent in their net revenues as well.
Customer metrics (Author's analysis based on 10-K reports) Wayfair Q4 2022 Earnings Presentation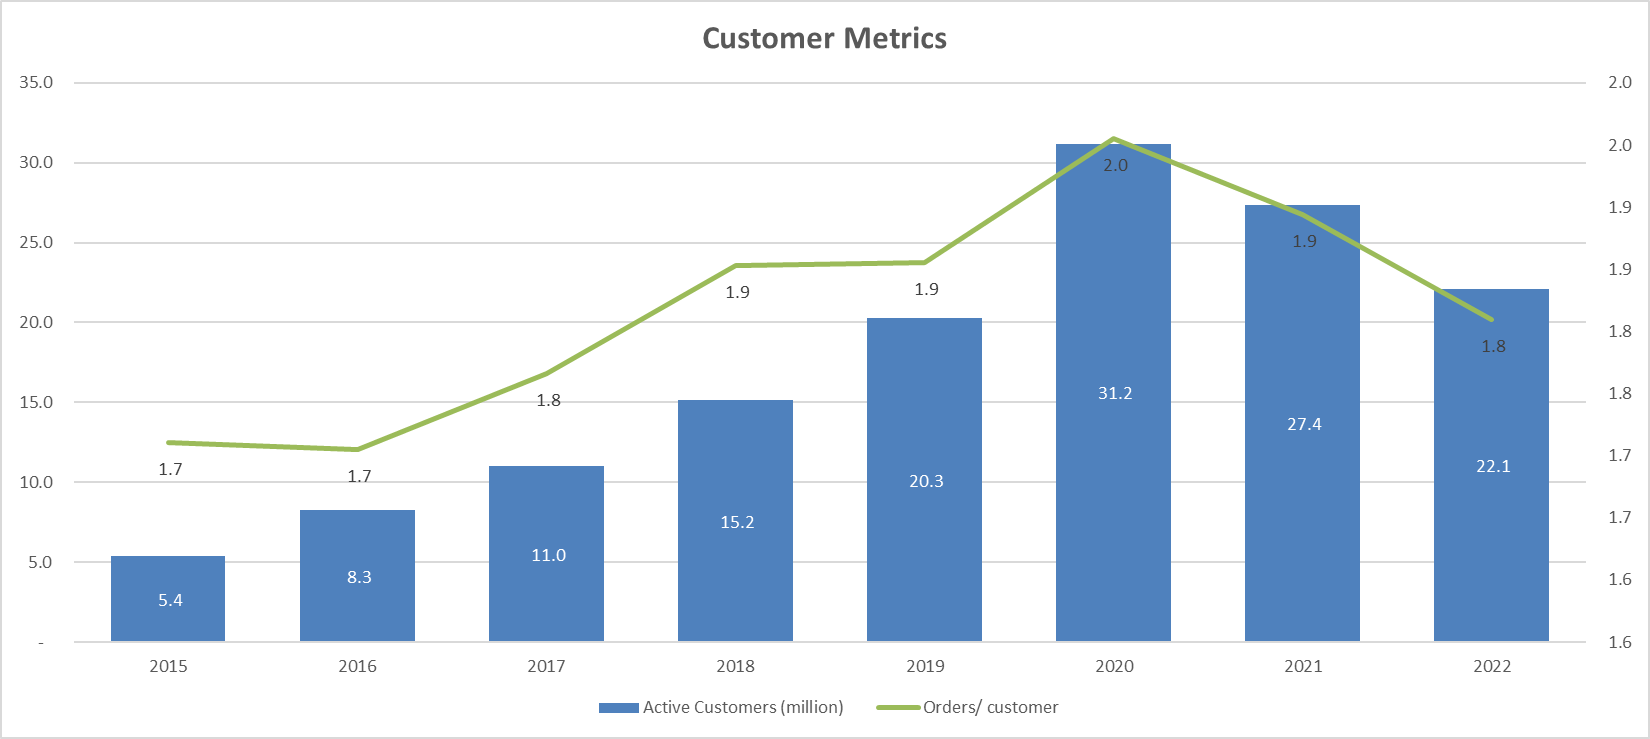
I think the Wayfair business model offers 3 key valuable differentiators:
- Technology solution – Wayfair sees itself as primarily a technology and data driven company, which happens to be selling home goods online. Perhaps, its technology prowess is most evident in the curation of the customer’s shopping experience on its website. Although this may not be entirely unique compared to other large online retailers like Amazon (AMZN), it does offer an experience which is leaps ahead of that offered by omni-channel retailers in the home space.
- Inventory light model – Wayfair operates on a consignment-based inventory model, wherein it only takes financial ownership of product once it is sold. Therefore, unlike other 1st party retailers who have to invest large amounts in buying inventory, Wayfair’s suppliers largely bear this cost. Hence, Wayfair’s working capital needs are minimized. In fact, inventory value on its books at the end of 2022 was only $90 million, or about 3 days of sales. This represents the inventory which has been sold and is in transit to the customer.
- Delivery network – Wayfair has its own end-to-end delivery network, spanning ocean freight, middle mile, and last mile network. Since Wayfair’s product profile (as it relates to shipping) has not changed materially, I would assume that their fulfillment network has been designed and optimized for such product type. In my view, the most alluring piece is their CastleGate Forwarding Service, which allows them to efficiently control ocean freight costs through product consolidation in the country of origin.
Growth at all costs
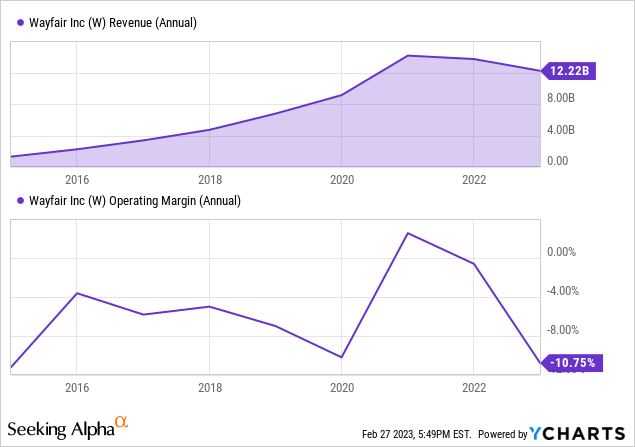
Wayfair has been the epitome of “growth at all costs”. This is evident from its rapid top line growth (CAGR of 27.3%) and the corresponding decline in operating margins from -3.6% to -11.3% over the last 8 years. Cumulatively, its operating expenses – customer service & merchant fees, advertising, and SOTG&A (selling, operations, technology, general, and administrative), have risen from 27.6% to 39.3% over the same period. The only year where it had positive operating margins was in 2020, driven by the pandemic induced spending spree. This spree continued in 2021 as well, enabling Wayfair to hit -0.7% in operating margins. Barring results from this unprecedented macroeconomic impetus, Wayfair has failed to generate positive EBIT margins in its entire 11+ years of history. Contrast this trajectory with that of Coupang (CPNG), the Korean e-commerce retail which incorporated around the same time as Wayfair. CPNG has demonstrated great financial discipline by growing its topline at a 50% CAGR while shrinking its operating losses from 26% to 3% over the last 5 years (see here for my valuation of Coupang).
Even more concerning is the relative apathy of Wayfair’s leadership to this alarming trend. They are yet to demonstrate their commitment to a concrete path to profitability via needle-moving time-bound actions. While leadership has referenced the below targets on several earnings calls, this slide was conspicuously missing from the Q4 2022 earnings presentation. Even when it has been presented in the past, it has been glossed over as long-term targets without a credible plan to achieve these.
Even more concerning is the apathy of the leadership to acknowledge alarming trend and demonstrate their commitment to the path to profitability via concrete, needle-moving actions. While management has referenced the below targets on several earnings calls, this slide was conspicuously missing from the Q4 2022 earnings presentation. Even when it has been presented in the past, these are presented as long-term target without a credible plan to achieve these.
Wayfair Q4 2021 Earnings Presentation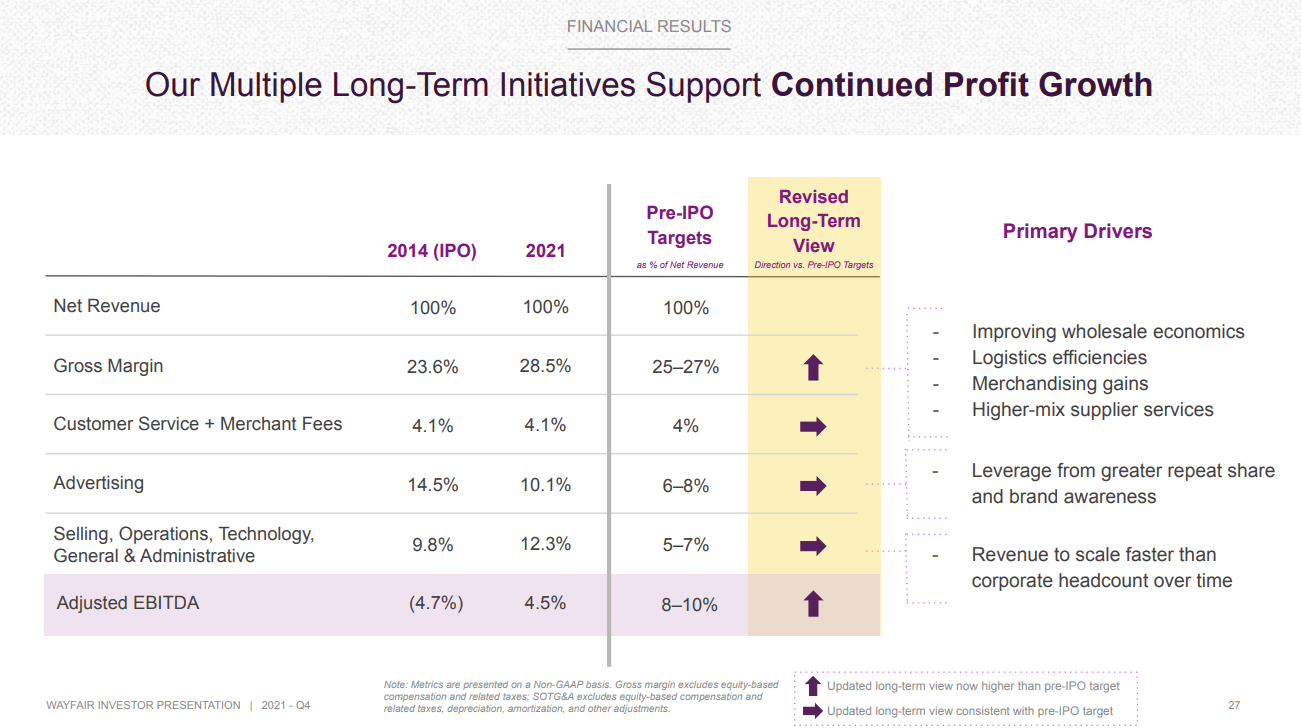
Recently, management has shared a cost reduction initiative to save $750 million in annualized costs. This is primarily being achieved via forced attrition of ~1,750 employees (completed in January 2023) and some reduction in technology costs. On top of this, management has also planned to save another ~$500 million annualized via operational cost savings initiatives. But, most of these savings, even if realized, would be passed on to the customer and are unlikely to impact Wayfair’s bottom-line.
Increasing cost of acquiring and retaining customers
A big drain on margins has been the ballooning advertising expenses, which have been around $1.4 billion for the last 3 years. Even as active customers have dropped from 31 million to 22 million over these 3 years, advertising expenses have barely budged. This means Wayfair is having to spend much more advertising dollars per customer to acquire new ones and retain existing ones.
Author's analysis based on 10-K reports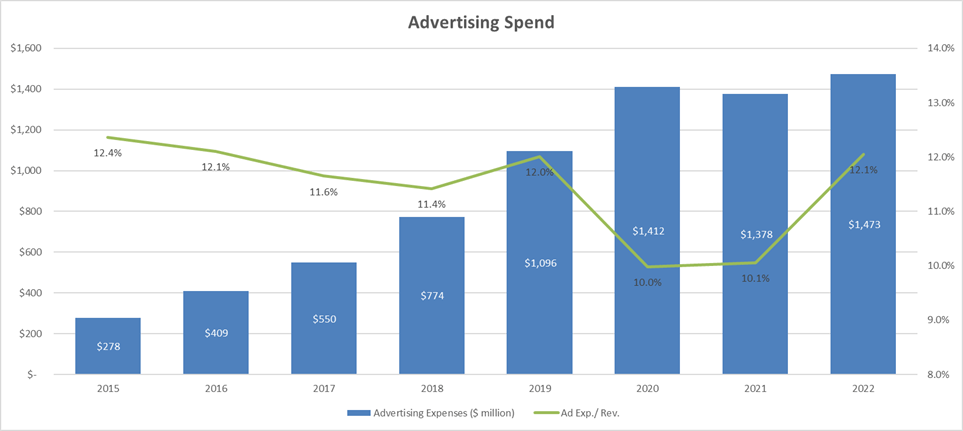
Wayfair’s leadership has been quite light-tipped about the efficacy of their advertising spend. In several earnings calls and financial releases, an adverse channel mix shift and the decrease in free traffic have been quoted as the reasons. However, to my knowledge, no deep dive on efficacy of this advertising spend has been shared publicly.
Deteriorating capital structure
Wayfair’s total debt (including operating leases) has grown to $4.15 billion in book value terms, which is almost equal to their market cap. Excluding operating leases, their debt has a book value of $3.26 billion but its market value is only $1.7 billion, which is trading at a large discount. Their debt levels have grown steadily since 2017. Wayfair’s current market debt-to-equity ratio of 63% is much higher the 19% average for online retailers.
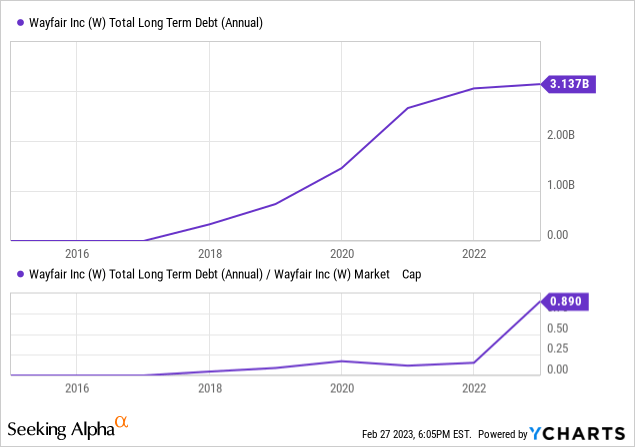
Market price of their outstanding notes suggests a pre-tax cost of debt for Wayfair to be around 12%. This market implied cost of debt suggests an 8% default spread, which is close to a B- rating on S&P (I could not find any official credit ratings for W). According to S&P, cumulative default rate for B rated bonds over the period of 1981-2021 has been 30.3%.
Market price of their outstanding notes suggests a pre-tax cost of debt for Wayfair to be around 12%. I could not find any official credit rating on Wayfair and their interest coverage ratio is negative. Going by the market driven cost of debt suggests an 8% default spread, which is close to a B- rating on S&P. According to S&P, cumulative default rate for B rated bonds over the period of 1981-2021 has been 30.3%.
Current prices of outstanding notes (FINRA)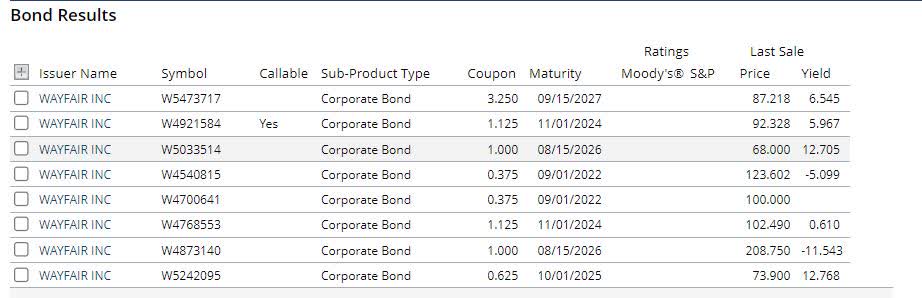
About half of Wayfair’s long-term debt (or $1.5 billion) is due by October 1, 2025. If prevailing interest rate environment and their capital structure does not materially change for the better by then, it would be become much more costly for Wayfair to raise debt, further increasing their interest liability.
A bleak future
My underlying assumptions about the future course of Wayfair are shaped by past actions of the leadership team, and the plans they have unveiled recently. To compute its intrinsic value, I focused on four key factors – revenue growth, margins, capital expenditure needs and cost of capital.
Revenue growth – I believe Wayfair will continue to grow its topline via 2 growth vectors – product line extension and geographical expansion. Wayfair estimates US home goods market size to be about $460 billion (with ~20% online share) and the Canadian and EU market size to be around $350 billion. Based on LTM revenues, this gives Wayfair a market share of 2.3% in the US and 0.5% in Canada + EU. I assume that the general market size would grow at a 3% annualized rate. I further assume that over the next 10 years, Wayfair will increase its market share in the US to 3.8% and 1% in Canada + EU. Over the next year, though, given the current macroeconomic headwinds, I expect Wayfair’s revenues to decline about 10%.
Operating Margins – In the last 3 years, Wayfair has shown a material improvement in gross margins. Management has also revised up its expectations on gross margins. Therefore, I assume gross margins to start at 28% (in line with 2022) and improve gradually to 29.5% over the next 10 years.
Customer service costs have largely remained steady pre-2022. I forecast these to remain steady at 4% of revenues. Advertising expenses are assumed to improve from 12% (2022 level) to 9% over the same period. This is higher than the 6-8% range provided by management. Given leadership’s lassitude and the stickiness of these expenses at Wayfair, I think it’s a prudent assumption. I expect SOTGA expenses to decline from 19% to 10% with economies of scale and other operational efficiency gains. Again, this is much higher than the 5-7% management target, which I do not foresee being achievable at this point. Given these assumptions, the operating margin is forecasted to improve from -7% in 2023 to 6.5% by 2032.
Capital investment requirements – Capital requirements for Wayfair stem primarily from investments in delivery infrastructure and technology. These have been fairly stable historically. Therefore, I assume the historic rates of 1.2% (of revenues) for net Capex and 0.5% (of revenue growth) for working capital, will carry forward.
Cost of capital – I use the derived credit rating of B- together with a risk-free rate of 4% and a country risk premium of 0.4%, to compute a pre-tax cost of debt of 11.8%. I assume that over time Wayfair will improve its debt structure and move 1 notch up on S&P rating scale. This would yield a pre-tax cost of debt of 8.9% by 2032.
For the cost of equity, I used the current implied equity premium of 5.55%, an unlevered beta of 1.26 for the industry, and the current debt-to-equity ratio of 63%. With these parameters, the cost of equity for W comes out to be 14.8%. This results in a WACC of 12.2% using market value weights for its debt and equity. Over the course of next 10 years, I assume it will decrease slowly to 11.5% as the cost of debt improves. Based on these assumptions, my discounted cash flow (DCF) valuation for Wayfair is shown below.
DCF Valuation Model ($ million)
Author's analysis
Results from the model yield an intrinsic value of $10.2 per share of Wayfair, which is much lower than the market price of $39.2 at market close on 3/6/23.
Simulation Results
Results from the DCF model are highly dependent on the key assumptions outlined earlier. Changing these assumptions and the associated storylines would results in materially different valuation results. Monte Carlo simulations were run on the DCF model with the following variables, with their values being picked from distributions shown below.
Input Variables for Simulation
Variable | Distribution | Baseline | Min | Max | Std. Dev. |
Initial US revenue growth rate | Normal | 20% | 3.8% | ||
Terminal operating margin | Normal | 6.5% | 2.3% | ||
Terminal return on capital | Triangular | 16% | 14% | 18% | |
Terminal WACC | Triangular | 11.5% | 9.5% | 12.2% |
A set of 10,000 random iterations were performed and the results from this simulation are shown in the figure below.
Frequency Plot of Intrinsic Valuation from Monte Carlo Simulation
Author's analysis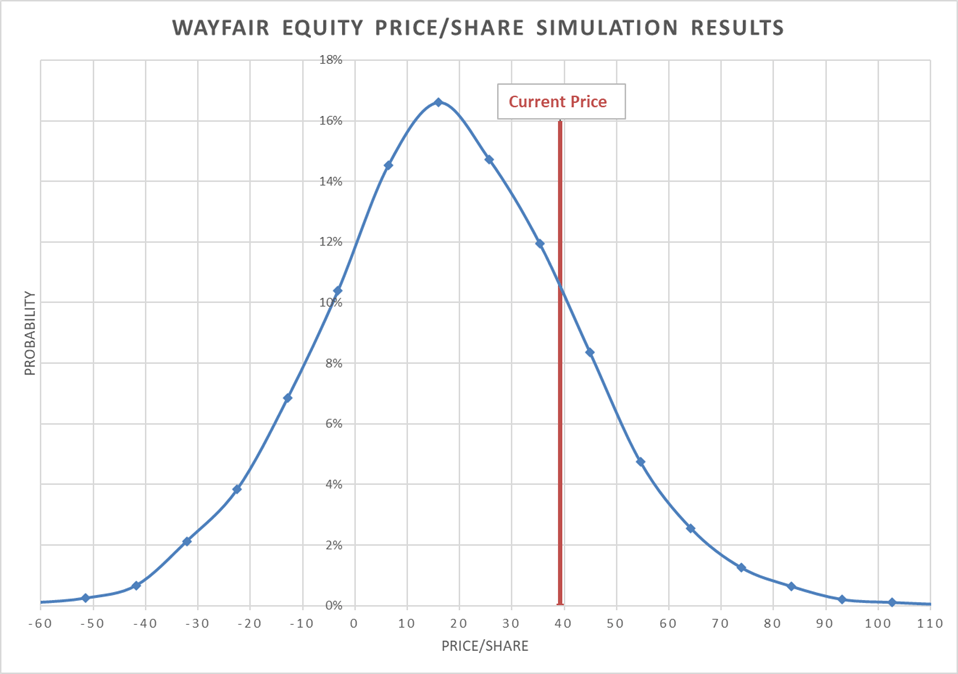
My range for intrinsic value lies from a 20th percentile of ($7) to an 80th percentile of $33. Current price for W of $39.2 at close on 3/6/23 falls around the 86th percentile of this distribution.
Notwithstanding the sharp decline in its share price in 2022 or more recently, after its Q4 earnings announcement, I find Wayfair to still be overpriced by a long shot. A lack of focus on profitability, and poor financial discipline make Wayfair a company to avoid. Consequently, I assign a “Sell” rating to it.
So, the big question is – is there a different future imaginable for Wayfair and can it get there?
Building Blocks of a Turnaround Plan
In this section, I expound on what a turnaround at Wayfair should look like and what its potential value could be if it were to execute such a turnaround successfully. Please bear in mind that this is my suggested plan, and is not coming from Wayfair. I have used publicly available information to take a deeper dive on Wayfair. I bring to bear my experience leading various operations and supply chain functions for prominent online retailers to suggest concrete actions.
My turnaround plan rests on addressing the core issues described above. There are 3 pillars to this plan – a different revenue growth trajectory and gross margin expansion, operating expense reduction, and improving capital structure. Fundamentally, Wayfair needs to transform itself into a smaller but more profitable entity with much reduced leverage. For the plan to succeed, it requires an unwavering leadership commitment from the top, a revamped corporate governance structure, and the ability to survive a short-term liquidity crunch. Let me expound on the building blocks of the plan below.
Revised Revenue Trajectory and Gross Margin Expansion
According to Wayfair’s own estimates, the addressable market size for it in the US is about $460 billion (with ~20% online share) while that of Canada + EU is around $350 billion. Besides US and Canada, Wayfair is already operational in UK, Ireland, and Germany, and is planning to launch in Austria next.
Exit international operations
Wayfair needs to wind down its international business (and ancillary bets like physical stores) and only concentrate on the US customer base. There are 4 reasons driving this recommendation. First, based on LTM revenues, Wayfair has only captured a small market share of 2.3% in the US. There leaves it with plenty of room to grow domestically. Secondly, while it seems to be spending heavily to expand internationally, its share of international revenues has essentially stalled since 2018. In fact, its 2018-2022 CAGR in both the segments is the same at 64%. In 2022, its international revenues declined 28.7% YOY (23.8% decline on a constant currency basis) compared to a 7% decline in the US revenues.
Author's analysis based on 10-K reports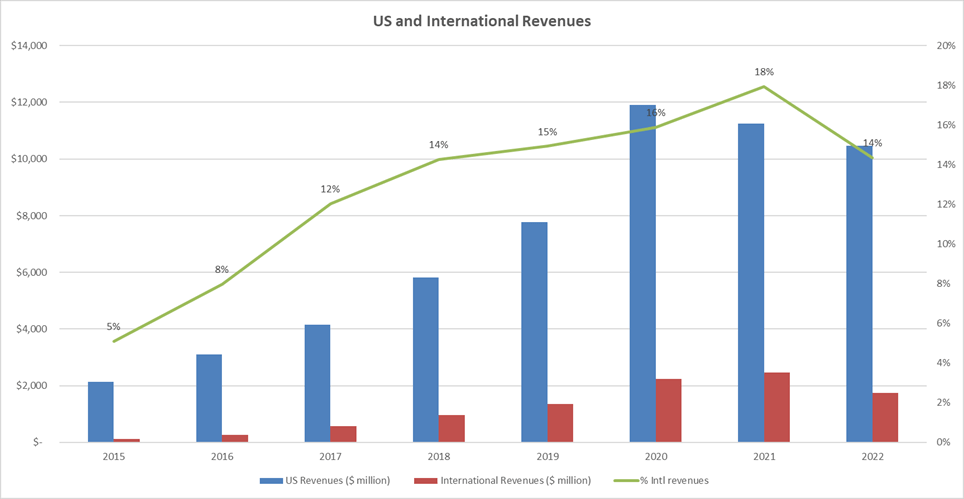
Furthermore, driven by the high cost of entering into & establishing new markets, Wayfair’s international EBITDA compares unfavorably to the US EBITDA. Even after 6 years since launching international operations, it has never achieved a positive EBITDA there, let alone positive net income. Its advertising expense and customer acquisition costs in these newer international geographies are likely to be much higher than in the US. Finally, its international operations seem to be consuming a disproportionately higher % of resources. For example, with 14.4% of revenues, international operations have 22% of long-lived assets, 17.6% of total assets and takes up 15.2% of logistics space. It now has corporate supply chain and technology teams both in US and Europe, resulting in some level of redundancy.
Author's analysis based on 10-K reports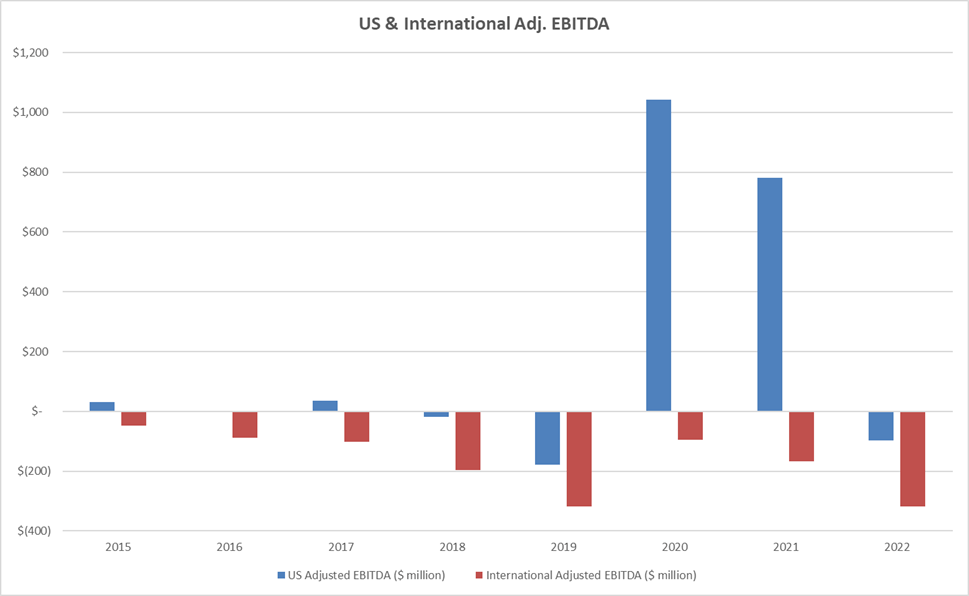
Wayfair does not segregate financial information at a country level in its public reporting. It also lumps Canada with EU in its international segment. Therefore, performance in Canada cannot be isolated with publicly available information. It may be possible the growth trajectory and economics in Canada align better with that of US rather than EU. If so, given the geographical proximity and the potential use of same supplier base in US and Canada, a case can be made to keep operating in Canada as well.
Curate a Compelling Private Label Offering
Home goods continues to be a fragmented market with a number of unbranded manufacturers. In fact, this is one of the verticals where customers are least likely to go after a particular brand. This presents a great opportunity for Wayfair to curate and grow a compelling private label offering. I would argue that Wayfair has way too many of its “exclusive” brands, which makes the shopping experience more confusing for the customer. Instead, what it needs is a singular and recognizable brand, around which it can build some customer loyalty. Several retailers have played this strategy well – Costco (COST) with its Kirkland brand, Amazon with its Amazon Basics & Amazon Essentials brands, are just two examples. Each of these brands clearly stands out in terms of recognition and their value offered. Wayfair should be well served by creating a similar experience in the home goods industry.
Besides enhancing brand recognition, the biggest advantage of growing this private label offering is the enhanced gross margins this yields. For similar priced industrial items, I have seen such private label offerings resulting in gross margins in the 45% to 50% range when similar branded products yield 20% to 30% gross margins. Even if one assumes a lower margin of 40%, it is still much higher than the current 28% - 29% gross margins that Wayfair generates.
Taming Operating Expenses
Wayfair’s operating expenses comprise customer service & merchant fees, advertising expenses, and SOTG&A expenses. Cumulatively, barring the pandemic induced dip in 2020 and 2021, operating expenses as a % of revenue have steadily increased over the years, reaching an alarming 39.3% in 2022. To survive and ultimately thrive, it is imperative that these expenses be brought under control.
Author's analysis based on 10-K reports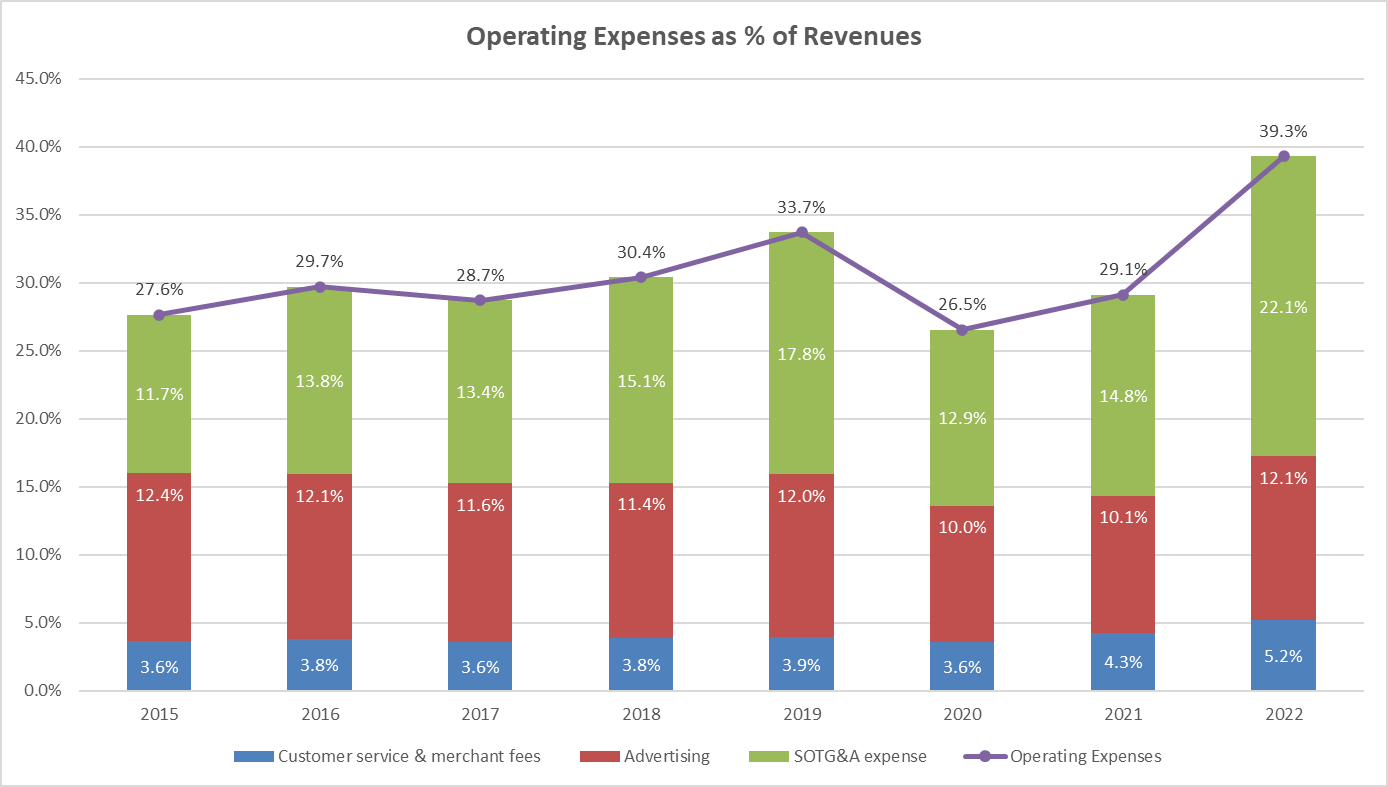
Offshore Customer Service
Currently, Wayfair operates its entire customer service team of about 4,200 out of the US. As a start-up trying to build a culture of excellence, it was prudent to keep this core function close at hand. However, with this culture largely established and the state of offshore customer service improving substantially, it is high time that this function be offshored.
There are several proven models to accomplish this - by establishing its own customer service presence in an offshore location, outsourcing to a 3rd party customer service provider with dedicated associates, or a 3rd party customer service provider with a shared associate pool. While the last option may not be best suited for Wayfair in terms of loss of control, neither of the first two options are compelling. According to Syrow, a 3rd party customer service provider out of India, the cost savings via outsourcing can be substantial (see table below). While the data may be a little biased coming out of a service provider, the general rationale of significant cost reductions still hold true. A degradation is customer experience is often cited as a risk to this approach. However, with the choice of the right model/partner and transition plan, this risk can be easily mitigated. In fact, several other ecommerce players, including Amazon, which is considered the benchmark for customer experience, have successfully moved almost their entire customer service teams offshore without any hit to their customer satisfaction. Wayfair should be able to transition at least 80% of the workload to an offshore location.
Region | Outsourced Call Center Pricing (per hour) |
The United States/Canada | $20–30 |
Western Europe | $40+ |
Eastern Europe | $12–25 |
Australia | $35–55 |
Africa/Middle East | $15–20 |
Latin America | $8–18 |
Asia/Philippines | $8–14 |
India | $6–10 |
I assume Wayfair has been working to optimize its channel mix in customer service. That is to say it is actively directing customer service traffic in the pecking order of least cost channels like self-service tools and chat bots, to eliminate or minimize the need for people led customer service.
Rationalize Opex Headcount
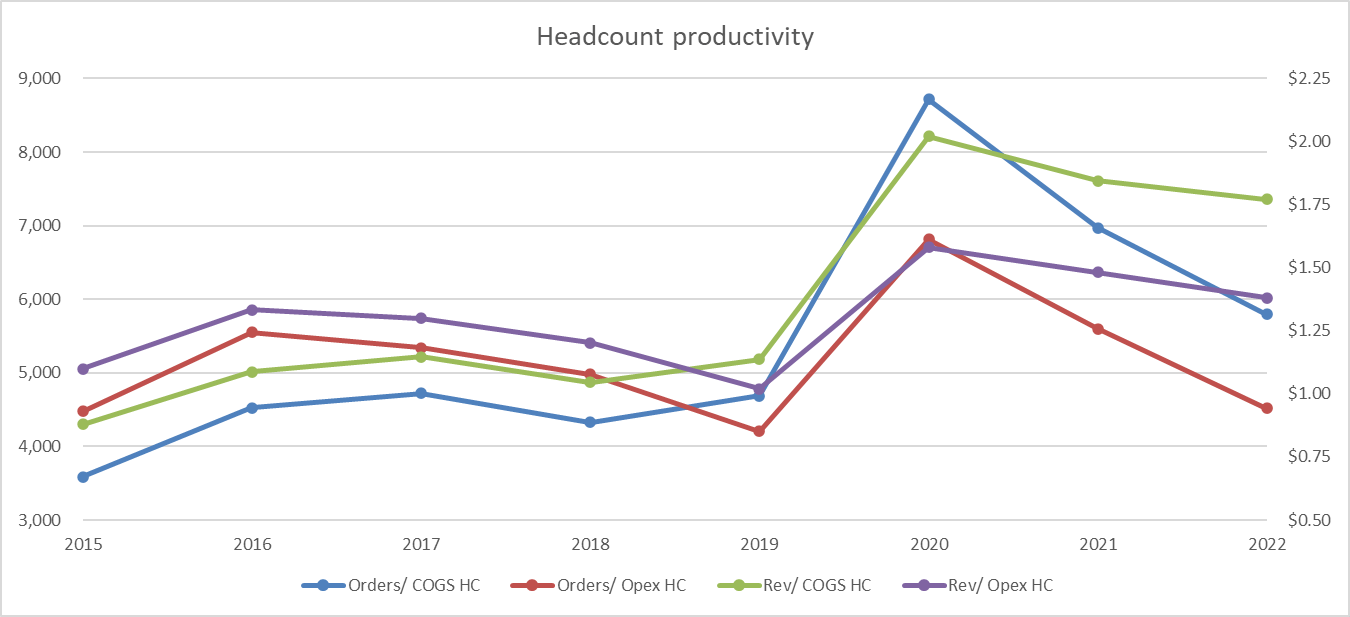
As Wayfair has scaled, it has seen a corresponding increase in the number of employees. As of December 31, 2022 (before the latest round of ~1,750 layoffs were announced), it had about 15,745 full time equivalent (FTE) employees. While the increase in revenues during 2020 resulted in an increase of labor productivity as measured by revenue/employee and orders/employee, this momentum has since reversed and by 2022, Wayfair has given up almost all of its efficiency gains. Clearly, this suggests there is lot of room to drive overall efficiency through headcount rationalization.
Author's analysis based on Earnings Presentations Author's analysis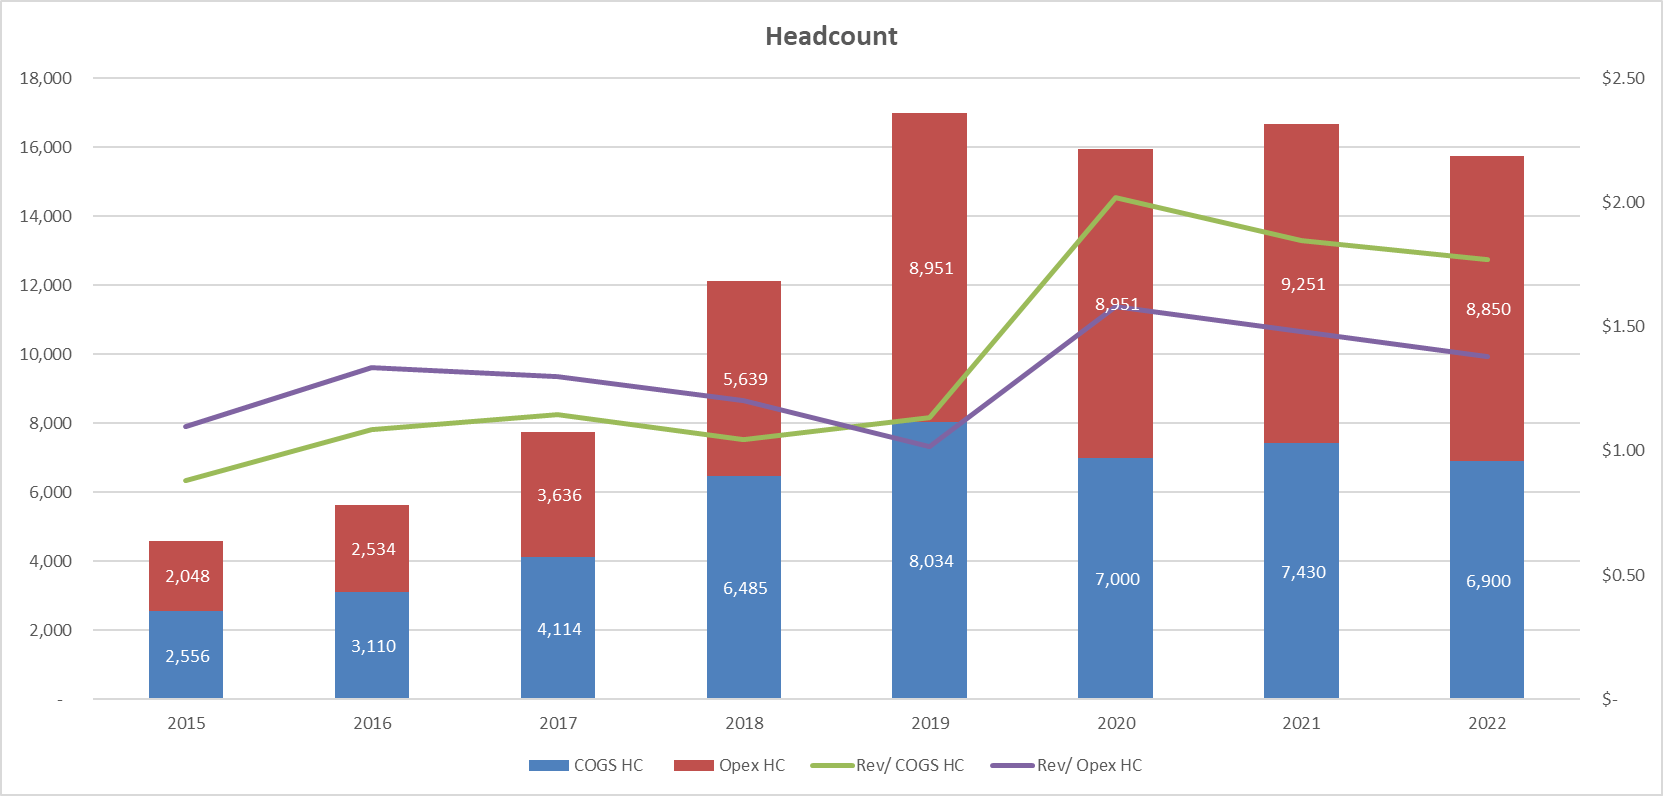
Opex headcount, which comprises marketing, engineering, and technology, is largely a fixed expense. Even if I assume a 10% improvement to in revenues/Opex HC compared to the demonstrated 2020 numbers, it translates into 20.6% or 1,821 headcount reduction overall using 2022 revenue numbers. Considering the reduced 2023 revenue numbers, the overstaffing comes to 2,452 FTEs or 31% of Opex headcount. Given about 1,200 of the layoffs announced in January 2023 were from corporate roles (assuming all of these came from Opex headcount), another reduction of 620 to 1,250 FTEs from the Opex headcount is required. Furthermore, a firm goal of at least 7% annualized improvement in labor efficiency needs to be set and met to ensure that the same headcount is able to keep pace with the revenue growth over the next 5 years (with some puts and takes). Assuming the actual headcount rationalization is midway between these numbers, a reduction of 26% of SOTG&A costs would be achieved.
Secondly, just like with customer service, there is an opportunity to offshore most of the technical team. Equivalent or higher technical talent is available in other countries at about a quarter of total compensation relative to the US. Furthermore, based on the country of offshoring, this usually comes with the advantage of effective use of all of the day’s hours, resulting in faster development times. Considering Wayfair may want to keep their technical teams in-house, it may be well served to open a satellite office location offshore to house the technical and customer service teams. Currently, Wayfair has about 2,500 engineers. Assuming 70% of these roles can be offshored at a quarter of the US cost, this would yield about 11% reduction in SOTG&A costs.
Through above reductions in US workforce through attrition and offshoring, the need for office space in the prime US HQ location would diminish. This extra space should be either sub-let or the original lease be restructured to vacate a portion of office space. I assume this would easily create over 1% reduction in SOTG&A expenses. Furthermore, the current stock-based compensation structure needs to be revamped by tying it to the achievement of critical business and departmental objectives. Finally, there would be ample opportunity to reduce costs in other operating expenses. These typically would include travel expenses (much reduced since all international travel would be eliminated), recruiting expenses (since no net headcount growth needs to occur), building overhead expenses, etc. Cumulatively, I reckon these actions may reduce SOTG&A expenses by ~9%.
All these actions combined would yield a reduction of ~47% in the SOTG&A line item. It is important to ensure that these expenses stay largely fixed over the course of next few years through consistent efficiency improvement efforts. This would translate into SOTG&A expenses trending towards 9.5% of revenues. Note that this is still substantially higher than the internal management long-term target of 5-7%.
Curtail Advertising Spending
There is not a lot of public information available regarding the efficacy of Wayfair’s spend across different channels. However, certain inferences can be drawn from what information is available. In 2019, Wayfair estimated its customer acquisition cost to be $54. Wayfair mentioned ~ 7% of the repeat retail revenue or $430 million was spent towards repeat customers. Active customers in 2019 were 20.3 million compared to 15.2 million in 2018. Per Wayfair, new customers added during 2019 was 12.2 million. This implies that $430 million was spent to retain 8.1 million (20.3-12.2) repeat customers, or a retention cost of $53 ($430/8.1) per repeat customer. One can also infer that Wayfair lost 7.1 million (15.2 + 12.2 – 20.3) customers during the year, resulting in an annual retention rate of just 53%. This means that Wayfair spent about the same to acquire a new customer as it did to retain an existing customer, and the average life of a customer is just over 2 years!
Extending the same reasoning and using the same assumption of 7% of repeat revenue being spent on repeat customers during each year, the following picture emerges. Customer acquisition costs have risen sharply to $92 while customer retention costs have held steady at around $50. Customer retention rates have dropped to below 50%.
Author's analysis based on 10-K reports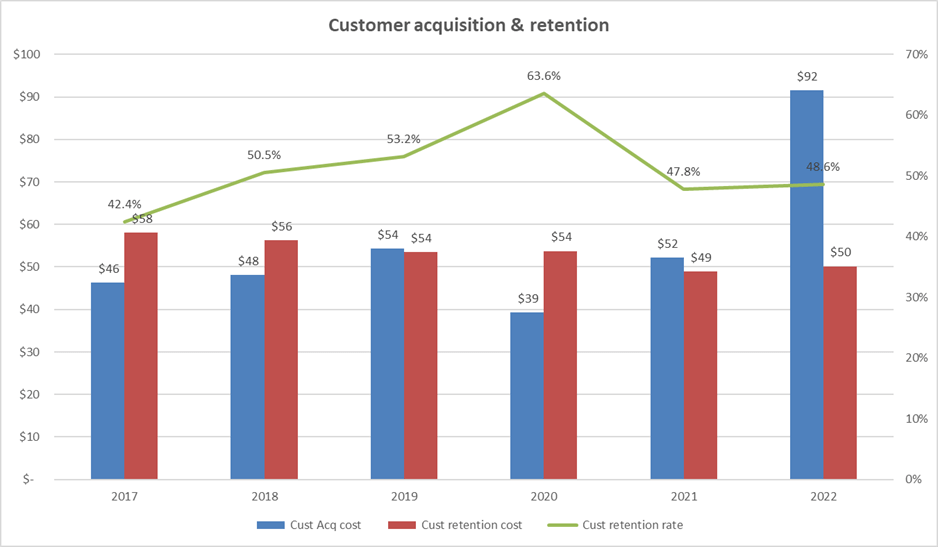
Furthermore, assuming new customers only order 1x during the year they are added (which may not be entirely accurate), the orders/repeat customer shows a large decline over the course of last 2 years. There is also a gradual decline apparent in revenue per repeat customer. These numbers paint a different picture than the management’s claims of strong customer loyalty.
Author's analysis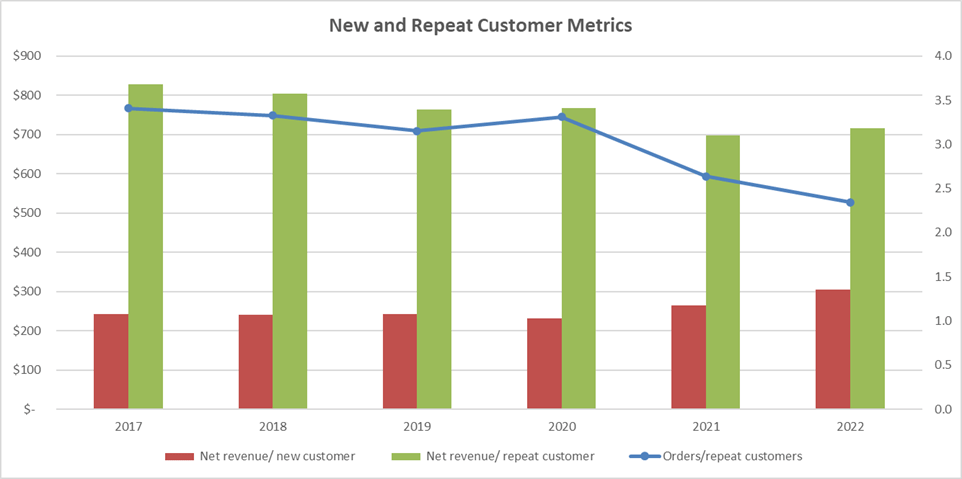
A deeper dive is needed to turn these insights into concrete, needle moving actions. A few things are clear though, and they provide a basic structure for the action plan. First, efforts need to be made to increase engagement, order volume and retention of existing customers. This can come in the form of a loyalty program or a reward structure aligned with total customer spending. Second, Wayfair needs to re-engage former customers, which may be done at a cheaper cost compared to acquiring brand new customers. Finally, by exiting international markets and other secondary ventures like physical stores, advertising spend can be curtailed. It is safe to assume the advertising spend/ international customer is much higher compared a US customer. Wayfair can minimize or eliminate any spending on brand recognition in the US. Finally, marketing teams must be held accountable to clear and timebound targets on each of these dimensions – customer acquisition cost, customer retention cost, retention rate and average spend/repeat customer.
I believe a 30% reduction in acquisition and retention costs per customer and a 20% improvement in customer retention rates are quite feasible. These results would mean advertising expenses reducing to ~8% of revenues, which is at the high end of long-term internal management target.
Create a more efficient capital structure
The current market value D/E ratio for Wayfair is 63%, resulting in a WACC of 12.2%. To test for the optimal capital structure (one that minimizes its WACC), I consider two approaches. One is to look at the industry average D/E ratio for global online retailers and furniture/ home furnishings industry segments. This number stands at 28.4%.
Second, I compute the WACC using various debt to capital ratios from 0% through 90% (D/E ratio of 0% through 900%). As D/E ratio increases, the cost of capital increases since the levered beta goes up. Cost of debt increases as well as the interest coverage ratio declines, resulting in a higher default spread. Based on this analysis, I get a range of 23% to 33%, where the cost of capital is minimized. This aligns well with the industry average computed above. The optimal WACC comes out to be 11.1%.
Author's analysis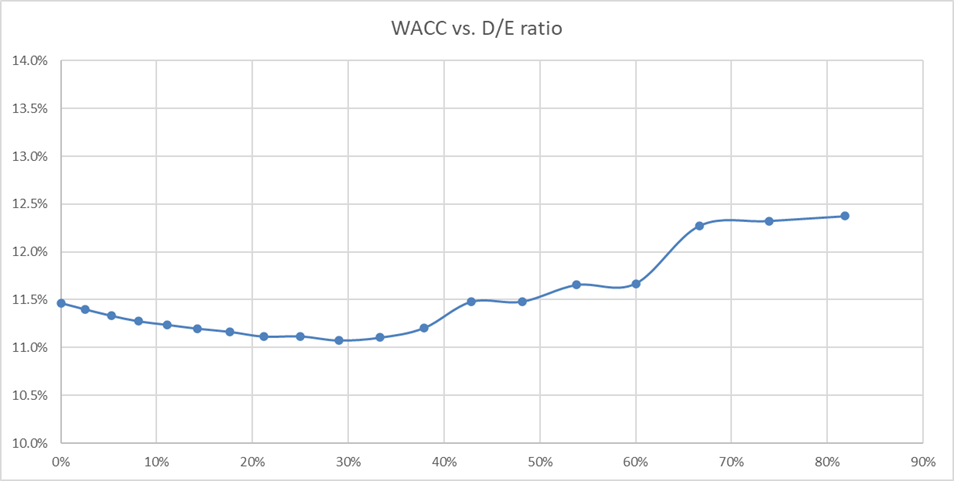
Therefore, it is clear that the current debt structure for Wayfair is sub-optimal. It needs to get towards a lower D/E ratio of around 30% to minimize its cost of capital and increase the firm value. In order to get to this ratio, Wayfair needs to extinguish about $1.67 billion worth of book value of debt from its balance sheet. About $1.5 billion of debt is coming due by the end of 2025. While not a great option, Wayfair will need to repay this debt with the limited cash balance it has and by raising fresh equity for the remainder. It is noteworthy that if the turnaround were to unfold as projected here, Wayfair should see a substantial free cash flow coming in starting 2025.
Updated valuation
In the turnaround version, I envision Wayfair as a smaller, nimbler player focused on the US market alone. I assume that the above turnaround plan can be executed in its entirety over a 2-year period beginning in 2024. Therefore, I assume a revenue CAGR of 3.2% over the next 5 years. All international businesses are assumed to shut down by 2024 with no net gains from liquidation (asset liquidations pays for the cost of exiting). Considering revenue growth for US alone, the CAGR comes to be 6.5%. Assuming a 20% mix of private label with a 40% gross margin, the terminal gross margins come to be 31.6%. Together with the reduction in operating expenses elaborated before, Wayfair’s operating margins improve from -7% to 11.6% by 2027. I assume for this increased private label penetration, Wayfair may have to transition to a 1st party model, where it buys this inventory. This increases its net working capital expenses to 12% of revenues. Furthermore, I added a one-time investment in inventory of $1.27 billion to make this transition. Finally, based on capital restructuring, its WACC is assumed to gradually decrease to 11.1% by 2027.
Based on these assumptions, the DCF valuation of Wayfair with the turnaround assumptions was re-run.
Turnaround DCF Valuation Model ($ million)
Author's analysis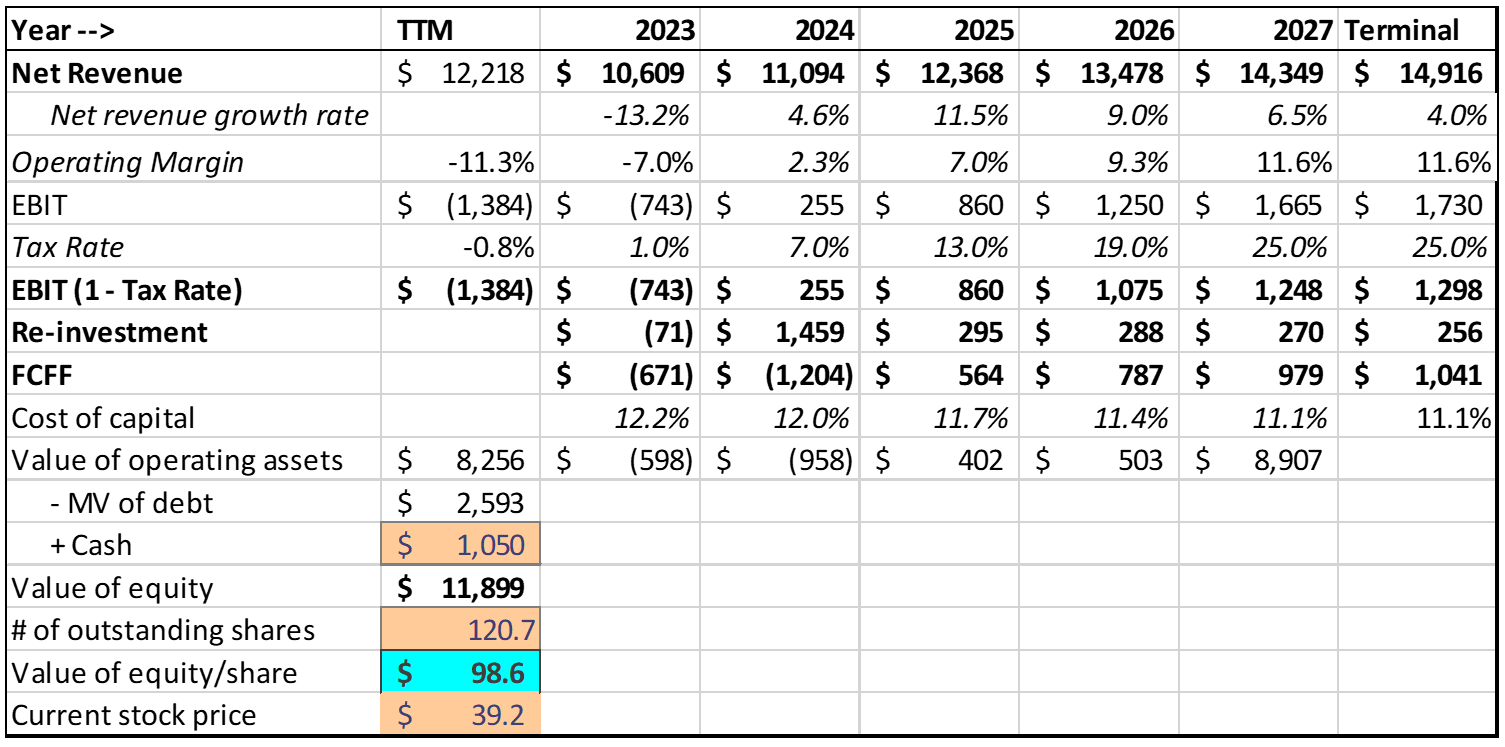
Results from the model yield an intrinsic value of $98.6 per share of Wayfair, which is almost a 10X increase from its current state value to $10.2.
Again, Monte Carlo simulations were run on the turnaround DCF model with the following variables, with their values being picked from distributions shown below.
Input Variables for Simulation
Variable | Distribution | Baseline | Min | Max | Std. Dev. |
Initial US revenue growth rate | Normal | 14% | 2% | ||
Terminal operating margin | Normal | 11.6% | 2.3% | ||
Terminal return on capital | Triangular | 20% | 16% | 24% |
A set of 10,000 random iterations were performed and the results from this simulation are shown in the figure below.
Frequency Plot of Intrinsic Valuation from Monte Carlo Simulation
Author's analysis
The range for intrinsic value lies from a 20th percentile of $83 to an 80th percentile of $114.
Risks
Besides the general macroeconomic risks resulting from a deterioration in new housing market, persistent inflation, or a rising unemployment rate, there are a couple of company-specific risks that need to be highlighted here. These pose a tangible threat to the success of any turnaround efforts at Wayfair.
Weak Corporate Governance Structure & Leadership Mismatch
Wayfair has a dual class share structure, with class B common shares having 10 votes compared to 1 for class A common shares. All of the class B shares are owned by the co-founders and their affiliates. By owning 23.6% of the total shares, the co-founders effectively control 76.1% of the voting rights. There are other provisions in their bylaws which deter any changes to this power structure (anti-takeover provisions) and prohibit stockholder action by written consent. Translation – unless an activist investor decides to fight the battle, common stockholders have little chance to force a change in leadership, the board, or the strategy the company adopts, including any turnaround plans.
Institutional Shareholder Services provides a governance score for companies. Scores range from 1 to 10, with 10 indicating highest governance risk. The current score provided for Wayfair is 8. The pillar scores are Audit: 5; Board: 5; Shareholder Rights: 10; Compensation: 7. Again, this highlights the limited rights of shareholders to enact change at the company.
Professor Aswath Damodaran of the Stern School of Business at NYU, makes a great case about how a company passes through different stages of maturity in its lifecycle and the difference in qualities needed in its CEO based on its lifecycle stage. Based on his divisions below, I see Wayfair as somewhere between a ‘High Growth’ to a ‘Mature growth’ phase. A successful CEO during these phases in an opportunistic, quick-acting individual who can scale the company to profitability. At the same time, he/she is the one who can make the next transition to defending existing markets and widening the moat to grow margins.
aswathdamodaran.blogspot.com/2021/12/managing-across-corporate-life-cycle.html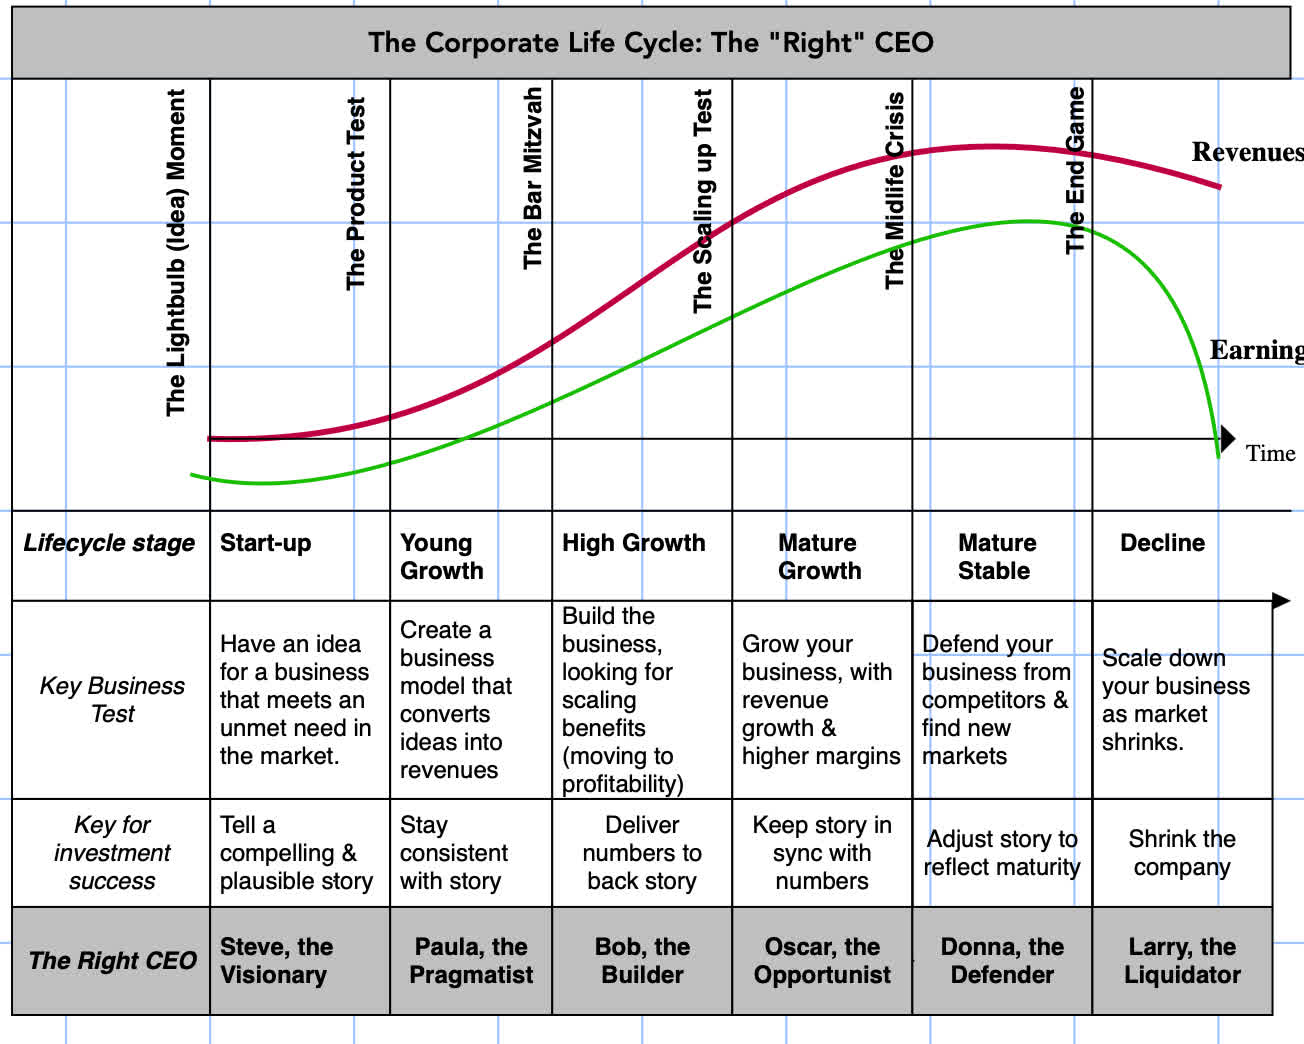
Further, Prof. Damodaran observes that the companies in the 21st century, especially tech companies, have seen a compression of the lifecycle. This means that the companies are transitioning much more quickly through the phases of their lifecycle.
aswathdamodaran.blogspot.com/2021/12/managing-across-corporate-life-cycle.html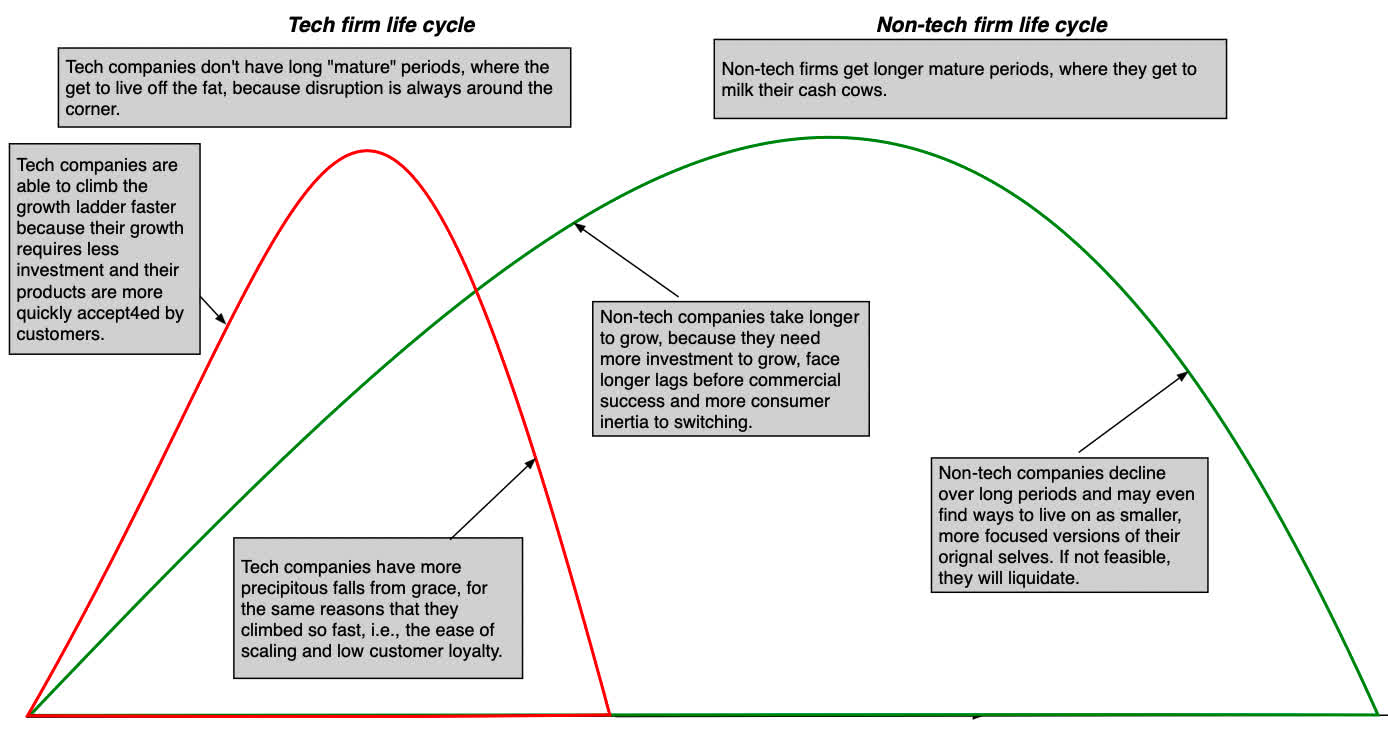
I recommend the following changes to strengthen the leadership structure and corporate governance at Wayfair. The first is to ensure that the qualities of the top leader are aligned well to the needs of the company based on where it is on the maturity curve. A self-assessment is needed here to ascertain whether the current founder CEO is apt to make this transition or whether the company is going to be better served by bringing on a new leader with these traits inherent. I suggest the latter.
The top executive team at Wayfair is largely comprised of former consultants. According to the leadership profiles on the executive team, 6 of the 14 had been consultants in their previous roles. Generally, consultants tend to view businesses from a strategic lens and are more adept at thinking through large changes. Based on the current maturity stage of the company, I would vouch for more “gritty”, tactical leaders, who are in tune with the ground realities and can execute plans. A sense of rigor and accountability are the needs of the hour at Wayfair.
Finally, I would recommend changing the board composition to make it more independent. There needs to be complete separation of the CEO role and the board chairperson role. I see only 2 directors (besides the co-founders) out of 9 to have any material stake in the company. Board members should be required to have a sizeable stake in the company to create alignment with the shareholders.
I see a change occurring here in only 2 ways – either the leadership and/or the board wakes to realize the urgency of the matter on their own, or an activist investor becomes engaged who forces the company to make these sweeping changes.
Liquidity Crunch
Currently, Wayfair has just over $1 billion in cash. My projections indicate a negative free cash flow of around $1.8 billion over next 2 years. Current cash only provides coverage for about a year. Wayfair does have a $600 million revolving credit facility to draw upon but it’s not a panacea. A significant portion of their debt comes due by 2025. Unless their free cash flow situation improves drastically in the short-term, Wayfair will need to raise additional capital within the next 2 years. Given their heighted costs of equity and debt, neither is particularly appealing. With the turnaround plan in place, Wayfair should see a substantial free cash flow coming in starting 2025 and its need to raise fresh equity are considerably diminished post 2025. Market conditions still have to be somewhat favorable for Wayfair to raise enough fresh equity to keep itself going. Though I won’t place Wayfair currently in the same distress bucket as Bed, Bath and Beyond (BBBY), it seems to be treading along the same path.
Conclusion
If Wayfair continues on the path as it has been treading, I see a bleak future ahead. Its intrinsic value is ~75% below what it is trading currently at. Further, it faces a toughening macroeconomic and liquidity environment ahead, which is going to test its very survival. If Wayfair can commit to and execute the turnaround plan expounded here, it should command a value close to 250% of its current market price. This requires an internalization of an urgent need for change by the leadership team, which can come either through introspection or being forced by an activist investor.
This article was written by

Disclosure: I/we have a beneficial long position in the shares of W, AMZN either through stock ownership, options, or other derivatives. I wrote this article myself, and it expresses my own opinions. I am not receiving compensation for it (other than from Seeking Alpha). I have no business relationship with any company whose stock is mentioned in this article.