SLV And PSLV: Emerging As Strong Buying Opportunities (Technical Analysis)

Summary
- The increase in Personal Consumption Expenditure (PCE) indicates an inflationary environment, which is favorable for silver investors.
- The recent decline in silver prices has returned the market to the favourable buying range of $19 to $20.
- The appearance of a bullish hammer at a long-term support coupled with other supports indicates a strong opportunity for investors to buy silver.
billnoll
The iShares Silver Trust (NYSEARCA:SLV) and the Sprott Physical Silver Trust (NYSEARCA:PSLV) are two silver market investment options available to long-term investors. These investment options are popular among investors due to high liquidity, low expense ratios, and potential for capital appreciation. SLV and PSLV provide exposure to silver bullion by holding physical silver in a secure vault that is regularly audited to ensure the holdings' integrity. Investors easily trade these instruments on major stock exchanges, which is good for trading in response to changing market conditions. The low expense ratios for both instruments help increase investors' savings and overall returns.
Inflation in the United States has reached a record high, and the Federal Reserve has raised interest rates above 4% to combat inflation. However, the increase in interest rates has no effect on inflation, and if the financial conditions in the United States loosen, it will further impact the economy. Personal Consumption Expenditure (PCE) increased by 0.62% in January, presenting an alarming situation. The inflationary environment is good for silver investors because the metal is used as a hedge against inflation since its value is usually maintained during periods of high inflation. Moreover, silver has a wide range of industrial applications. During periods of high inflation, the demand for industrial goods generally remains robust, thereby supporting the price of silver.
The silver price is correcting lower towards a strong long-term buying region between $19 and $20. Last week's bullish hammer formation at the long-term support region demonstrates the significance of the level. During a high-inflation environment, silver demand is expected to increase, and investors will most likely view price corrections as opportunities to accumulate long-term positions. This article will continue the previous discussion on the silver market in terms of PCE data, historical analysis, and technical analysis. The silver market is likely to bottom between $19 and $20, and SLV and PSLV appear to be attractive investment options for long-term investors to add silver to their investment portfolios.
Inflation Remains Elevated
PCE data is used to measure inflation in the United States, as shown in the chart below. PCE is a measurement of the goods and services purchased by American households. It represents the amount of money individuals spend on durable and nondurable goods, as well as services. PCE inflation increased to 5.38% for the 12 months to January, as shown in the chart below. The alarming figure is the monthly increase of PCE to 0.62% in January. The increase in PCE numbers indicates that inflation remains elevated despite the Federal Reserve's high interest rates.
Personal Consumption Expenditure (PCE) (fred.stlouisfed.org/)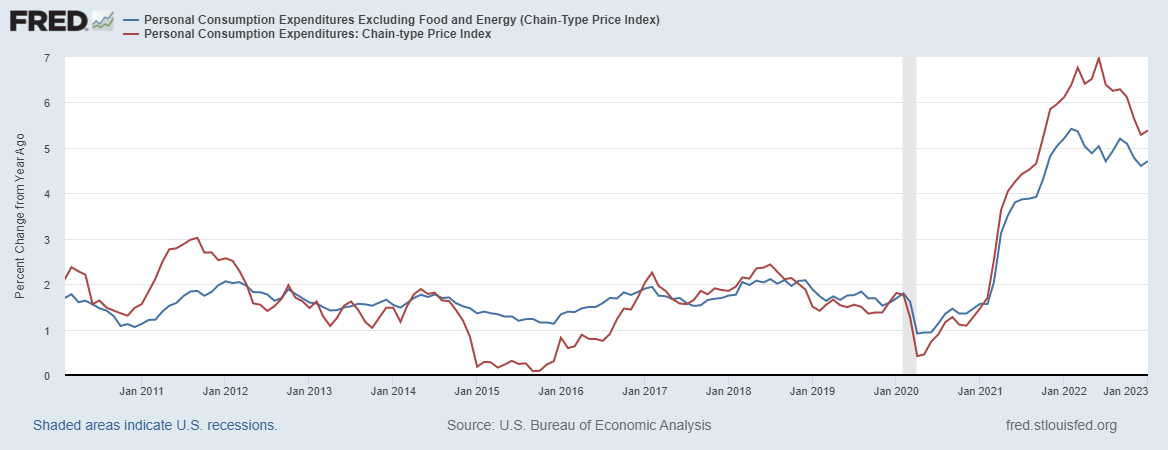
Moreover, the sticky price Consumer Price Index (CPI) is holding close to a monthly rate of 0.5%. The sticky price CPI measures the price changes of goods and services in the United States, which tend to fluctuate slowly over time. The sticky price CPI is a more accurate measure of an economy's underlying inflation rate than the headline CPI, which includes more volatile prices, such as food and energy. This is due to the fact that sticky prices tend to reflect the underlying cost pressures that businesses and other suppliers face, which can influence the pricing decisions over a longer time. The sticky price CPI remains at a high level, indicating further inflation in the United States economy.
Sticky Price Consumer Price Index (CPI) (fred.stlouisfed.org)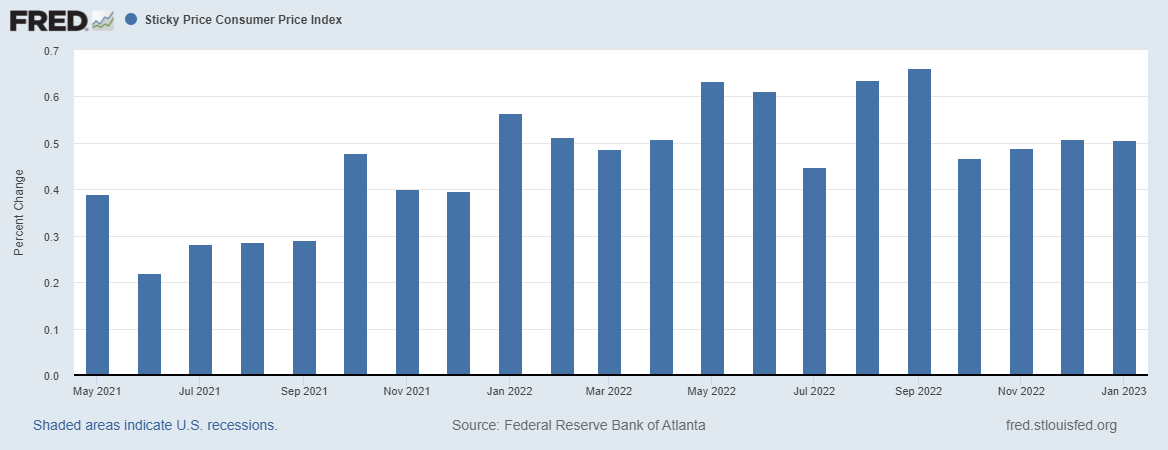
The above discussion on the PCE and CPI of sticky items indicates that the Fed has not yet controlled inflation. On the other hand, the Chicago Fed National Financial Condition Index (NFCI) is declining as shown in the chart below. The NFCI is a comprehensive measure of the financial condition in the United States that considers credit spreads, stock prices, and interest rates. The decline in the NFCI indicates that the financial conditions in the United States are loosening.
National Financial Conditions Index (NFCI) (fred.stlouisfed.org)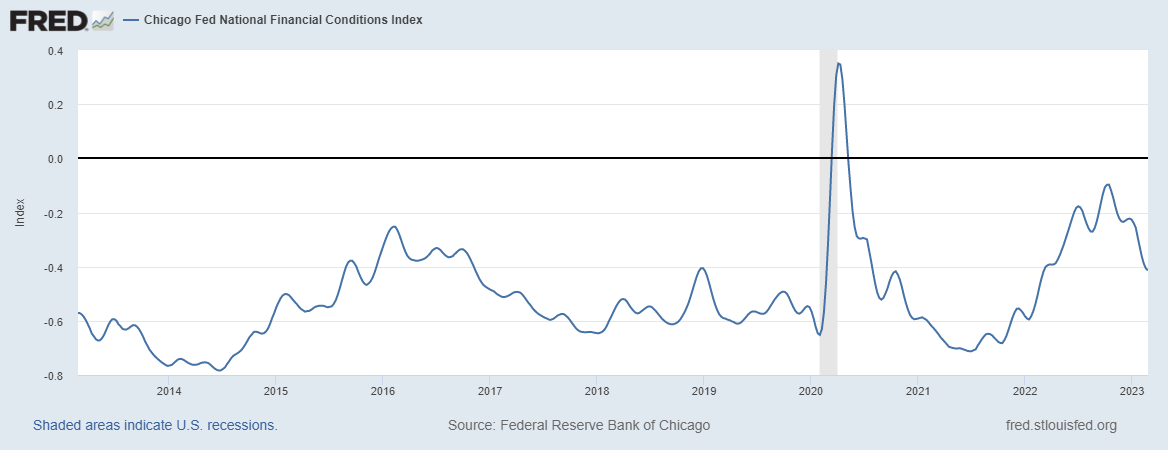
What is Next in Silver Market?
Previous Discussion
The previous article discussed a long-term overview of the silver market based on long-term chart data analysis. The silver market is developing strong bullish price patterns, as evidenced by the formation of cup and handle, and bull flag patterns. Since the spot silver market has never closed above $30-$32 on a yearly basis, traders view this trading range as a formidable market barrier. On the other hand, the silver market correction to between $19 and $20 is viewed as an excellent buying opportunity for silver market investors. Previously, it was anticipated that the spot silver market would begin a correction towards $19-$20, prompting investors to enter the market. The market has corrected back to the strong buying region as per expectations. The last week's correction to the low of $20.42 developed a strong rebound and closed the week at a higher level.
Current Situation
The chart below presents the emergence of bullish price action in the silver market. The historical patterns of inverted head and shoulder can be observed, with the March 2020 lows of $11.64 marking the head. The left shoulder of this pattern is marked by the lows of $16.57 in December 2019, while the right shoulder is marked by the lows of $17.02 in June 2020. After the breakout from the red neckline in July 2020, the bullish pattern was confirmed, and the price rose to the $30 region immediately. This pattern is identified as the foundational pattern for the upcoming rallies in the silver market. The price has been fluctuating in wide ranges below the $30 region and emerged another inverted head and shoulder pattern whereby the head of this pattern is marked by the triple bottom. The price has already dropped back to the red dotted support line and last week produced a bullish hammer which signifies price strength at current levels. The appearance of a bullish hammer at the red dotted line indicates a price increase from the support area. On the other hand, this red dotted line also fulfills the $19-$20 support level which has been discussed in the previous article, as the historical buying level for long-term investors.
Weekly Chart (stockcharts.com)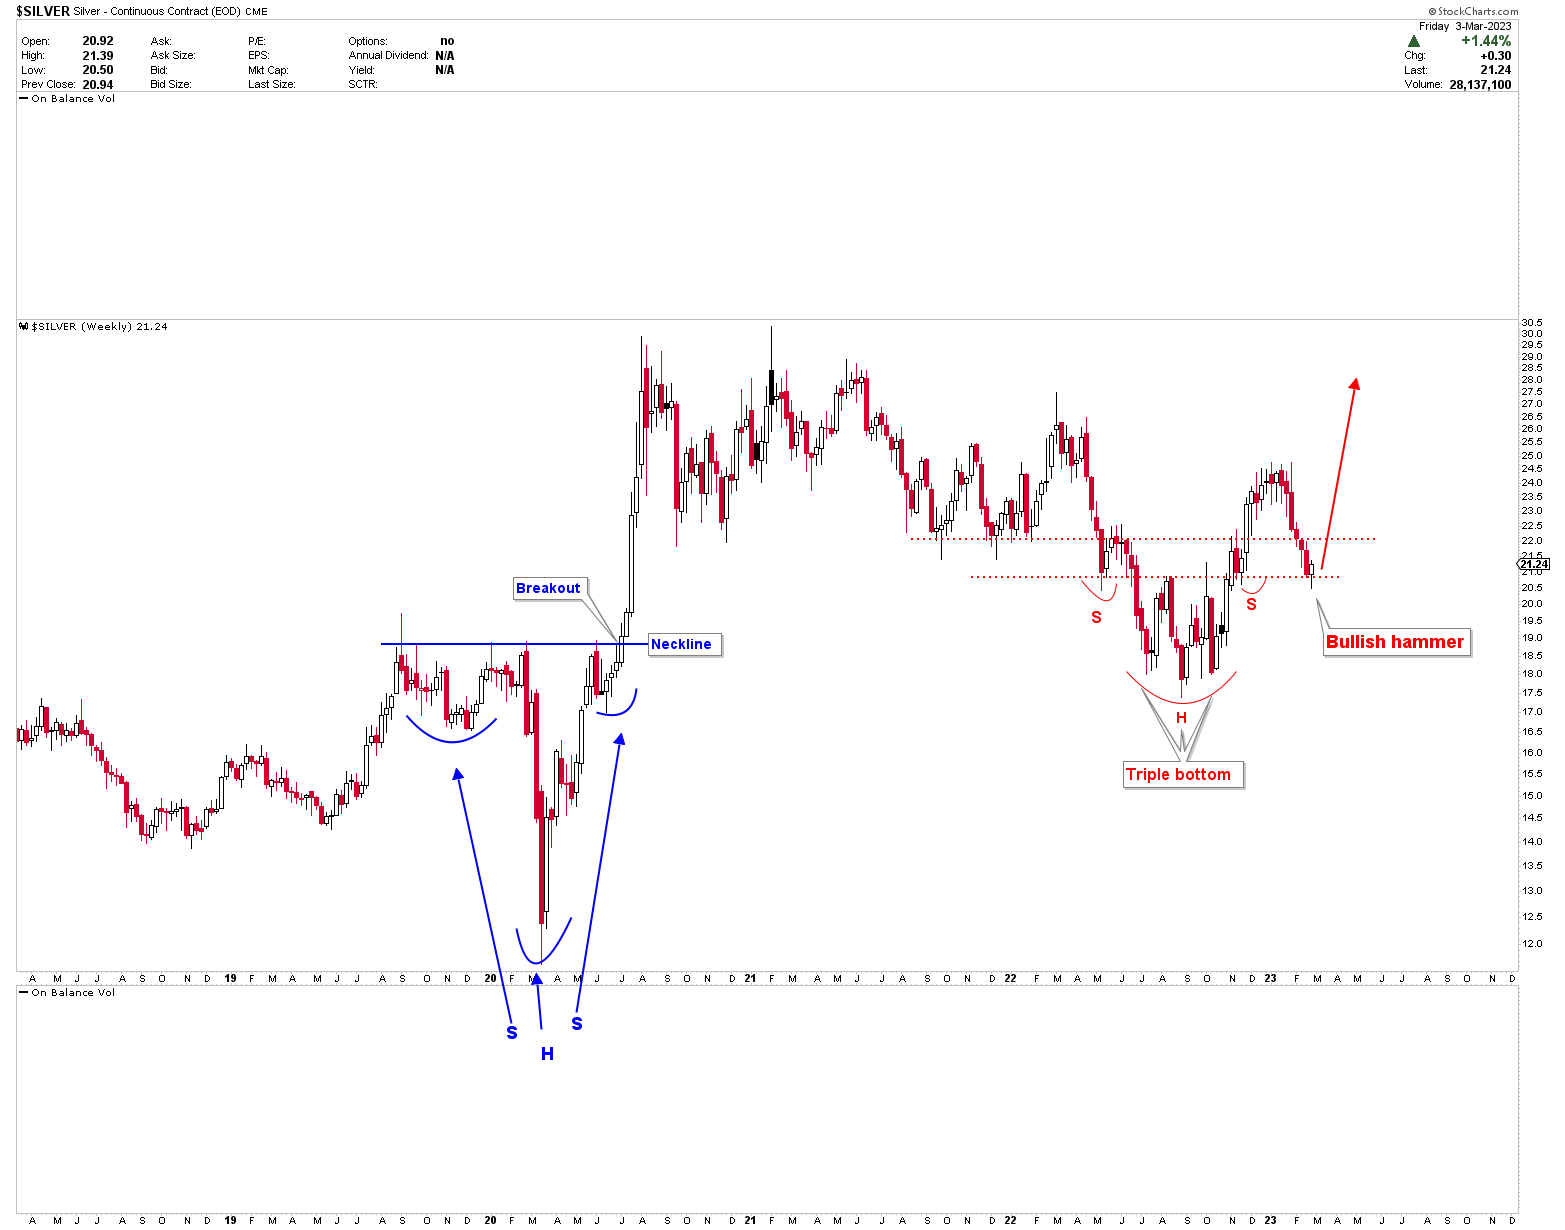
The chart below reveals that the price structure shows a rounding bottom at the blue dotted channel support, which represents another important key support at the $19-$20 region. The recent decline in the silver market support at the red trendline provides further strength in prices at current levels. A bullish hammer at the red trend line suggests that the silver market could rise from these levels. The first immediate resistance will be at the blue channel line between $23 and $24, and this time the likelihood of a breakout higher is greater. The blue arrow in the following chart indicates the future direction of silver prices.
Weekly Chart (stockcharts.com)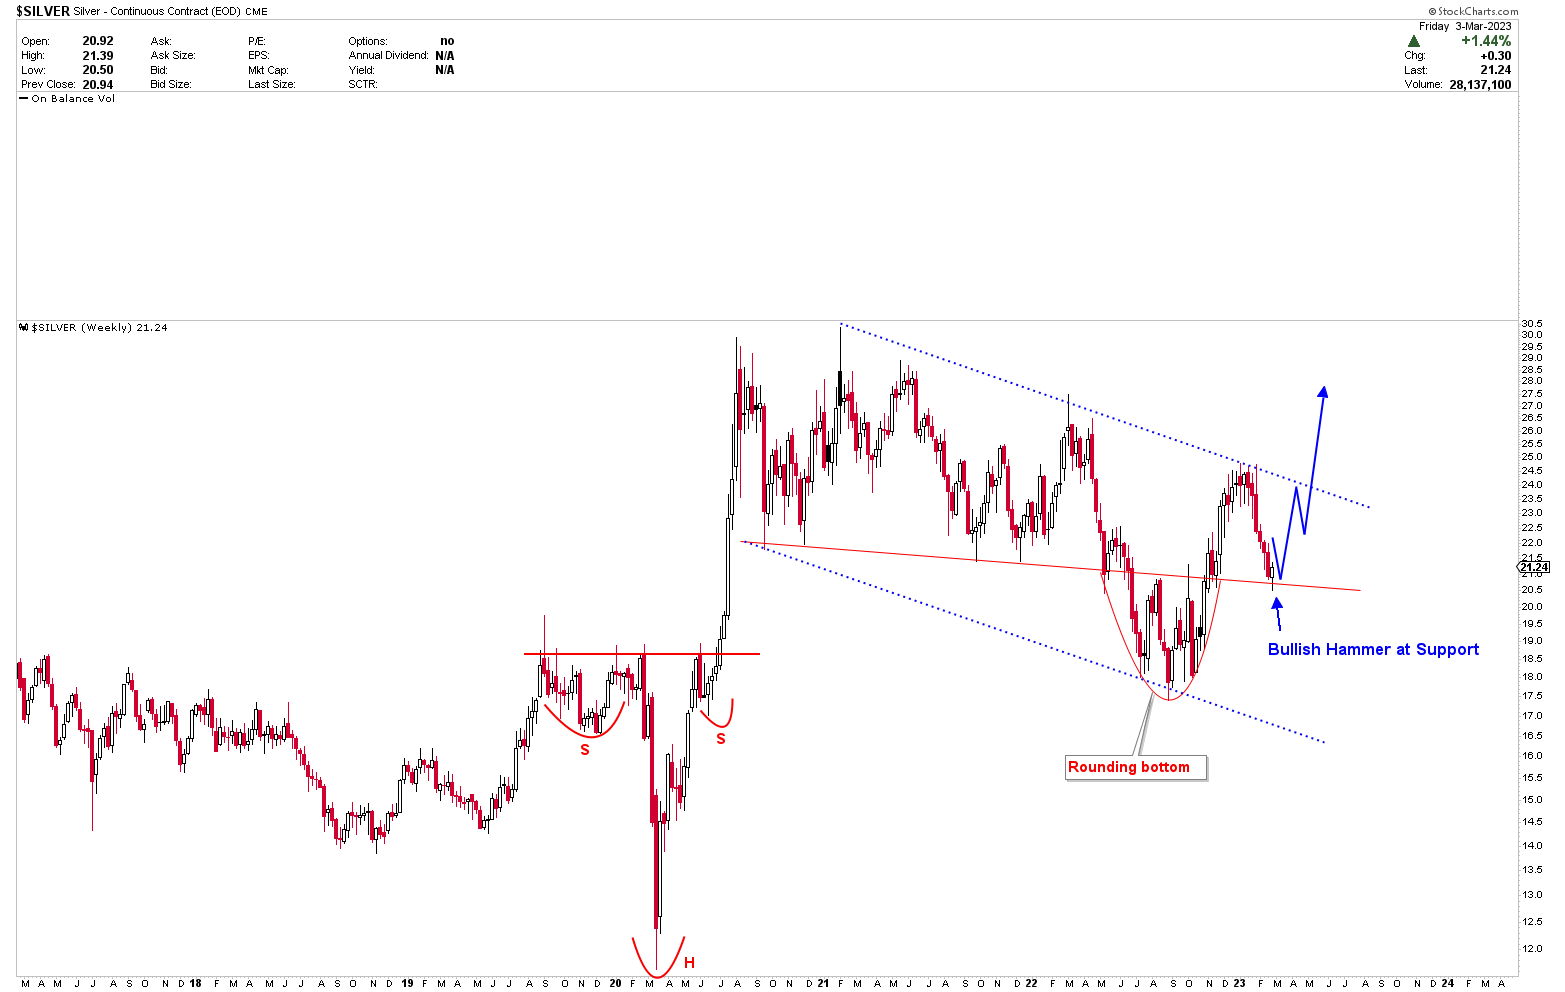
Since silver remains in a long-term uptrend, the Fibonacci instrument is used to observe the key levels where the silver market may find support for the next move higher. The Fibonacci retracement tool is used to identify potential price support and resistance levels for any financial instrument. Silver moved 160.74% from lows of $11.64 in March 2020 to highs of $30.35 in February 2021, and it was anticipated that the market would retrace a portion of this move before resuming an uptrend. It is observed from the below chart that the silver market has corrected back to a 61.8% retracement level of $18.79. Before rising again, the price fluctuated widely around this level due to high volatility. Triple bottom support at the 61.8% retracement level sparked a strong upward rebound. Recently, the silver price has once again retraced to a 50% level at $20.99. Last week, a bullish hammer was observed at the 50% retracement level, and the weekly close was above $20.99, signaling a strong buying opportunity.
Weekly Chart (stockcharts.com)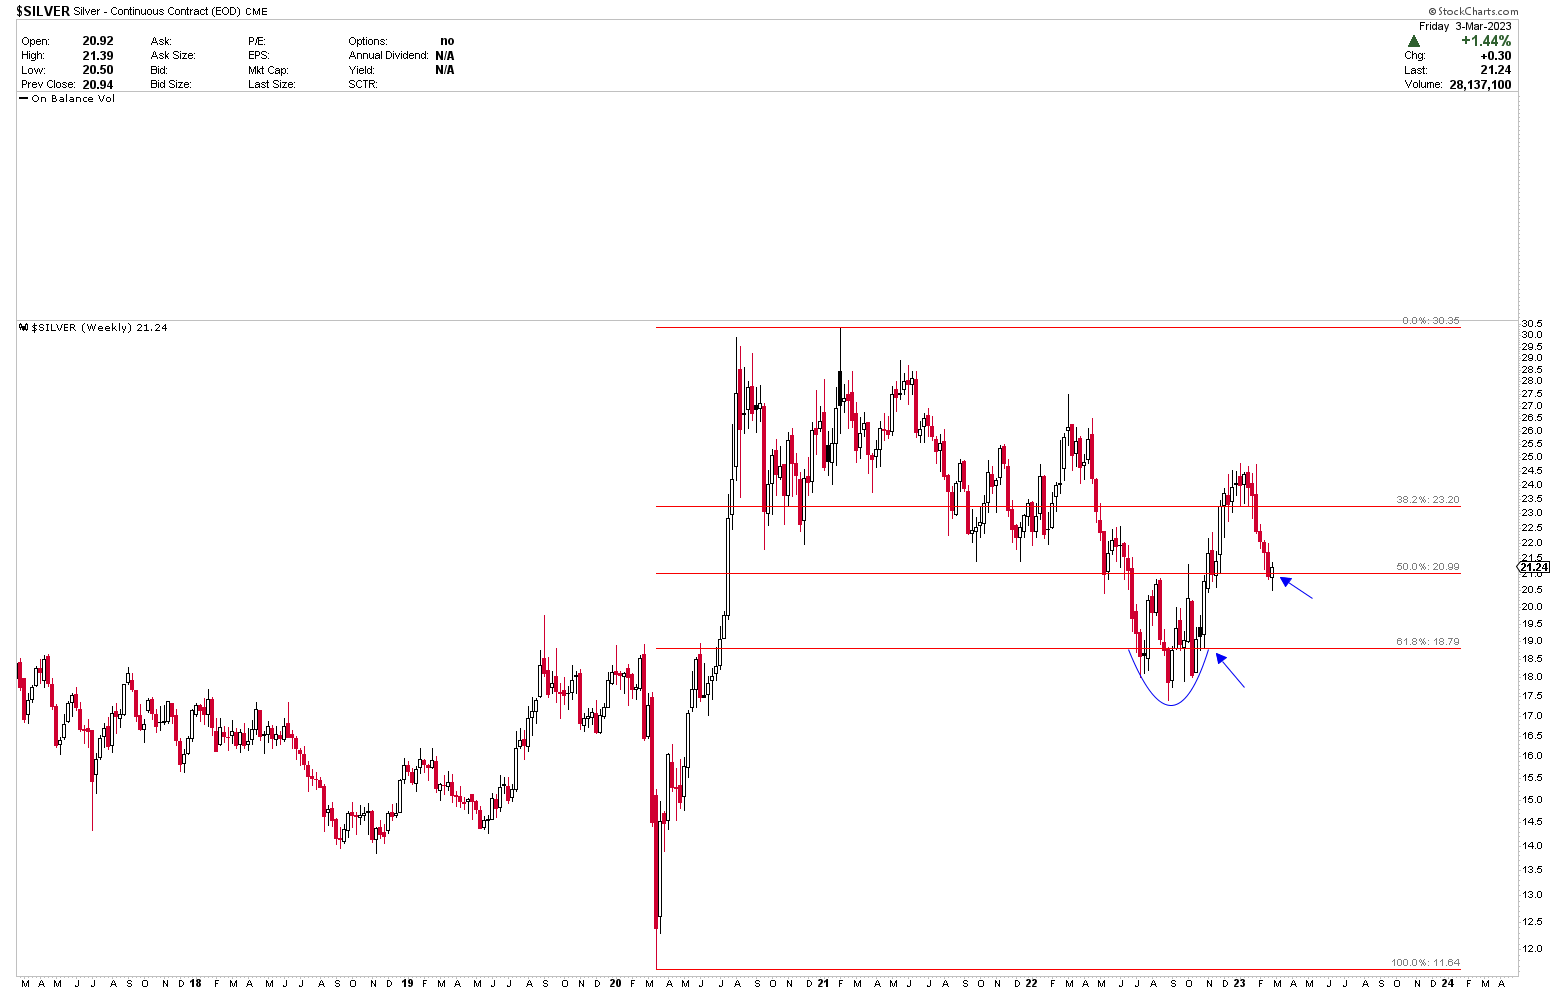
Risk Factors
SLV and PSLV are affected by the highly volatile silver prices. The market's volatility arises from global economic conditions, geopolitical events, and fluctuations in supply and demand. The SLV and PSLV funds rely on third-party custodians to hold physical silver assets. The custodian's financial difficulties may have an effect on the investment. While the silver market is exhibiting strong price action, there is a slight chance that the $18.79 Fibonacci support fails. A breach of $18.79 poses a threat to the silver market and suggests further losses. Therefore, silver must maintain a weekly closing price above $18.79 for the bullish outlook to remain valid.
Conclusion
Based on the above discussion, the PCE and CPI data indicate an inflationary environment. To combat high inflation, the Federal Reserve is likely to keep high-interest rates for a longer time. The loosening of financial conditions in the United States, as indicated by the decline in the NFCI, indicates risk in the nation. The inflationary environment is bullish for silver prices because it reduces the purchasing power of fiat currencies, making silver a more attractive store of value. As paper currencies lose value, investors seek tangible assets such as silver to preserve wealth. On the other hand, the technical picture of the silver market is strongly bullish, and the price range of $19 to $20 is long-term support. Last week's decline to $20.42 coupled with the appearance of a bullish hammer signals a robust buying opportunity. SLV and PSLV are attractive investment options to capitalize on bullish silver market price action.
This article was written by

Disclosure: I/we have no stock, option or similar derivative position in any of the companies mentioned, and no plans to initiate any such positions within the next 72 hours. I wrote this article myself, and it expresses my own opinions. I am not receiving compensation for it (other than from Seeking Alpha). I have no business relationship with any company whose stock is mentioned in this article.